Gain more k-means clustering data analysis performance per dollar with 3rd Gen AMD EPYC 75F3 processor-powered Dell EMC PowerEdge R6525 servers
•
0 likes•20 views

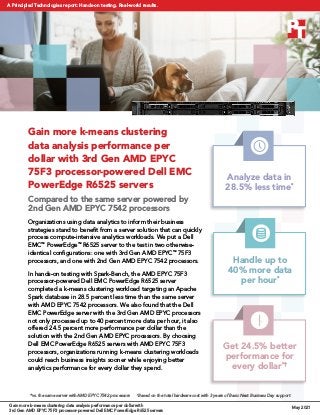
Compared to the same server powered by 2nd Gen AMD EPYC 7542 processors

Recommended
Recommended
More Related Content
More from Principled Technologies
More from Principled Technologies (20)
Recently uploaded
Recently uploaded (20)
Gain more k-means clustering data analysis performance per dollar with 3rd Gen AMD EPYC 75F3 processor-powered Dell EMC PowerEdge R6525 servers
- 1. Gain more k-means clustering data analysis performance per dollar with 3rd Gen AMD EPYC 75F3 processor-powered Dell EMC PowerEdge R6525 servers Compared to the same server powered by 2nd Gen AMD EPYC 7542 processors Organizations using data analytics to inform their business strategies stand to benefit from a server solution that can quickly process compute-intensive analytics workloads. We put a Dell EMC™ PowerEdge™ R6525 server to the test in two otherwise- identical configurations: one with 3rd Gen AMD EPYC™ 75F3 processors, and one with 2nd Gen AMD EPYC 7542 processors. In hands-on testing with Spark-Bench, the AMD EPYC 75F3 processor-powered Dell EMC PowerEdge R6525 server completed a k-means clustering workload targeting an Apache Spark database in 28.5 percent less time than the same server with AMD EPYC 7542 processors. We also found that the Dell EMC PowerEdge server with the 3rd Gen AMD EPYC processors not only processed up to 40 percent more data per hour, it also offered 24.5 percent more performance per dollar than the solution with the 2nd Gen AMD EPYC processors. By choosing Dell EMC PowerEdge R6525 servers with AMD EPYC 75F3 processors, organizations running k-means clustering workloads could reach business insights sooner while enjoying better analytics performance for every dollar they spend. Analyze data in 28.5% less time* Get 24.5% better performance for every dollar*† Handle up to 40% more data per hour* *vs. the same server with AMD EPYC 7542 processors † Based on the total hardware cost with 3 years of Basic Next Business Day support Gain more k-means clustering data analysis performance per dollar with 3rd Gen AMD EPYC 75F3 processor-powered Dell EMC PowerEdge R6525 servers May 2021 A Principled Technologies report: Hands-on testing. Real-world results.
- 2. How we tested In our data center, we tested the following configurations: • A Dell EMC PowerEdge R6525 server powered by AMD EPYC 75F3 processors. As of April 5, 2021, the list price of this hardware plus Basic Next Business Day support (36 months) was $64,650.01.1 • A Dell EMC PowerEdge R6525 server powered by AMD EPYC 7542 processors. As of April 5, 2021, the list price of this hardware plus Basic Next Business Day support (36 months) was $57,510.01.2 In each configuration, we used the same 1,024 GB of 3,200MHz RAM; two 480GB, 6Gbps SATA M.2 SSDs; and four 1.92TB PCIe® Gen4 NVMe™ SSDs. During testing, we first ran a k-means clustering workload using Spark-Bench, targeting a Spark database on each server under test. We recorded the total time each configuration took to complete the workload, as reported by Spark. We then divided the dataset size (811GB) by that time to calculate the rate of megabytes per hour (MB/hour) that each solution processed. To calculate the performance-to-cost ratio, we divided the MB/ hour throughput results by the price of hardware and support. For more details about our configurations, testing methodology, and cost calculations, see the science behind the report. About AMD EPYC 75F3 processors These 32-core processors use AMD Infinity Architecture and are part of the AMD EPYC 7003 Series. The latest offering from AMD, 3rd Gen EPYC processors offer increased I/O with up to 32MB L3 cache per core, 7nm x86 hybrid die core, and new security features like Secure Encrypted Virtualization - Secure Nested Paging (SEV-SNP) and Encrypted State (SEV-ES).3 AMD positions the EPYC 75F3 model as being well suited for high-frequency use cases such as CAE/CFD/FEA, VM density, and VDI.4 Learn more at https://www.amd.com/en/processors/ epyc-7003-series. May 2021 | 2 Gain more k-means clustering data analysis performance per dollar with 3rd Gen AMD EPYC 75F3 processor-powered Dell EMC PowerEdge R6525 servers
- 3. Get insights sooner We used a Spark-Bench k-means clustering workload to conduct our data analytics testing. K-means clustering is a machine learning algorithm that helps organizations identify patterns within datasets by sorting data into similar groups or clusters. A solution that can complete a k-means workload, and thus deliver data insights, in less time can enable your organization to act on these insights sooner—for example, by adjusting your marketing strategy to target a new demographic. (See page 4 for more examples of real-world benefits). Note: although our testing measured the analytics performance of just one Dell EMC PowerEdge server, organizations running big data analytics workloads typically use larger server clusters. As Figure 1 illustrates, the 3rd Gen AMD EPYC 75F3 processor-powered Dell EMC PowerEdge R6525 completed the k-means workload in 2 hours—an improvement of 28.5 percent over the configuration with the AMD EPYC 7542 processors, which took 2 hours and 48 minutes to finish the workload. About Dell EMC PowerEdge R6525 servers According to Dell Technologies, these servers offer the following specifications:5 • Up to 128 high-performance 3rd Gen AMD EPYC cores in two sockets • Up to 32 DDR4 RDIMM/LRDIMM slots • Support for PCIe Gen4 NVMe SSDs • Integrated security features • Embedded management tools To learn more, visit https://www.dell.com/en-us/work/shop/povw/poweredge-R6525. Figure 1: Time in hours to complete the Spark-Bench k-means workload on an 811GB dataset. Lower is better. Source: Principled Technologies. Time (hours, lower is better) 2.8 2.0 Dell EMC PowerEdge R6525 server with 3rd Gen AMD EPYC 75F3 processors Dell EMC PowerEdge R6525 server with 2nd Gen AMD EPYC 7542 processors May 2021 | 3 Gain more k-means clustering data analysis performance per dollar with 3rd Gen AMD EPYC 75F3 processor-powered Dell EMC PowerEdge R6525 servers
- 4. More efficient data processing To arrive at our processing rate (the rate of MB/hour each solution processed), we divided the size of the dataset (811GB) by the time each solution took to finish the k-means workload. The numbers below thus represent the rate of processing the dataset, rather than disk or networking throughput. Figure 2 shows that the AMD EPYC 75F3 processor-powered Dell EMC PowerEdge R6525 server processed 405,500 MB/hour, while the AMD EPYC 7542 processor-powered configuration handled 289,642 MB/hour—meaning the 3rd Gen AMD processor- powered Dell EMC PowerEdge server processed 40 percent more data per hour. Figure 2: Average data processing rate (MB/hour) during the Spark-Bench k-means workload. Higher is better. Source: Principled Technologies. Real-world benefits for financial services Using Spark to run data analytics, financial institutions can quickly identify credit fraud, analyze regulatory filing, compile customer profiles, and target marketing, allowing them more time to make critical decisions, interface with clients, and keep operations running smoothly.6,7 Choosing Dell EMC PowerEdge R6525 servers with 3rd Gen AMD EPYC 75F3 processors could help analyze that data in 28.5 percent less time and at a 40 percent higher rate than the same servers with 2nd Gen AMD EPYC 7542 processors. And with quicker results, organizations could keep their clients’ assets secure and expand their customer base efficiently—all while getting 24.5 percent better performance for each dollar they’ve invested. Data processing rate (MB/hour, higher is better) 289,642 405,500 Dell EMC PowerEdge R6525 server with 3rd Gen AMD EPYC 75F3 processors Dell EMC PowerEdge R6525 server with 2nd Gen AMD EPYC 7542 processors May 2021 | 4 Gain more k-means clustering data analysis performance per dollar with 3rd Gen AMD EPYC 75F3 processor-powered Dell EMC PowerEdge R6525 servers
- 5. Achieve better performance per dollar To arrive at our performance-to-cost ratio, we first determined the list prices of hardware plus support for both configurations of the Dell EMC PowerEdge R6525 server, which we show on page 2. We then divided the processing rate we describe on page 4 by the system cost to arrive at a performance-to-cost ratio. We found that the Dell EMC PowerEdge R6525 with AMD EPYC 75F3 processors handled 6.27 MB per hour for each dollar of the list price, while the configuration with AMD EPYC 7542 processors offered a ratio of 5.03 MB per hour for each dollar (Figure 3). This means that for every dollar an organization spends on hardware and support for the Dell EMC PowerEdge R6525 server with 3rd Gen AMD EPYC 75F3 processors, they could get 24.5 percent higher application throughput than the same server with the 2nd Gen AMD EPYC processors. Figure 3: Ratio of k-means performance (as measured by the number of MB/hour each solution processed) to hardware and support cost per US dollar. Higher is better. Source: Principled Technologies. Performance/cost ratio (MB/hour per dollar, higher is better) 5.03 6.27 Dell EMC PowerEdge R6525 server with 3rd Gen AMD EPYC 75F3 processors Dell EMC PowerEdge R6525 server with 2nd Gen AMD EPYC 7542 processors May 2021 | 5 Gain more k-means clustering data analysis performance per dollar with 3rd Gen AMD EPYC 75F3 processor-powered Dell EMC PowerEdge R6525 servers
- 6. Conclusion Organizations that rely on data analytics workloads could benefit from new hardware that takes less time to run k-means machine learning algorithms while offering better performance per dollar. When we compared the k-means performance of a Dell EMC PowerEdge R6525 with 3rd Gen AMD EPYC 75F3 processors to that of the same server with AMD EPYC 7542 processors, we found that the solution with the 3rd Gen AMD EPYC processors completed a k-means clustering workload on the Spark-Bench benchmark in 28.5 percent less time. Based on our processing rate calculations, the 3rd Gen AMD EPYC processor-powered Dell EMC PowerEdge server handled up to 40 percent more data per hour. Factoring this performance into the hardware and support list price, we also found that this configuration offered 24.5 percent better performance per dollar. These results indicate that organizations running k-means workloads could reach business insights sooner and get improved performance for every dollar they spend on the Dell EMC PowerEdge R6525 powered by 3rd Gen AMD EPYC 75F3 processors. 1 “PowerEdge R6525 Rack Server,” accessed April 5, 2021, https://www.dell.com/en-us/work/shop/cty/pdp/spd/poweredge-r6525/pe_r6525_13783_vi_vp. 2 “PowerEdge R6525 Rack Server.” 3 “AMD EPYC 7003 Series Processors,” accessed April 5, 2021, https://www.amd.com/en/processors/epyc-7003-series. 4 “AMD EPYC 75F3,” accessed April 5, 2021, https://www.amd.com/en/products/cpu/amd-epyc-75f3. 5 “R6525 Spec Sheet,” accessed April 7, 2021, https://i.dell.com/sites/csdocuments/Product_Docs/en/poweredge-r6525-spec-sheet.pdf. 6 Chris D’Agostino, “Credit Fraud Prevention with Spark and Graph Analysis.” Spark Summit, June 11, 2016. YouTube video, 18:59, accessed February 17, 2021, https://youtu.be/0VO-ts0dsbI. 7 Level Up Education, “How are Big Companies using Apache Spark,” accessed February 17, 2021, https://medium.com/@tao_66792/how-are-big-companies-using-apache-spark-413743dbbbae. Principled Technologies is a registered trademark of Principled Technologies, Inc. All other product names are the trademarks of their respective owners. For additional information, review the science behind this report. Principled Technologies® Facts matter.® Principled Technologies® Facts matter.® This project was commissioned by Dell Technologies. Read the science behind this report at http://facts.pt/MnKmAMQ May 2021 | 6 Gain more k-means clustering data analysis performance per dollar with 3rd Gen AMD EPYC 75F3 processor-powered Dell EMC PowerEdge R6525 servers