From Luxury Escort Service Kamathipura : 9352852248 Make on-demand Arrangemen...
Weekly Market Report
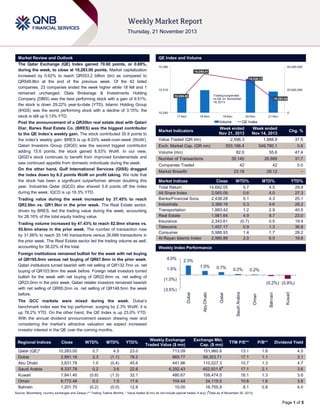
1. 10,336.13
10,310
20,000,000
Qatar (QE)*
Dubai
Abu Dhabi
Saudi Arabia
Kuwait
Oman
Bahrain
Close
10,283.00
2,891.16
3,831.78
8,337.78
7,841.40
6,772.48
1,201.70
WTD%
MTD%
YTD%
0.7
2.3
1.0
0.2
(0.8)
0.2
(0.2)
4.5
(1.1)
(0.4)
3.6
(1.3)
1.5
(0.0)
23.0
78.2
45.6
22.6
32.1
17.6
12.8
10,283.00
10,240
0
17-Nov
18-Nov
19-Nov
20-Nov
Volume
QE Index
Week ended
Nov 14, 2013
1,888.9
553,188.4
549,780.1
0.6
82.0
55.6
47.4
35,140
26,689
31.7
42
42
0.0
23:18
Value Traded (QR mn)
29:12
–
Exch. Market Cap. (QR mn)
Volume (mn)
Number of Transactions
Companies Traded
Market Breadth
Market Indices
Close
Total Return
14,692.05
All Share Index
2,565.09
Banks/Financial Svcs.
2,438.28
Industrials
3,368.19
Transportation
1,883.42
Real Estate
1,981.64
Insurance
2,343.61
Telecoms
1,457.17
Consumer
5,988.93
Al Rayan Islamic Index
2,980.89
Market Indices
Weekly Index Performance
WTD%
0.7
0.6
0.1
0.3
1.2
4.9
(0.7)
0.9
1.4
2.0
Chg. %
37.5
MTD%
4.5
4.0
4.3
4.6
2.9
8.7
0.5
1.3
1.7
6.0
YTD%
29.9
27.3
25.1
28.2
40.5
23.0
19.4
36.8
28.2
19.8
2.3%
1.0%
1.5%
0.7%
0.2%
0.2%
(1.0%)
Weekly Exchange
Traded Value ($ mn)
713.09
869.77
441.96
6,292.43
480.67
104.44
10.00
Exchange Mkt.
Cap. ($ mn)
151,960.8
69,303.71
110,027.3
452,931.8#
108,474.5
24,119.5
16,705.9
Oman
(3.5%)
Kuwait
(0.2%) (0.8%)
Bahrain
4.0%
21-Nov
Week ended
Nov 21, 2013
2,596.3
Market Indicators
The GCC markets were mixed during the week. Dubai‟s
benchmark index was the top performer, surging by 2.3% WoW; it is
up 78.2% YTD. On the other hand, the QE Index is up 23.0% YTD.
With the annual dividend announcement season drawing near and
considering the market‟s attractive valuation we expect increased
investor interest in the QE over the coming months.
Regional Indices
Trading suspended
on QE on November
19, 2013
10,284.80
Saudi Arabia
Foreign institutions remained bullish for the week with net buying
of QR195.0mn versus net buying of QR67.8mn in the prior week.
Qatari institutions turned bearish with net selling of QR132.7mn vs. net
buying of QR103.9mn the week before. Foreign retail investors turned
bullish for the week with net buying of QR22.6mn vs. net selling of
QR23.0mn in the prior week. Qatari retailer investors remained bearish
with net selling of QR85.2mn vs. net selling of QR148.5mn the week
before.
40,000,000
10,359.41
Qatar
Trading volume increased by 47.43% to reach 82.0mn shares vs.
55.6mn shares in the prior week. The number of transaction rose
by 31.66% to reach 35,140 transactions versus 26,689 transactions in
the prior week. The Real Estate sector led the trading volume as well,
accounting for 38.22% of the total.
10,380
Abu Dhabi
Trading value during the week increased by 37.45% to reach
QR2.6bn vs. QR1.9bn in the prior week. The Real Estate sector,
driven by BRES, led the trading value during the week, accounting
for 28.16% of the total equity trading value.
QE Index and Volume
Dubai
Market Review and Outlook
The Qatar Exchange (QE) Index gained 70.60 points, or 0.69%,
during the week, to close at 10,283.00 points. Market capitalization
increased by 0.62% to reach QR553.2 billion (bn) as compared to
QR549.8bn at the end of the previous week. Of the 42 listed
companies, 23 companies ended the week higher while 18 fell and 1
remained unchanged. Dlala Brokerage & Investments Holding
Company (DBIS) was the best performing stock with a gain of 9.51%;
the stock is down 29.22% year-to-date (YTD). Islamic Holding Group
(IHGS) was the worst performing stock with a decline of 3.15%; the
stock is still up 5.13% YTD.
Post the announcement of a QR20bn real estate deal with Qatari
Diar, Barwa Real Estate Co. (BRES) was the biggest contributor
to the QE Index’s weekly gain. The stock contributed 35.9 points to
the index‟s weekly gain; BRES is up 8.03% week-over-week (WoW).
Qatari Investors Group (QIGD) was the second biggest contributor
adding 15.6 points; the stock gained 8.53% WoW. In our view,
QIGD‟s stock continues to benefit from improved fundamentals and
saw continued appetite from domestic individuals during the week.
On the other hand, Gulf International Services (GISS) dragged
the index down by 6.2 points WoW on profit taking. We note that
the stock has been a significant outperformer almost doubling this
year. Industries Qatar (IQCD) also shaved 5.8 points off the index
during the week; IQCD is up 18.3% YTD.
TTM P/E**
P/B**
Dividend Yield
13.1
17.1
10.7
17.1
18.1
10.8
8.1
1.8
1.1
1.3
2.1
1.3
1.6
0.8
4.5
3.1
4.7
3.6
3.6
3.8
4.0
#
Source: Bloomberg, country exchanges and Zawya (** Trailing Twelve Months; * Value traded ($ mn) do not include special trades, if any) ( Data as of November 20, 2013)
Page 1 of 5
2. News
Economic News
Qatari house rents rise steadily – According to the consumer
price index (CPI) figures released by the Ministry of
Development Planning & Statistics, house rents in Qatar have
continued to rise due to increasing demand for housing fuelled
by rising population. Rent inflation stood at 6.2% YoY by
October-end, while the overall consumer inflation was less than
half at 2.8%. Food, textiles, home appliances, medical care and
entertainment have all become costlier in a year, with food
segment rising by 2.6%. The ministry said rising rentals of
residential buildings were the main contributing factor for the
rise in the CPI's "rent, fuel and energy" group. These three
items are clubbed together and have a weight of 32.2% in the
CPI basket. Further, figures showed that rents were slightly up
by 0.8% in October over September. (Peninsula Qatar)
Qatar to spend more than $156bn on construction by 2030
– According to a report by EC Harris, Qatar is due to spend
$156.8bn on implementing major construction programs by
2030. These construction programs in Qatar – costing $1bn or
more – are due to peak in 2016 with $34bn worth of projects
due to be delivered. Further, the report showed that some 117
major programs are planned across the Middle East to be
completed by 2030, costing more than $1tn. (Gulf-Times.com)
Market & Corporate News
VFQS FY2014 guidance in line with model – Slightly lowerthan-expected top-line and higher depreciation charges
contributed to marginal September quarter net income miss.
Vodafone Qatar (VFQS) reported revenue of QR465mn for
2QFY2014 (+1% QoQ, +35% YoY) only 2% shy of our estimate
of QR475mn. Net loss of QR75mn (vs. QR85mn in June 2013
and QR122mn in September 2012) was 5% worse than our
estimate of QR71mn with higher-than-expected depreciation
charges contributing to the net income divergence. As
expected, VFQS management provided FY2014 guidance
during the conference call. VFQS expects QR1.90-QR1.95bn in
revenue, implying YoY growth in the range of 24%-28%; our
modeled estimate was QR1.90bn (BBG mean: QR1.87bn). On
the EBITDA front, VFQS expects to post around QR435QR470mn, up by 53%-66% YoY; we had been expecting an
EBITDA of QR446mn (BBG consensus: QR442mn). This
implies an EBITDA margin within 22.9%-24.1% vs. 18.6% in
FY2013. On the capex front, VFQS projects to spend around
18% of revenue vs. 26% in FY2013. Overall FY2014 guidance
is in line with our estimates. Finally, we continue to expect
VFQS to pay QR0.10 in dividends per share in FY2014.
(QNBFS Research, VFQS press release)
Banking sector loans outpace deposits in the month of
October 2013 – Deposits increased by 1.5% MoM (+16.6%
YTD) while loans grew by 2.7% MoM (+12.0% YTD) in the
month of October 2013. Going forward, we expect activity in the
banking sector to further pick up in the coming months. Hence,
we expect loan growth of ~15% for 2013 vs.12.0% YTD. The
banking sector‟s loan-to-deposit ratio (LDR) increased to 107%
at the end of October 2013 vs. 106% in September 2013. Going
forward, some banks are contemplating issuing Tier I bonds
(eg. Doha Bank and the Commercial Bank of Qatar), which
should help improve their capital adequacy ratios (CARs) as
well as provide additional funds aiding loan book growth.
(QNBFS Research, QCB)
Ooredoo gears up for debut sukuk – Ooredoo has hired five
banks to arrange the sale of its first dollar-denominated Islamic
bond (sukuk) offering. The banks mandated act as joint lead
managers and bookrunners for the sukuk issue are DBS Bank,
Deutsche Bank, HSBC, QInvest and QNB Capital. Starting from
November 22, the Qatari telecom company will embark on
roadshows to meet key investors across the Middle East, Asia
and Europe. The size and pricing of the offering would be
determined later. (Bloomberg)
QDB signs MoU with QNB to boost global presence – The
Qatar Development Bank (QDB) has signed a memorandum of
understanding (MoU) with QNB to make further inroads into
overseas markets. Both the institutions will mutually develop
plans to ensure that export-led Qatari companies and foreign
importers of Qatari non-oil products receive financial facilities
offered by Tasdeer, QDB‟s export arm. Under the new
agreement, financial services teams of QNB‟s overseas
branches will highlight the financial facilities offered by Tasdeer
to foreign importers, while QDB will commit to offering financial
services and discounts to foreign importers in partnership with
QNB. The two banks will be conducting joint visits to QNB‟s
national and international customers to familiarize them with the
services. (Gulf-Times.com)
Barwa Bank earns QR442mn net income in 9M2013 – Barwa
Bank has earned a net income worth QR442mn for the ninemonth period up to September 2013, rising 60% over
QR279mn in 9M2012. Total income increased by 26% to
QR1.1bn in the nine months as compared with QR855mn in the
same period in 2012. EPS rose to QR1.49 in September 2013
compared with QR0.94 in September 2012. (Gulf-Times.com)
DHBK to raise capital via private placement or bonds;
opens office in Sharjah – Doha Bank‟s (DHBK) CEO
Raghavan Seetharaman said the bank is planning to raise its
capital via private placement or bonds. He added that
depending on market conditions, DHBK will either opt for a
private placement or bond issuance. He also said that DHBK is
planning to expand its capital by QR2bn within this year
(deadline is end-1Q2014, EOGM to be held on Nov. 24, 2013)
and seeks approval for a $549mn perpetual bond issue.
Meanwhile, the bank has opened its first representative office in
Sharjah, following regulatory approval from the UAE Central
Bank. (Bloomberg, Gulf-Times.com)
GISS updates investors on Al Koot – Gulf International
Services Company (GISS) has confirmed that discussions
regarding change of ownership of Al Koot (wholly-owned
insurance and reinsurance firm) have been put indefinitely on
hold. Hence, no major change is expected in the company
structure or in its operation. (QE)
Gulf Helicopters orders 15 AW189 helicopters – Gulf
Helicopters of Qatar has ordered fifteen AgustaWestland
AW189 helicopters. This ordering follows the preliminary sale
contract announced in early 2012, confirming the operator's
commitment to the new model. The first two aircraft will be
delivered to Gulf Helicopters in 2014, with the remainder
delivered through 2017. (Bloomberg)
Barwa Real Estate inks MoA with Qatari Diar – Barwa Real
Estate has signed a memorandum of agreement (MoA) with its
strategic partner, Qatari Diar (45% owner of Barwa). The
agreement covers selling assets worth QR20bn that needs to
be implemented latest by June 30, 2014. This agreement is a
part of Barwa‟s plans to restructure its finances in order to
reduce debt, which would reflect positively on its financial
statements. (QE)
Page 2 of 5
3. Qatar Exchange
Top 5 Gainers
Top 5 Decliners
0.0%
12.0%
9.5%
9.4%
8.5%
8.0%
8.0%
7.8%
-2.0%
-1.7%
-1.8%
-1.9%
-2.7%
-3.2%
4.0%
-4.0%
0.0%
Dlala Holding
Medicare
Group
Qatari
Investors
Group
Barwa Real
Estate
Vodafone
Qatar
Source: Qatar Exchange (QE)
-6.0%
Islamic
Holding Group
Doha
Insurance
Gulf
International
Services
Widam Food Mannai Corp.
Co.
Source: Qatar Exchange (QE)
Most Active Shares by Value (QR Million)
Most Active Shares by Volume (Million)
600.0
18.0
14.4
415.4
377.1
400.0
11.7
12.0
9.7
9.6
6.6
225.1
200.0
173.0
171.8
6.0
0.0
0.0
Barwa Real
Estate
Qatari
Investors
Group
United
Development
Masraf Al
Rayan
Source: Qatar Exchange (QE)
16.45%
60%
Vodafone
Qatar
Non-Qatari
560
777
30.99%
40%
44.19%
United
Mazaya Qatar
Development
218
13.48%
25.88%
Qatari
Investors
Group
Net Traded Value by Nationality (QR Million)
8.94%
12.61%
80%
Barwa Real
Estate
Source: Qatar Exchange (QE)
Investor Trading Percentage to Total Value Traded
100%
Medicare
Group
47.47%
(218)
20%
Qatari
2,037
1,819
0%
Buy
Sell
Qatari Individuals
Qatari Institutions
Non-Qatari Individuals
Non-Qatari Institutions
Source: Qatar Exchange (QE)
(500)
Net Investment
500
1,000
Total Sold
1,500
2,000
2,500
Total Bought
Source: Qatar Exchange (QE)
Page 3 of 5
4. TECHNICAL ANALYSIS OF THE QE INDEX
Source: Bloomberg
The QE Index continued its uptrend for the third consecutive week and gained 70.60 points (0.69%) to close at 10,283.0, but the rally lost some steam over
the last couple of days. It was a short week for the markets, with only four trading sessions, after trading was cancelled on Tuesday. The index started the
week on a strong note, as the gains were supported by good trading volumes. However, traders looked to book profits over the last couple of days, after the
sharp run-up in the past three weeks. If the index holds above its support level of 10,220, we believe the uptrend will continue, with the 10,360 level acting
as a strong resistance zone. On the other hand, if the index penetrates below this level, it may fall toward its support of 10,150.0-10,100.0, which would be a
good level for buyers to step in. Meanwhile, the RSI has begun to trend lower from the overbought zone, indicating that the market may witness some
correction over the short-term.
DEFINITIONS OF KEY TERMS USED IN TECHNICAL ANALYSIS
RSI (Relative Strength Index) indicator – RSI is a momentum oscillator that measures the speed and change of price movements. The RSI oscillates
between 0 to 100. The index is deemed to be overbought once the RSI approaches the 70 level, indicating that a correction is likely. On the other hand, if
the RSI approaches 30, it is an indication that the index may be getting oversold and therefore likely to bounce back.
MACD (Moving Average Convergence Divergence) indicator – The indicator consists of the MACD line and a signal line. The divergence or the
convergence of the MACD line with the signal line indicates the strength in the momentum during the uptrend or downtrend, as the case may be. When the
MACD crosses the signal line from below and trades above it, it gives a positive indication. The reverse is the situation for a bearish trend.
Candlestick chart – A candlestick chart is a price chart that displays the high, low, open, and close for a security. The „body‟ of the chart is portion between
the open and close price, while the high and low intraday movements form the „shadow‟. The candlestick may represent any time frame. We use a one-day
candlestick chart (every candlestick represents one trading day) in our analysis.
Doji candlestick pattern – A Doji candlestick is formed when a security's open and close are practically equal. The pattern indicates indecisiveness, and
based on preceding price actions and future confirmation, may indicate a bullish or bearish trend reversal.
Shooting Star/Inverted Hammer candlestick patterns – These candlestick patterns have a small real body (open price and close price are near to each
other), and a long upper shadow (large intraday movement on the upside). The Shooting Star is a bearish reversal pattern that forms after a rally. The
Inverted Hammer looks exactly like a Shooting Star, but forms after a downtrend. Inverted Hammers represent a potential bullish trend reversal.
Page 4 of 5
5. Price % Change 5(Nov 21)
Day
Company Name
173.00
Qatar National Bank
% Change
Monthly
Market Cap.
QR Million
TTM P/E
P/B
Div. Yield
(0.29)
4.22
121,053
13.1
2.4
3.5
Qatar Islamic Bank
68.50
0.29
1.18
16,186
15.0
1.4
5.5
Commercial Bank of Qatar
69.40
(0.57)
4.68
17,173
9.8
1.2
8.6
Doha Bank
56.80
0.00
3.27
14,676
10.0
1.6
7.3
Al Ahli Bank
55.00
1.85
(0.90)
6,989
13.5
2.0
5.4
Qatar International Islamic Bank
58.40
(0.34)
1.92
8,840
12.3
1.8
6.0
Masraf Al Rayan
32.00
1.11
9.03
24,000
14.4
2.4
3.1
Al Khaliji Bank
19.52
0.67
3.66
7,027
13.2
1.3
5.1
National Leasing
31.00
(0.48)
1.64
1,534
13.1
1.2
6.5
Dlala Holding
22.00
9.51
7.53
488
N/M
2.2
N/A
Qatar & Oman Investment
12.68
2.26
2.67
399
26.6
1.2
3.9
Islamic Holding Group
39.95
(3.15)
(5.22)
160
21.5
2.8
2.8
218,525
Banking and Financial Services
Zad Holding
68.80
1.18
1.03
900
9.1
0.7
5.8
Qatar German Co. for Medical Devices
14.65
(0.20)
(2.98)
169
N/M
0.9
N/A
Salam International Investment
12.11
0.17
(0.74)
1,384
10.7
0.8
5.8
Medicare Group
53.90
9.44
9.89
1,517
24.7
2.0
3.3
Qatar Cinema & Film Distribution
44.50
3.49
0.68
254
34.0
1.8
4.5
288.50
1.05
1.66
18,743
15.7
3.1
3.5
(1.75)
(1.04)
860
14.3
3.5
8.4
0.60
(0.37)
2,700
18.5
2.2
5.9
Qatar Fuel
47.75
Qatar Meat and Livestock
135.00
Al Meera Consumer Goods
26,528
Consumer Goods and Services
50.40
(0.20)
0.20
1,996
9.5
1.5
6.0
Qatar National Cement
103.00
(0.87)
0.68
5,057
11.9
2.0
5.8
Industries Qatar
166.80
(0.36)
4.58
100,914
12.4
3.1
4.6
Qatar Industrial Manufacturing
38.15
Qatar Electricity and Water
8.53
21.11
4,743
20.3
2.3
2.0
168.10
Qatari Investors Group
1.14
5.72
16,810
11.1
3.0
4.3
Mannai Corp.
87.00
(1.69)
(2.14)
3,969
8.6
1.7
5.5
Aamal
14.72
1.80
3.30
8,832
14.0
1.3
N/A
Gulf International Services
58.10
(1.86)
(0.85)
8,638
14.3
3.0
2.6
150,959
Industrials
Qatar Insurance
65.40
(0.76)
2.99
8,399
10.3
1.7
3.1
Doha Insurance
25.20
(2.70)
0.80
649
11.5
1.3
3.6
Qatar General Insurance & Reinsurance
50.90
0.39
(6.09)
2,934
3.4
0.9
1.7
Al Khaleej Takaful Insurance
38.35
(0.65)
(1.16)
655
13.6
1.1
2.2
Qatar Islamic Insurance
57.10
(1.55)
0.35
857
13.5
3.1
6.1
13,494
Insurance
United Development
23.60
0.98
7.27
7,959
9.7
0.7
4.2
Barwa Real Estate
29.60
8.03
10.45
11,518
16.9
0.9
5.1
Ezdan Real Estate
17.64
2.68
3.10
46,790
55.1
1.7
0.7
Mazaya Qatar Real Estate Development
11.60
3.20
1.93
1,160
17.5
1.1
5.2
44,172
16.8
1.8
3.6
8,927
N/M
1.5
N/A
10,032
10.3
0.8
4.3
1,891
19.0
2.4
N/A
11,234
14.7
3.2
5.0
67,427
Real Estate
137.90
Qatar Telecom
(0.14)
(0.79)
10.56
7.76
15.92
Qatar Navigation (Milaha)
87.60
0.11
1.62
Gulf Warehousing
39.75
(1.24)
(1.12)
Qatar Gas Transport (Nakilat)
Transportation
20.06
2.50
4.75
Vodafone Qatar
53,100
Telecoms
23,157
Qatar Exchange
553,188
Source: Bloomberg
Contacts
Saugata Sarkar
Ahmed M. Shehada
Keith Whitney
Sahbi Kasraoui
Head of Research
Head of Trading
Head of Sales
Manager - HNWI
Tel: (+974) 4476 6534
Tel: (+974) 4476 6535
Tel: (+974) 4476 6533
Tel: (+974) 4476 6544
saugata.sarkar@qnbfs.com.qa
ahmed.shehada@qnbfs.com.qa
keith.whitney@qnbfs.com.qa
sahbi.alkasraoui@qnbfs.com.qa
QNB Financial Services SPC
Contact Center: (+974) 4476 6666
PO Box 24025, Doha, Qatar
DISCLAIMER: This publication has been prepared by QNB Financial Services SPC (“QNBFS”) a wholly-owned subsidiary of Qatar National Bank (“QNB”). QNBFS is regulated by the Qatar
Financial Markets Authority and the Qatar Exchange; QNB is regulated by the Qatar Central Bank. This publication expresses the views and opinions of QNBFS at a given time only. It is not an
offer, promotion or recommendation to buy or sell securities or other investments, nor is it intended to constitute legal, tax, accounting, or financial advice. We therefore strongly advise potential
investors to seek independent professional advice before making any investment decision. Although the information in this report has been obtained from sources that QNBFS believes to be
reliable, we have not independently verified such information and it may not be accurate or complete. While this publication has been prepared with the utmost degree of care by our analysts,
QNBFS does not make any representations warranties as to the accuracy and completeness of the information it may contain, and declines any liability in that respect. QNBFS reserves the right
to amend the views and opinions expressed in this publication at any time. It may also express viewpoints or make investment decisions that differ significantly from, or even contradict, the views
and opinions included in this report.
COPYRIGHT: No part of this document may be reproduced without the explicit written permission of QNBFS.
Page 5 of 5