SlideShare a Scribd company logo
1 of 38
Download to read offline
What is Unified Modeling
Language (UML)?
 The UML is a graphical / standard
language for visualizing,
specifying, constructing &
documenting the artifacts of a
software system.
History of UML
 1980 – 1990  Many different
methodologies
1. Booch method by Grady Booch
2. Object Modeling Technique (OMT) by Jim Rumbaugh
3. Object Oriented Software Engineering (OOSE) by Ivar
Jacobson
 Each method had its strengths &
weaknesses.
1. Booch was great in design
2. OMT & OOSE were great in analysis
History of UML
UML 1.0 (January 1997)
UML 1.1 (November 1997)
UML 1.3 (Current Minor revision 1999)
UML 1.4 (Planned Minor revision 2000)
UML 2.0 (Planned Major revision 2004)
UML Concepts
 UML can be used to support your
entire life cycle.
1. The interaction of your application with the outside
world (use case diagram)
2. Visualize object interaction (sequence &
collaboration diagrams)
3. The structure of your system (class diagram)
4. View the system architecture by looking at the
defined package.
5. The components in your system (component
diagram)
What are Diagrams ?
 Graphical presentation of model
elements.
 A diagram is a graphical means to view
a system’s parts
UML Diagrams
 8 diagrams
 You will model the following 5 diagrams only:
1. Use case diagram
2. Activity diagram
3. Sequence diagram
4. Collaboration diagram
5. Class diagram
 The other UML diagrams that can be modeled in
Rose are:
1. State chart diagram
2. Component diagram
3. Deployment diagram
Interaction
diagram
Behavior Diagram
 Sequence diagram
 Collaboration diagram
 State chart diagram
 Activity diagram
behavior
diagram
UML Diagrams
1. Class diagram
2. Use case diagram
3. Activity diagram
4. Sequence diagram
5. Collaboration diagram
6. State chart diagram
7. Component diagram
8. Deployment diagram
1. Class diagram
 Class  a set of objects that share the
same attributes, operations & relationships.
 It represented by a compartmentalized
rectangle.
 It shows the structure of your software.
 3 compartments
1. Top
2. Middle
3. Bottom
1. Class diagram
1. Top  shows class name
2. Middle  shows class attributes
3. Bottom  shows class operation
1. Class diagram
1. Attributes  defines the characteristics or
structure of a class.
 displayed in the middle of the
compartmentalized rectangle.
Attributes
1. Class diagram
2. Operation  the service provided by the class.
 displayed in the bottom of the
compartmentalized rectangle.
Operations
2.Use case diagram
 It shows a set of use cases and actors and
their relationships.
 Address the static view of a system.
 Actor  user (or) someone / something
outside the system that interacts with the
system (it must be a noun) & it is
represented by a stickman.
……contd
2.Use case diagram
 Use case  a sequences of actions (it must be
a verb) & it is represented by an oval.
 Relationship illustrates a connection among
model elements.
Unidirectional Bi-directional
 It is created to visualize the interaction of your
system with the outside world.
 (e.g.) ATM
……contd
2. Use case diagram (ATM)
CASH
DISPENSER
PRINTER
CHANGE PIN
WITHDRAW
CHECK BALANCE
LOGIN
CUSTOMER
2. Use case diagram (Pay roll)
 Actors  employee & account
 Use case  count leave, disburse
salary, check loans, calculate PF,
prepare IT returns, calculate HRA &
check salary
Customer
Calculate PF
Check loans
Disburse salary
Count leave
Prepare IT returns
Check salary
Calculate HRA
3.Activity Diagram
 It shows the flow of events with our
system & what is going on inside a use
case.
 We draw the activity diagram for each
& every use case.
 Login (use case) – (e.g.) ATM
 It is showing flow of control from
activity to activity.
3.Activity Diagram
 Activity  it represents the performance of a
task within the workflow.
 Activity is represented by a lozenge
(horizontal top and bottom with convex sides)
 Start state shows the beginning of a workflow
on an activity diagram.
 There is only one start state.
3.Activity Diagram
 A start state is represented by a solid
circle.
 An end state represents a final or
terminal state on an activity diagram.
 A end state is represented by a bull’s
eye.
3.Activity Diagram
 A state transition shows what activity
follows after another.
 It is represented by a solid line with an
arrow.
3.Activity Diagram
 A decision is a point in an activity diagram
where guard conditions are used to indicate
different possible transitions.
 It is represented by a diamond.
 Guard conditions control the transition of a
set of alternate transitions that follows after
the activity has been completed.
3.Activity Diagram
AND
Joint
Synchronization bar
3.Activity Diagram
 A synchronization bar allows you to
show concurrent threads in a work flow
of a use case.
 It represented by a thick horizontal or
vertical line.
3.Activity Diagram – Login Use case
Customer Enters
the login details
System retrives
the details
System validates
the customer
System welcomes
the customer
System prompts to
reenter
[ True ]
[ False ]
4.Sequence Diagram
 It shows step by step what must happen
to accomplish a piece of functionality
provided by the system.
 It has 2Ds.
1. Vertical dimensions  represents time
2. Horizontal dimensions  represents
different objects.
 Vertical line is called the object’s life line.
4.Sequence Diagram
 Life line  the existence object at a
particular time.
 Objects are shown at the top.
 The object role is shown as a vertical
dashed line, the life line.
4.Sequence Diagram
 A message is the communication between 2
objects that triggers an event.
 It is represented by a labeled arrow.
 Each message is represented by an arrow
between the life lines of 2 objects.
4.Sequence Diagram
 A focus of control shows the period of
time during which an object is
performing an action, either directly or
through a subordinate procedure.
 It represented by a tall, thin rectangle.
4.Sequence Diagram – login
success
: Customer
: Customer : LoginForm
: LoginForm : LoginController
: LoginController : CustomerInfo
: CustomerInfo
Enter Login Detail...
Submit( )
Validate( )
getLoginDetails( )
5.Collaboration Diagram
 It displays objects and their links to one
other.
 It is also known as an interaction diagram.
5.Collaboration Diagram
 It is made up of the following basic
elements :
1. Actors
2. Objects
3. Links
4. Messages
5.Collaboration Diagram
1. Actors  user
2. Objects  data + logic / the representation
of some real world entity.
3. Links  a pathway for communication
between objects.
 represented by a solid line
between 2 objects
4. Messages  the communication between
objects that triggers an event.
 represented by a labeled arrow
above
the link.
5.Collaboration Diagram –
Login use case
: Customer
: LoginForm
: LoginController
: CustomerInfo
1: Enter Login Details( )
2: Submit( )
3: Validate( )
4: getLoginDetails( )
6. State Chart Diagram
 It shows the sequence of states.
 A state is represented as a rounded box,
which may contain one or more
compartments.
 Name compartment  holds the name of
the state.
 Internal transition compartment  list of
actions / activities
 Start & end states
7.Component Diagram
 It shows relationship between the
components in the system.
 A component may be a software
component [for (e.g.) a.h file in C++
(or) a .java file in Java], a run time
component [for (e.g.) a.DLL file]
8. Deployment Diagram
 It shows the configuration of run time
processing elements & the software
components, processes & objects that
live in them.
 It shows the nodes in the system & the
connections between them.
Thank You!

More Related Content

Similar to What is UML? Visual Guide to Unified Modeling Language Diagrams

Course NumberCourse SectionCourse Name.docx
Course NumberCourse SectionCourse Name.docxCourse NumberCourse SectionCourse Name.docx
Course NumberCourse SectionCourse Name.docxvanesaburnand
 
UML Design Document Training Learn UML .pptx
UML Design Document Training Learn UML .pptxUML Design Document Training Learn UML .pptx
UML Design Document Training Learn UML .pptxraghavanp4
 
CASE Tools lab.ppt
CASE Tools lab.pptCASE Tools lab.ppt
CASE Tools lab.pptRAJESH S
 
Unit three Advanced State Modelling
Unit three Advanced State ModellingUnit three Advanced State Modelling
Unit three Advanced State ModellingDr Chetan Shelke
 
Component based models and technology
Component based models and technologyComponent based models and technology
Component based models and technologySaransh Garg
 
Component based models and technology
Component based models and technologyComponent based models and technology
Component based models and technologyMayukh Maitra
 
Software engg. pressman_ch-8
Software engg. pressman_ch-8Software engg. pressman_ch-8
Software engg. pressman_ch-8Dhairya Joshi
 
Software Engineering Tools and Practices.pdf
Software Engineering Tools and Practices.pdfSoftware Engineering Tools and Practices.pdf
Software Engineering Tools and Practices.pdfMeagGhn
 
Basic behavioral modeling chapter 3 of OMD
Basic behavioral modeling chapter 3 of OMDBasic behavioral modeling chapter 3 of OMD
Basic behavioral modeling chapter 3 of OMDjayashri kolekar
 

Similar to What is UML? Visual Guide to Unified Modeling Language Diagrams (20)

Course NumberCourse SectionCourse Name.docx
Course NumberCourse SectionCourse Name.docxCourse NumberCourse SectionCourse Name.docx
Course NumberCourse SectionCourse Name.docx
 
Use case model
Use case modelUse case model
Use case model
 
UML Design Document Training Learn UML .pptx
UML Design Document Training Learn UML .pptxUML Design Document Training Learn UML .pptx
UML Design Document Training Learn UML .pptx
 
4. UML
4. UML4. UML
4. UML
 
Sequence Diagram
Sequence DiagramSequence Diagram
Sequence Diagram
 
CASE Tools lab.ppt
CASE Tools lab.pptCASE Tools lab.ppt
CASE Tools lab.ppt
 
Unit three Advanced State Modelling
Unit three Advanced State ModellingUnit three Advanced State Modelling
Unit three Advanced State Modelling
 
Component based models and technology
Component based models and technologyComponent based models and technology
Component based models and technology
 
Jar chapter 4, part 1
Jar chapter 4, part 1Jar chapter 4, part 1
Jar chapter 4, part 1
 
Uml Diagrams
Uml DiagramsUml Diagrams
Uml Diagrams
 
UML Unit 01
UML Unit 01UML Unit 01
UML Unit 01
 
Component based models and technology
Component based models and technologyComponent based models and technology
Component based models and technology
 
Intoduction to uml
Intoduction to umlIntoduction to uml
Intoduction to uml
 
Chapter7
Chapter7Chapter7
Chapter7
 
Software engg. pressman_ch-8
Software engg. pressman_ch-8Software engg. pressman_ch-8
Software engg. pressman_ch-8
 
Uml and enterprise architect
Uml and enterprise architectUml and enterprise architect
Uml and enterprise architect
 
Uml
UmlUml
Uml
 
Software Engineering Tools and Practices.pdf
Software Engineering Tools and Practices.pdfSoftware Engineering Tools and Practices.pdf
Software Engineering Tools and Practices.pdf
 
0136061257
01360612570136061257
0136061257
 
Basic behavioral modeling chapter 3 of OMD
Basic behavioral modeling chapter 3 of OMDBasic behavioral modeling chapter 3 of OMD
Basic behavioral modeling chapter 3 of OMD
 

More from RAJESH S

Entreprise Resource Planning s unit 2.ppt
Entreprise Resource Planning s unit 2.pptEntreprise Resource Planning s unit 2.ppt
Entreprise Resource Planning s unit 2.pptRAJESH S
 
Decision support systems in information management
Decision support systems in information managementDecision support systems in information management
Decision support systems in information managementRAJESH S
 
IM Unit 4 Security and its a control.ppt
IM Unit 4 Security and its a control.pptIM Unit 4 Security and its a control.ppt
IM Unit 4 Security and its a control.pptRAJESH S
 
unit5 Enterprise Resource Planning new trends.ppt
unit5 Enterprise Resource Planning new trends.pptunit5 Enterprise Resource Planning new trends.ppt
unit5 Enterprise Resource Planning new trends.pptRAJESH S
 
science engineering and technology .pptx
science engineering and technology .pptxscience engineering and technology .pptx
science engineering and technology .pptxRAJESH S
 
policies in economics trends for engineers
policies in economics trends for engineerspolicies in economics trends for engineers
policies in economics trends for engineersRAJESH S
 
Product Decisions and its aplication in global world
Product Decisions and its aplication in global worldProduct Decisions and its aplication in global world
Product Decisions and its aplication in global worldRAJESH S
 
Database management system basics and it applications
Database management system basics and it applicationsDatabase management system basics and it applications
Database management system basics and it applicationsRAJESH S
 
Computer Animation.pptx
Computer Animation.pptxComputer Animation.pptx
Computer Animation.pptxRAJESH S
 
IOT in agriculture.pptx
IOT in agriculture.pptxIOT in agriculture.pptx
IOT in agriculture.pptxRAJESH S
 
18copy.pptx
18copy.pptx18copy.pptx
18copy.pptxRAJESH S
 
ERP unit 1.ppt
ERP unit 1.pptERP unit 1.ppt
ERP unit 1.pptRAJESH S
 
fiscalpolicy.ppt
fiscalpolicy.pptfiscalpolicy.ppt
fiscalpolicy.pptRAJESH S
 
DAA ppt.pptx
DAA ppt.pptxDAA ppt.pptx
DAA ppt.pptxRAJESH S
 
DAA 1 ppt.pptx
DAA 1 ppt.pptxDAA 1 ppt.pptx
DAA 1 ppt.pptxRAJESH S
 
ARITHMETIC LOGIC UNIT.ppt
ARITHMETIC LOGIC UNIT.pptARITHMETIC LOGIC UNIT.ppt
ARITHMETIC LOGIC UNIT.pptRAJESH S
 
Virtual memory translation.pptx
Virtual memory translation.pptxVirtual memory translation.pptx
Virtual memory translation.pptxRAJESH S
 
Common memory technologies.pptx
Common memory technologies.pptxCommon memory technologies.pptx
Common memory technologies.pptxRAJESH S
 
Components of Computer system.ppt
Components of Computer system.pptComponents of Computer system.ppt
Components of Computer system.pptRAJESH S
 
CA UNIT I PPT.ppt
CA UNIT I PPT.pptCA UNIT I PPT.ppt
CA UNIT I PPT.pptRAJESH S
 

More from RAJESH S (20)

Entreprise Resource Planning s unit 2.ppt
Entreprise Resource Planning s unit 2.pptEntreprise Resource Planning s unit 2.ppt
Entreprise Resource Planning s unit 2.ppt
 
Decision support systems in information management
Decision support systems in information managementDecision support systems in information management
Decision support systems in information management
 
IM Unit 4 Security and its a control.ppt
IM Unit 4 Security and its a control.pptIM Unit 4 Security and its a control.ppt
IM Unit 4 Security and its a control.ppt
 
unit5 Enterprise Resource Planning new trends.ppt
unit5 Enterprise Resource Planning new trends.pptunit5 Enterprise Resource Planning new trends.ppt
unit5 Enterprise Resource Planning new trends.ppt
 
science engineering and technology .pptx
science engineering and technology .pptxscience engineering and technology .pptx
science engineering and technology .pptx
 
policies in economics trends for engineers
policies in economics trends for engineerspolicies in economics trends for engineers
policies in economics trends for engineers
 
Product Decisions and its aplication in global world
Product Decisions and its aplication in global worldProduct Decisions and its aplication in global world
Product Decisions and its aplication in global world
 
Database management system basics and it applications
Database management system basics and it applicationsDatabase management system basics and it applications
Database management system basics and it applications
 
Computer Animation.pptx
Computer Animation.pptxComputer Animation.pptx
Computer Animation.pptx
 
IOT in agriculture.pptx
IOT in agriculture.pptxIOT in agriculture.pptx
IOT in agriculture.pptx
 
18copy.pptx
18copy.pptx18copy.pptx
18copy.pptx
 
ERP unit 1.ppt
ERP unit 1.pptERP unit 1.ppt
ERP unit 1.ppt
 
fiscalpolicy.ppt
fiscalpolicy.pptfiscalpolicy.ppt
fiscalpolicy.ppt
 
DAA ppt.pptx
DAA ppt.pptxDAA ppt.pptx
DAA ppt.pptx
 
DAA 1 ppt.pptx
DAA 1 ppt.pptxDAA 1 ppt.pptx
DAA 1 ppt.pptx
 
ARITHMETIC LOGIC UNIT.ppt
ARITHMETIC LOGIC UNIT.pptARITHMETIC LOGIC UNIT.ppt
ARITHMETIC LOGIC UNIT.ppt
 
Virtual memory translation.pptx
Virtual memory translation.pptxVirtual memory translation.pptx
Virtual memory translation.pptx
 
Common memory technologies.pptx
Common memory technologies.pptxCommon memory technologies.pptx
Common memory technologies.pptx
 
Components of Computer system.ppt
Components of Computer system.pptComponents of Computer system.ppt
Components of Computer system.ppt
 
CA UNIT I PPT.ppt
CA UNIT I PPT.pptCA UNIT I PPT.ppt
CA UNIT I PPT.ppt
 

Recently uploaded

Bank Loan Approval Analysis: A Comprehensive Data Analysis Project
Bank Loan Approval Analysis: A Comprehensive Data Analysis ProjectBank Loan Approval Analysis: A Comprehensive Data Analysis Project
Bank Loan Approval Analysis: A Comprehensive Data Analysis ProjectBoston Institute of Analytics
 
Decoding Patterns: Customer Churn Prediction Data Analysis Project
Decoding Patterns: Customer Churn Prediction Data Analysis ProjectDecoding Patterns: Customer Churn Prediction Data Analysis Project
Decoding Patterns: Customer Churn Prediction Data Analysis ProjectBoston Institute of Analytics
 
Decoding the Heart: Student Presentation on Heart Attack Prediction with Data...
Decoding the Heart: Student Presentation on Heart Attack Prediction with Data...Decoding the Heart: Student Presentation on Heart Attack Prediction with Data...
Decoding the Heart: Student Presentation on Heart Attack Prediction with Data...Boston Institute of Analytics
 
why-transparency-and-traceability-are-essential-for-sustainable-supply-chains...
why-transparency-and-traceability-are-essential-for-sustainable-supply-chains...why-transparency-and-traceability-are-essential-for-sustainable-supply-chains...
why-transparency-and-traceability-are-essential-for-sustainable-supply-chains...Jack Cole
 
modul pembelajaran robotic Workshop _ by Slidesgo.pptx
modul pembelajaran robotic Workshop _ by Slidesgo.pptxmodul pembelajaran robotic Workshop _ by Slidesgo.pptx
modul pembelajaran robotic Workshop _ by Slidesgo.pptxaleedritatuxx
 
Rithik Kumar Singh codealpha pythohn.pdf
Rithik Kumar Singh codealpha pythohn.pdfRithik Kumar Singh codealpha pythohn.pdf
Rithik Kumar Singh codealpha pythohn.pdfrahulyadav957181
 
English-8-Q4-W3-Synthesizing-Essential-Information-From-Various-Sources-1.pdf
English-8-Q4-W3-Synthesizing-Essential-Information-From-Various-Sources-1.pdfEnglish-8-Q4-W3-Synthesizing-Essential-Information-From-Various-Sources-1.pdf
English-8-Q4-W3-Synthesizing-Essential-Information-From-Various-Sources-1.pdfblazblazml
 
6 Tips for Interpretable Topic Models _ by Nicha Ruchirawat _ Towards Data Sc...
6 Tips for Interpretable Topic Models _ by Nicha Ruchirawat _ Towards Data Sc...6 Tips for Interpretable Topic Models _ by Nicha Ruchirawat _ Towards Data Sc...
6 Tips for Interpretable Topic Models _ by Nicha Ruchirawat _ Towards Data Sc...Dr Arash Najmaei ( Phd., MBA, BSc)
 
DATA ANALYSIS using various data sets like shoping data set etc
DATA ANALYSIS using various data sets like shoping data set etcDATA ANALYSIS using various data sets like shoping data set etc
DATA ANALYSIS using various data sets like shoping data set etclalithasri22
 
Principles and Practices of Data Visualization
Principles and Practices of Data VisualizationPrinciples and Practices of Data Visualization
Principles and Practices of Data VisualizationKianJazayeri1
 
Introduction to Mongo DB-open-­‐source, high-­‐performance, document-­‐orient...
Introduction to Mongo DB-open-­‐source, high-­‐performance, document-­‐orient...Introduction to Mongo DB-open-­‐source, high-­‐performance, document-­‐orient...
Introduction to Mongo DB-open-­‐source, high-­‐performance, document-­‐orient...boychatmate1
 
Data Analysis Project Presentation: Unveiling Your Ideal Customer, Bank Custo...
Data Analysis Project Presentation: Unveiling Your Ideal Customer, Bank Custo...Data Analysis Project Presentation: Unveiling Your Ideal Customer, Bank Custo...
Data Analysis Project Presentation: Unveiling Your Ideal Customer, Bank Custo...Boston Institute of Analytics
 
Role of Consumer Insights in business transformation
Role of Consumer Insights in business transformationRole of Consumer Insights in business transformation
Role of Consumer Insights in business transformationAnnie Melnic
 
Digital Marketing Plan, how digital marketing works
Digital Marketing Plan, how digital marketing worksDigital Marketing Plan, how digital marketing works
Digital Marketing Plan, how digital marketing worksdeepakthakur548787
 
Data Analysis Project : Targeting the Right Customers, Presentation on Bank M...
Data Analysis Project : Targeting the Right Customers, Presentation on Bank M...Data Analysis Project : Targeting the Right Customers, Presentation on Bank M...
Data Analysis Project : Targeting the Right Customers, Presentation on Bank M...Boston Institute of Analytics
 
Statistics For Management by Richard I. Levin 8ed.pdf
Statistics For Management by Richard I. Levin 8ed.pdfStatistics For Management by Richard I. Levin 8ed.pdf
Statistics For Management by Richard I. Levin 8ed.pdfnikeshsingh56
 
knowledge representation in artificial intelligence
knowledge representation in artificial intelligenceknowledge representation in artificial intelligence
knowledge representation in artificial intelligencePriyadharshiniG41
 
IBEF report on the Insurance market in India
IBEF report on the Insurance market in IndiaIBEF report on the Insurance market in India
IBEF report on the Insurance market in IndiaManalVerma4
 

Recently uploaded (20)

Bank Loan Approval Analysis: A Comprehensive Data Analysis Project
Bank Loan Approval Analysis: A Comprehensive Data Analysis ProjectBank Loan Approval Analysis: A Comprehensive Data Analysis Project
Bank Loan Approval Analysis: A Comprehensive Data Analysis Project
 
Decoding Patterns: Customer Churn Prediction Data Analysis Project
Decoding Patterns: Customer Churn Prediction Data Analysis ProjectDecoding Patterns: Customer Churn Prediction Data Analysis Project
Decoding Patterns: Customer Churn Prediction Data Analysis Project
 
Decoding the Heart: Student Presentation on Heart Attack Prediction with Data...
Decoding the Heart: Student Presentation on Heart Attack Prediction with Data...Decoding the Heart: Student Presentation on Heart Attack Prediction with Data...
Decoding the Heart: Student Presentation on Heart Attack Prediction with Data...
 
why-transparency-and-traceability-are-essential-for-sustainable-supply-chains...
why-transparency-and-traceability-are-essential-for-sustainable-supply-chains...why-transparency-and-traceability-are-essential-for-sustainable-supply-chains...
why-transparency-and-traceability-are-essential-for-sustainable-supply-chains...
 
Insurance Churn Prediction Data Analysis Project
Insurance Churn Prediction Data Analysis ProjectInsurance Churn Prediction Data Analysis Project
Insurance Churn Prediction Data Analysis Project
 
modul pembelajaran robotic Workshop _ by Slidesgo.pptx
modul pembelajaran robotic Workshop _ by Slidesgo.pptxmodul pembelajaran robotic Workshop _ by Slidesgo.pptx
modul pembelajaran robotic Workshop _ by Slidesgo.pptx
 
Rithik Kumar Singh codealpha pythohn.pdf
Rithik Kumar Singh codealpha pythohn.pdfRithik Kumar Singh codealpha pythohn.pdf
Rithik Kumar Singh codealpha pythohn.pdf
 
English-8-Q4-W3-Synthesizing-Essential-Information-From-Various-Sources-1.pdf
English-8-Q4-W3-Synthesizing-Essential-Information-From-Various-Sources-1.pdfEnglish-8-Q4-W3-Synthesizing-Essential-Information-From-Various-Sources-1.pdf
English-8-Q4-W3-Synthesizing-Essential-Information-From-Various-Sources-1.pdf
 
6 Tips for Interpretable Topic Models _ by Nicha Ruchirawat _ Towards Data Sc...
6 Tips for Interpretable Topic Models _ by Nicha Ruchirawat _ Towards Data Sc...6 Tips for Interpretable Topic Models _ by Nicha Ruchirawat _ Towards Data Sc...
6 Tips for Interpretable Topic Models _ by Nicha Ruchirawat _ Towards Data Sc...
 
DATA ANALYSIS using various data sets like shoping data set etc
DATA ANALYSIS using various data sets like shoping data set etcDATA ANALYSIS using various data sets like shoping data set etc
DATA ANALYSIS using various data sets like shoping data set etc
 
Principles and Practices of Data Visualization
Principles and Practices of Data VisualizationPrinciples and Practices of Data Visualization
Principles and Practices of Data Visualization
 
Introduction to Mongo DB-open-­‐source, high-­‐performance, document-­‐orient...
Introduction to Mongo DB-open-­‐source, high-­‐performance, document-­‐orient...Introduction to Mongo DB-open-­‐source, high-­‐performance, document-­‐orient...
Introduction to Mongo DB-open-­‐source, high-­‐performance, document-­‐orient...
 
Data Analysis Project Presentation: Unveiling Your Ideal Customer, Bank Custo...
Data Analysis Project Presentation: Unveiling Your Ideal Customer, Bank Custo...Data Analysis Project Presentation: Unveiling Your Ideal Customer, Bank Custo...
Data Analysis Project Presentation: Unveiling Your Ideal Customer, Bank Custo...
 
Role of Consumer Insights in business transformation
Role of Consumer Insights in business transformationRole of Consumer Insights in business transformation
Role of Consumer Insights in business transformation
 
2023 Survey Shows Dip in High School E-Cigarette Use
2023 Survey Shows Dip in High School E-Cigarette Use2023 Survey Shows Dip in High School E-Cigarette Use
2023 Survey Shows Dip in High School E-Cigarette Use
 
Digital Marketing Plan, how digital marketing works
Digital Marketing Plan, how digital marketing worksDigital Marketing Plan, how digital marketing works
Digital Marketing Plan, how digital marketing works
 
Data Analysis Project : Targeting the Right Customers, Presentation on Bank M...
Data Analysis Project : Targeting the Right Customers, Presentation on Bank M...Data Analysis Project : Targeting the Right Customers, Presentation on Bank M...
Data Analysis Project : Targeting the Right Customers, Presentation on Bank M...
 
Statistics For Management by Richard I. Levin 8ed.pdf
Statistics For Management by Richard I. Levin 8ed.pdfStatistics For Management by Richard I. Levin 8ed.pdf
Statistics For Management by Richard I. Levin 8ed.pdf
 
knowledge representation in artificial intelligence
knowledge representation in artificial intelligenceknowledge representation in artificial intelligence
knowledge representation in artificial intelligence
 
IBEF report on the Insurance market in India
IBEF report on the Insurance market in IndiaIBEF report on the Insurance market in India
IBEF report on the Insurance market in India
 

What is UML? Visual Guide to Unified Modeling Language Diagrams

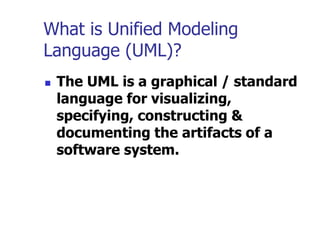
  • 1. What is Unified Modeling Language (UML)?  The UML is a graphical / standard language for visualizing, specifying, constructing & documenting the artifacts of a software system.
  • 2. History of UML  1980 – 1990  Many different methodologies 1. Booch method by Grady Booch 2. Object Modeling Technique (OMT) by Jim Rumbaugh 3. Object Oriented Software Engineering (OOSE) by Ivar Jacobson  Each method had its strengths & weaknesses. 1. Booch was great in design 2. OMT & OOSE were great in analysis
  • 3. History of UML UML 1.0 (January 1997) UML 1.1 (November 1997) UML 1.3 (Current Minor revision 1999) UML 1.4 (Planned Minor revision 2000) UML 2.0 (Planned Major revision 2004)
  • 4. UML Concepts  UML can be used to support your entire life cycle. 1. The interaction of your application with the outside world (use case diagram) 2. Visualize object interaction (sequence & collaboration diagrams) 3. The structure of your system (class diagram) 4. View the system architecture by looking at the defined package. 5. The components in your system (component diagram)
  • 5. What are Diagrams ?  Graphical presentation of model elements.  A diagram is a graphical means to view a system’s parts
  • 6. UML Diagrams  8 diagrams  You will model the following 5 diagrams only: 1. Use case diagram 2. Activity diagram 3. Sequence diagram 4. Collaboration diagram 5. Class diagram  The other UML diagrams that can be modeled in Rose are: 1. State chart diagram 2. Component diagram 3. Deployment diagram Interaction diagram
  • 7. Behavior Diagram  Sequence diagram  Collaboration diagram  State chart diagram  Activity diagram behavior diagram
  • 8. UML Diagrams 1. Class diagram 2. Use case diagram 3. Activity diagram 4. Sequence diagram 5. Collaboration diagram 6. State chart diagram 7. Component diagram 8. Deployment diagram
  • 9. 1. Class diagram  Class  a set of objects that share the same attributes, operations & relationships.  It represented by a compartmentalized rectangle.  It shows the structure of your software.  3 compartments 1. Top 2. Middle 3. Bottom
  • 10. 1. Class diagram 1. Top  shows class name 2. Middle  shows class attributes 3. Bottom  shows class operation
  • 11. 1. Class diagram 1. Attributes  defines the characteristics or structure of a class.  displayed in the middle of the compartmentalized rectangle. Attributes
  • 12. 1. Class diagram 2. Operation  the service provided by the class.  displayed in the bottom of the compartmentalized rectangle. Operations
  • 13. 2.Use case diagram  It shows a set of use cases and actors and their relationships.  Address the static view of a system.  Actor  user (or) someone / something outside the system that interacts with the system (it must be a noun) & it is represented by a stickman. ……contd
  • 14. 2.Use case diagram  Use case  a sequences of actions (it must be a verb) & it is represented by an oval.  Relationship illustrates a connection among model elements. Unidirectional Bi-directional  It is created to visualize the interaction of your system with the outside world.  (e.g.) ATM ……contd
  • 15. 2. Use case diagram (ATM) CASH DISPENSER PRINTER CHANGE PIN WITHDRAW CHECK BALANCE LOGIN CUSTOMER
  • 16. 2. Use case diagram (Pay roll)  Actors  employee & account  Use case  count leave, disburse salary, check loans, calculate PF, prepare IT returns, calculate HRA & check salary
  • 17. Customer Calculate PF Check loans Disburse salary Count leave Prepare IT returns Check salary Calculate HRA
  • 18. 3.Activity Diagram  It shows the flow of events with our system & what is going on inside a use case.  We draw the activity diagram for each & every use case.  Login (use case) – (e.g.) ATM  It is showing flow of control from activity to activity.
  • 19. 3.Activity Diagram  Activity  it represents the performance of a task within the workflow.  Activity is represented by a lozenge (horizontal top and bottom with convex sides)  Start state shows the beginning of a workflow on an activity diagram.  There is only one start state.
  • 20. 3.Activity Diagram  A start state is represented by a solid circle.  An end state represents a final or terminal state on an activity diagram.  A end state is represented by a bull’s eye.
  • 21. 3.Activity Diagram  A state transition shows what activity follows after another.  It is represented by a solid line with an arrow.
  • 22. 3.Activity Diagram  A decision is a point in an activity diagram where guard conditions are used to indicate different possible transitions.  It is represented by a diamond.  Guard conditions control the transition of a set of alternate transitions that follows after the activity has been completed.
  • 24. 3.Activity Diagram  A synchronization bar allows you to show concurrent threads in a work flow of a use case.  It represented by a thick horizontal or vertical line.
  • 25. 3.Activity Diagram – Login Use case Customer Enters the login details System retrives the details System validates the customer System welcomes the customer System prompts to reenter [ True ] [ False ]
  • 26. 4.Sequence Diagram  It shows step by step what must happen to accomplish a piece of functionality provided by the system.  It has 2Ds. 1. Vertical dimensions  represents time 2. Horizontal dimensions  represents different objects.  Vertical line is called the object’s life line.
  • 27. 4.Sequence Diagram  Life line  the existence object at a particular time.  Objects are shown at the top.  The object role is shown as a vertical dashed line, the life line.
  • 28. 4.Sequence Diagram  A message is the communication between 2 objects that triggers an event.  It is represented by a labeled arrow.  Each message is represented by an arrow between the life lines of 2 objects.
  • 29. 4.Sequence Diagram  A focus of control shows the period of time during which an object is performing an action, either directly or through a subordinate procedure.  It represented by a tall, thin rectangle.
  • 30. 4.Sequence Diagram – login success : Customer : Customer : LoginForm : LoginForm : LoginController : LoginController : CustomerInfo : CustomerInfo Enter Login Detail... Submit( ) Validate( ) getLoginDetails( )
  • 31. 5.Collaboration Diagram  It displays objects and their links to one other.  It is also known as an interaction diagram.
  • 32. 5.Collaboration Diagram  It is made up of the following basic elements : 1. Actors 2. Objects 3. Links 4. Messages
  • 33. 5.Collaboration Diagram 1. Actors  user 2. Objects  data + logic / the representation of some real world entity. 3. Links  a pathway for communication between objects.  represented by a solid line between 2 objects 4. Messages  the communication between objects that triggers an event.  represented by a labeled arrow above the link.
  • 34. 5.Collaboration Diagram – Login use case : Customer : LoginForm : LoginController : CustomerInfo 1: Enter Login Details( ) 2: Submit( ) 3: Validate( ) 4: getLoginDetails( )
  • 35. 6. State Chart Diagram  It shows the sequence of states.  A state is represented as a rounded box, which may contain one or more compartments.  Name compartment  holds the name of the state.  Internal transition compartment  list of actions / activities  Start & end states
  • 36. 7.Component Diagram  It shows relationship between the components in the system.  A component may be a software component [for (e.g.) a.h file in C++ (or) a .java file in Java], a run time component [for (e.g.) a.DLL file]
  • 37. 8. Deployment Diagram  It shows the configuration of run time processing elements & the software components, processes & objects that live in them.  It shows the nodes in the system & the connections between them.