SlideShare a Scribd company logo
1 of 14
content courtesy of www.frondebaliste.org
                                                                                                        data census.gov


       Inequality is Increasing: Do We Know Why?
                           .48


                           .46


                          0.44


                           0.42


                            0.4


                           0.38


                           0.36


                            0.34
                                   2008
                                          2006
                                                 2004
                                                        2002
                                                               2000
                                                                      1998
                                                                             1996
                                                                                    1994


                                                                                                                                                                                                                      Nixon
                                                                                           1992
                                                                                                  1990


                                                                                                                                                                                                             Carter
                                                                                                         1988

                                                                                                                1986


                                                                                                                                                                                                   R eagan
                                                                                                                       1984

                                                                                                                              1982

                                                                                                                                     1980


                                                                                                                                                                                           B ush
                                                                                                                                            1978

                                                                                                                                                   1976


                                                                                                                                                                                 Clinton
                                                                                                                                                          1974

                                                                                                                                                                 1972


                                                                                                                                                                        Bush W
                                                                                                                                                                         1970
            A Need for New Measures of Economy?
               The watermark is an illustration of Gini (fed inequality measure) trend by presidential term


Copyright © .r. jenkins 2009 - 2010 , fronde baliste, all rights reserved, please site source when reproducing any portion of this slide
content courtesy of www.frondebaliste.org
                                                                                                                              data from national exit polls


                                                                                    Definitions and Questions:

                    •           Is income properly defined?

                    •           How do wages and income differ?

                    •           Does growth always produce inequality?
                                                                                                                                     Comparison of Wage vs. Top & Mid Income pre-post 1980
                        Comparison of Income Growth: before and after 1980


                                                                                                                                                                                                                                          .48


                                                                                                                                                                                                                                          .46


                                                                                                                                                                                                                                          0.44


                                                                                                                                                                                                                                          0.42


                                                                                                                                                                                                                                           0.4

                                                                                                   Growth Ratio
                                                                                                  Top vs. Lowest                                                                                                                          0.38
                                                                                                      400%
                                                                                                                                                                                                                                           0.36
                                                                                                                                        Top & W age
                                                                                                                                       Growth Ex ceed
                                                                                                                                        Mid Income                                                                                         0.34


                                                                                                                                                                                                                                                  2008
                                                                                                                                                                                                                                                         2006
                                                                                                                                                                                                                                                                2004
                                                                                                                                                                                                                                                                       2002
                                                                                                                                                                                                                                                                              2000
                                                                                                                                                                                                                                                                                     1998
                                                                                                                                                                                                                                                                                            1996
                                                                                                                                                                                                                                                                                                   1994


                                                                                                                                                                                                                                                                                                                                                                                                                                    Nixon
                                                                                                                                                                                                                                                                                                          1992
                                                                                                                                                                                                                                                                                                                 1990


                                                                                                                                                                                                                                                                                                                                                                                                                           Carter
                                                                                                                                                                                                                                                                                                                        1988

                                                                                                                                                                                                                                                                                                                               1986
                                                                                                                              1980

                                                                                                                                        1982

                                                                                                                                               1984

                                                                                                                                                      1986

                                                                                                                                                             1988

                                                                                                                                                                    1990

                                                                                                                                                                           1992

                                                                                                                                                                                  1994

                                                                                                                                                                                         1996

                                                                                                                                                                                                1998

                                                                                                                                                                                                       2000

                                                                                                                                                                                                              2002

                                                                                                                                                                                                                     2004

                                                                                                                                                                                                                            2006

                                                                                                                                                                                                                                   2008


                                                                                                                                                                                                                                                                                                                                                                                                                 R eagan
                         1984

                                  1986

                                         1988

                                                1990

                                                        1992

                                                               1994

                                                                      1996

                                                                             1998

                                                                                    2000

                                                                                           2002

                                                                                                  2004

                                                                                                         2006

                                                                                                                2008


                                                                                                                                                                                                                                                                                                                                      1984

                                                                                                                                                                                                                                                                                                                                             1982

                                                                                                                                                                                                                                                                                                                                                    1980


                                                                                                                                                                                                                                                                                                                                                                                                          Bush
                                                                                                                                                                                                                                                                                                                                                           1978

                                                                                                                                                                                                                                                                                                                                                                  1976


                                                                                                                                                                                                                                                                                                                                                                                                Clinton
                                                                                                                                                                                                                                                                                                                                                                         1974

                                                                                                                                                                                                                                                                                                                                                                                1972


                                                                                                                                                                                                                                                                                                                                                                                       Bush W
                                                                                                                                                                                                                                                                                                                                                                                        1970
                                Middle 20%             Top 20%


Copyright © rhesa jenkins 2009 - 2010 , fronde baliste, all rights reserved, please site source when reproducing any portion of this slide
Why is inequality increasing?
             • The presentation paints a picture of continuing increase in inequality
             • As a starting point, inequality is defined in terms of disparity in income growth
             • Trend charts are presented comparing Income vs. Wage growth. This is first in a series of
               comparisons examining origins of increase in inequality.
             • The purpose of the presentation is to highlight metrics that reveal root cause relationships,
               the understanding of which can guide development of solutions.

                                           Inequalities - C           Comparison of Income Growth: before and after 1980
                                                                                                                                                                      Increasing Inequality?
$200,000                                                                                                                                                              Split screen of:
$180,000                                                                                                                                                              • Pre circa 1980 income
$160,000                                                                                                                                                                stratification
$140,000                                                                                                                                                              • Post circa 1980 income
$120,000                                                                                                                                                                stratification.
$100,000
                                                                                                                                                  Growth Ratio
                                                                                                                                                                      • Income stratification
                                                 Growth Ratio
  $80,000                                       Top vs. Lowest                                                                                   Top vs. Lowest
                                                                                                                                                     400%
                                                                                                                                                                        itself has many causes.
                                                    EVEN
  $60,000                                                                                                                                                               The focus of the
  $40,000
                                                                                                                                                                        presentation is on
  $20,000
                                                                                                                                                                        increasing inequality,
                                                                                                                                                                        not simply stratification
       $0
                                                                       1984

                                                                                1986

                                                                                       1988

                                                                                              1990

                                                                                                       1992

                                                                                                              1994

                                                                                                                     1996

                                                                                                                            1998

                                                                                                                                   2000

                                                                                                                                          2002

                                                                                                                                                 2004

                                                                                                                                                        2006

                                                                                                                                                               2008
             1968

                    1970

                           1972

                                  1974

                                         1976

                                                1978

                                                        1980

                                                               1982


                                                       Lowest 20%             Middle 20%             Top 20%


            Copyright © .r. jenkins 2009 - 2010 , fronde baliste, all rights reserved, please site source when reproducing any portion of this slide
Charts based on Census Data – Income Surveys

                                                                             Inequalities - Income Growth: before 1980            • Income growth reported in
$200,000
                                                                                                                                    census data is based on
$180,000                                                                                                                            annual reports by household
$160,000
                                                                                                                                  • Data is reported by quintile (5
$140,000
                                                                                                                                    earnings groups from highest
$120,000
                                                                                                                                    to lowest 20%)
$100,000

 $80,000                                                                                                                          • Before 1980 growth in
  $60,000
                                                                                                                                    income for low and middle
                                                                                                                  Growth Ratio
                                                                                                                 Top vs. Lowest     20% households was above or
  $40,000                                                                                                            EVEN
                                                                                                                                    equal to growth for high
  $20,000
                                                                                                                                    income households
       $0
            1967


                                                                                                                                  • Mid 20% growth rate per
                   1968

                          1969

                                  1970

                                         1971


                                                                                                                                    annum: 1.9%
                                                1972

                                                        1973

                                                               1974


                                                                                                                                  • Top 20% growth rate per
                                                                      1975


                                                                             1976


                                                                                    1977


                                                                                            1978


                                                                                                                                    annum: 1.4%
                                                                                                   1979


                                                                                                          1980


                                                                                                                 1981
                                                       Lowest 20%        Middle 20%        Top 20%


                     Income Growth Trends
                     •           Chart illustrates income growth from 1967 to 1981 for low – middle (16%), and top
                                 income (14%) groups. Growth rates are virtually even.
                     •           If this trend continued, inequality would have decreased over time.


                   Copyright © .r. jenkins 2009 - 2010 , fronde baliste, all rights reserved, please site source when reproducing any portion of this slide
Charts based on Census Data – Income Surveys

$200,000
                                                                                                                             Inequalities - Income Growth: after 1980                                        • After 1980, income growth for
                                                                                                                                                                                                               low income and middle income
$180,000
                                                                                                                                                                                                               groups stalls and flattens at a
$160,000
                                                                                                                                                                                                               rate less than pre-1980
$140,000                                                                                                                                                                                                       growth rates.
$120,000

$100,000
                                                                                                                                                                                                             • After 1980 growth for the top
                                                                                                                                                                                            Growth Ratio       income group is steep and
  $80,000                                                                                                                                                                                   Top vs. Lowest
                                                                                                                                                                                                400%           sustained (Reagan Tax
  $60,000
                                                                                                                                                                                                               Reforms?)
  $40,000

  $20,000                                                                                                                                                                                                    • Mid 20% annual growth rate:
       $0                                                                                                                                                                                                      .03%
                                                                                                                                                                                                             • Top 20% annual growth rate:
            1982
                   1983
                           1984
                                  1985
                                         1986
                                                1987


                                                                                                                                                                                                               1.3%
                                                       1988
                                                              1989
                                                                     1990
                                                                            1991
                                                                                   1992
                                                                                          1993

                                                                                                 1994
                                                                                                        1995

                                                                                                               1996

                                                                                                                      1997

                                                                                                                             1998

                                                                                                                                    1999

                                                                                                                                           2000

                                                                                                                                                  2001

                                                                                                                                                         2002

                                                                                                                                                                2003

                                                                                                                                                                       2004

                                                                                                                                                                              2005
                                            Lowest 20%                        Middle 20%                       Top 20%


                                                                                                                                                                                     2006

                                                                                                                                                                                            2007

                                                                                                                                                                                                   2008
                            Origins of Wealth Gap?
                            •               Chart illustrates income growth from 1982 to 2008 for low – middle (13 %) and top (46 %)
                                            income groups
                            •               Disparity in growth in income for low- mid vs. top income groups grew to nearly 400%
                            •               Summary: 1967 to 2008 income growth for the top group was sustained. Income growth
                                            for the mid group decreased from1.9% per year pre 1980, to essentially non-existent
                                            post 1980
                          Copyright © .r. jenkins 2009 - 2010 , fronde baliste, all rights reserved, please site source when reproducing any portion of this slide
Charts based on Census Data – Income Surveys

$30,000
                                                                                   Inequalities - Equalizing Income Growth   • The chart shows impact if
$25,000                                                                                                                        income growth rates are
                                                                                                                               equalized after 1980. Top
$20,000                                                                                                                        tier: low tier multiplier measure
                                                                                                                               of inequality is cut in half.
$15,000

                                                                                                                             • Impact of equalizing growth
 $10,000
                                                                                                       Equalizing Growth       rates on multiplier as a measure
                                                                                                        Rates: Low Tier
  $5,000                                                                                                Income Doubles         of inequality:
                                                                                                                                   • Current Multiplier 15x
      $0
                                                                                                                                   • Adjusted Multiplier 8x
           1980

                   1982

                          1984

                                 1986

                                        1988

                                               1990

                                                      1992


                                                             1994


                                                                    1996


                                                                           1998


                                                                                  2000


                                                                                         2002


      Actual Low Tier Trend             Adjusted Low Tier Trend                                 2004


                                                                                                         2006


                                                                                                                  2008
                   Equalizing Income Growth Trends
                   •       Chart illustrates the impact if low tier income growth rates, from 1981 to 2008, are
                           adjusted to equal growth rates of the top tier income over the same period.
                   •       If mid – low income growth matched top group growth after 1980, current day mid-
                           low income would be 82% higher than reported 2008 levels
                   •       Reported low income $11K/yr : Adjusted to top tier growth: $21K/yr

                  Copyright © .r. jenkins 2009 - 2010 , fronde baliste, all rights reserved, please site source when reproducing any portion of this slide
Increasing Inequality – Root Cause: Part One - Wage growth stalling?
                • The following slides illustrate a shift when comparing overall wage rate trends to top tier
                  and mid tier income growth. This shift in relationship begins circa 1980.
                • This initial focus on wage begins an examination of root causes of increasing inequality.


                                  Inequalities -           Comparison of Wage vs. Top & Mid Income pre-post 1980                                               Wages vs. Income
110%                                                                                                                                                           Split screen: compares:
108%                                                                                                                                                           • Pre circa 1980 income
                                                                                                                                                                 vs. wage growth
106%
                                                                                                                                                               • Post circa 1980 income
104%
                                                                                                                                                                 vs. wage growth.
102%
                                                                                                                                                               • The chart reveals a
100%
                                                                                                                                                                 change in relationship
 98%                                                                                                                                                             between wages and
                                                                                                                                                                 income for the top
  96%
                  Wage Growth                                 Top & Wage                                                                                         income group.
                  Top vs. Mid                                Growth Exceed
  94%
                    EVEN                                      Mid Income
                                                                                                                                                               • Mid income basically
  92%
                                                                                                                                                                 tracks wage growth,
  90%                                                                                                                                                            while top income shifts
                                                             1982

                                                                    1984

                                                                           1986

                                                                                  1988

                                                                                         1990

                                                                                                1992

                                                                                                       1994

                                                                                                              1996

                                                                                                                     1998

                                                                                                                            2000

                                                                                                                                   2002

                                                                                                                                          2004

                                                                                                                                                 2006

                                                                                                                                                        2008
        1968

                 1970

                        1972

                               1974

                                      1976

                                             1978

                                                    1980


                                                                                                                                                                 staying consistently
       Mid Income          Wages      Top Income
                                                                                                                                                                 higher.


               Copyright © .r. jenkins 2009 - 2010 , fronde baliste, all rights reserved, please site source when reproducing any portion of this slide
Charts based on Census Data – Income Surveys
          I ne qu a lit ies - W ag e G ro wt h vs.To p T ier In co m e G ro w t h p re 1 98 0

                                                                                                         • The chart focuses on Top 20%
                                                                                                           income group to highlight the
                                                                                                  40 %     shift in relationship between
                                                                                                           top tier income and wage.
                                                                                                  35 %


                                                                                                  3 0%
                                                                                                         • This shift is illustrated in the
                                                                                                           next slide.
                                                                                                  2 5%

                                                                                                         • Pre 1980, income growth for
                                                                                                 20 %
                                                                                                           the Mid 20% group
                                                                                                 1 5%      averaged 5% more than Top
                                                                                                           20%, tracking wage trends.
                                                                                                           (Nixon Affirmative Action
   1968


                                                                                                 10%
           1969

                    1970


                                                                                                           Reforms?)
                           1971

                                  1972


                                                                                                 5%
                                         1973

                                                1974

                                                       1975

                                                              1976


                                                                                                 0%
                                                                     1977


                                                                            1978


W a g es          T o p I n co m e
                                                                                   1979


                                                                                          1980


          Shift in Wage vs. Income Growth?
          •         Chart compares overall Wage trends to Top 20% Income growth from 1967 - 1980.
          •         Wage rate growth during this period: 34% : Top Tier income growth for this period: 15%
          •         Pre 1980, wage rates increased faster than top tier Income, an indication of success of
                    policies aimed at protecting & diversifying the workforce?


      Copyright © .r. jenkins 2009 - 2010 , fronde baliste, all rights reserved, please site source when reproducing any portion of this slide
Charts based on Census Data – Income Surveys
        Inequalities - Wage Growth v s. Top Tie r Income Growth post 1980
                                                                                                                    • The period sees a dramatic shift
                                                                                                                      in in which growth in top tier
                                                                                                                      income outstrips wage growth.
                                                                                                             5 0%


                                                                                                             45 %   • The gap persists, and widens.
                                                                                                             40%
                                                                                                                    • The trend for mid income is
                                                                                                            3 5%      opposite. The highest cumulative
                                                                                                            30 %      growth for mid tier occurs 1999
                                                                                                                      to 2001 at 34% (Clinton Jobs
                                                                                                            25%
                                                                                                                      Reforms?)
                                                                                                            2 0%


                                                                                                            1 5%    • This shift is indication of higher
        1982

               1984


                                                                                                                      wage growth rates for high
                        1986

                               1988


                                                                                                            10%
                                      1990


                                                                                                                      wage earners, as well as
                                             1992

                                                    1994


                                                                                                            5%
                                                                                                                      increase in passive income as a
                                                           1996


                                                                  1998


                                                                         2000


                                                                                                            0%        component of top tier income.
                                                                                2002


  Wages               Top Income
                                                                                       2004


                                                                                              2006


                                                                                                     2008              Relevant Article: “We Have To Tolerate
                                                                                                                                         Inequality”
    Shift in Wage vs. Income Growth?
    •          Post 1980 (1981 -2008) Top 20% Income growth caught up with, then exceeded growth in
               Wages, i.e., reversing trend the blue bars began peaking above the purple bars..
    •          Wage rate growth remains: 34% - Top Tier income growth increases to 45%
    •          At the same time, Mid 20% income growth falls behind - lags wage rate growth. (not pictured)


  Copyright © .r. jenkins 2009 - 2010 , fronde baliste, all rights reserved, please site source when reproducing any portion of this slide
Inequalities - C                                          Comparison of Income Growth: before and after 1980


Why is Inequality Increasing:                                                       $200,000

                                                                                    $180,000

                                                                                    $160,000

                                                                                    $140,000

                                                                                     $120,000

                                                                                     $100,000


Symptom
                                                                                                                                                                            Growth Ratio                                                                                                                                                                                 Growth Ratio
                                                                                      $80,000                                                                              Top vs. Lowest                                                                                                                                                                               Top vs. Lowest
                                                                                                                                                                               EVEN                                                                                                                                                                                         400%
                                                                                      $60,000

                                                                                      $40,000


•     Increasing difference in growth trends of                                        $20,000

                                                                                            $0


      income groups


                                                                                                                                                                                                                              1984

                                                                                                                                                                                                                                             1986

                                                                                                                                                                                                                                                      1988

                                                                                                                                                                                                                                                                     1990

                                                                                                                                                                                                                                                                                   1992

                                                                                                                                                                                                                                                                                              1994

                                                                                                                                                                                                                                                                                                            1996

                                                                                                                                                                                                                                                                                                                             1998

                                                                                                                                                                                                                                                                                                                                           2000

                                                                                                                                                                                                                                                                                                                                                          2002

                                                                                                                                                                                                                                                                                                                                                                        2004

                                                                                                                                                                                                                                                                                                                                                                                  2006

                                                                                                                                                                                                                                                                                                                                                                                            2008
                                                                                                    1968

                                                                                                                  1970

                                                                                                                                 1972

                                                                                                                                            1974

                                                                                                                                                          1976

                                                                                                                                                                        1978

                                                                                                                                                                                     1980

                                                                                                                                                                                                   1982
                                                                                                                                                                                  Lowest 20%                                              Middle 20%                           Top 20%
                                                                                                                                                                                                                                                                                                                                                                          income
Cause                                                                                  110%
                                                                                                                                                        I n e q u a l it ie s -                                            Comparison of Wage vs. Top & Mid Income pre-post 1980


                                                                                        1 0 8%


•     Top 20% Income disconnects from – grows                                           10 6 %


      faster than – overall wage rate
                                                                                        104%


                                                                                        1 0 2%


                                                                                         1 00 %


                                                                                          98%


Effect                                                                                     9 6%
                                                                                                                   W ag e G ro w th
                                                                                                                    T o p v s . M id
                                                                                                                                                                                                                               Top & W age
                                                                                           94%                                                                                                                                Growth Ex ceed
                                                                                                                        EV EN
                                                                                                                                                                                                                               Mid Income
                                                                                           92%


•     Continually increasing inequality                                                     90 %


                                                                                                    1968


                                                                                                                   1970


                                                                                                                                   1972


                                                                                                                                                   1974


                                                                                                                                                                    1976


                                                                                                                                                                                     1978


                                                                                                                                                                                                     1980


                                                                                                                                                                                                                    1980

                                                                                                                                                                                                                                   1982

                                                                                                                                                                                                                                             1984

                                                                                                                                                                                                                                                       1986

                                                                                                                                                                                                                                                                     1988

                                                                                                                                                                                                                                                                                   1990

                                                                                                                                                                                                                                                                                             1992

                                                                                                                                                                                                                                                                                                          1994

                                                                                                                                                                                                                                                                                                                      1996

                                                                                                                                                                                                                                                                                                                                        1998

                                                                                                                                                                                                                                                                                                                                                   2000

                                                                                                                                                                                                                                                                                                                                                                 2002

                                                                                                                                                                                                                                                                                                                                                                           2004

                                                                                                                                                                                                                                                                                                                                                                                     2006

                                                                                                                                                                                                                                                                                                                                                                                               2008
                                                                                                                                                                                                                                                                                                                                                                          wage
                                                                                                  M id I n c o m e                       W age s                  T op I ncom e


Solution                                                                                               .48


                                                                                                           .46


•     ‘Work In Progress….Targeted Stimulus”                                                            0.44


                                                                                                       0.42


                                                                                                            0.4


                                                                                                           0.38


     Relevant Research: http://tinyurl.com/GiniEffect                                                      0.36


                                                                                                           0.34

          http://tinyurl.com/LarryMishel-Inequality                                                                2008
                                                                                                                          2006
                                                                                                                                  2004
                                                                                                                                          2002
                                                                                                                                                 2000
                                                                                                                                                          1998
                                                                                                                                                                 1996
                                                                                                                                                                                                                                                                                                                                                               rising

                                                                                                                                                                           1994


                                                                                                                                                                                                                                                                                                                                           Nixon
                                                                                                                                                                                  1992
                                                                                                                                                                                            1990


                                                                                                                                                                                                                                                                                                                               Carter
                                                                                                                                                                                                   1988

                                                                                                                                                                                                            1986


                                                                                                                                                                                                                                                                                                                   R eagan
                                                                                                                                                                                                                   1984

                                                                                                                                                                                                                            1982

                                                                                                                                                                                                                                      1980
                                                                                                                                                                                                                                                                                                                                                             inequality


                                                                                                                                                                                                                                                                                                           B ush
                                                                                                                                                                                                                                              1978

                                                                                                                                                                                                                                                     1976


                                                                                                                                                                                                                                                                                                Clinton
                                                                                                                                                                                                                                                              1974

                                                                                                                                                                                                                                                                            1972


                                                                                                                                                                                                                                                                                    Bush W
                                                                                                                                                                                                                                                                                     1970
    Copyright © .r. jenkins 2009 - 2010 , fronde baliste, all rights reserved, please site source when reproducing any portion of this slide
content courtesy of www.frondebaliste.org
                                                           data from national exit polls

                                                                                                    0.48


                                                                                                     0.46


                                                                                                     0.44


                                                                                                     0.42


                                                                                                       0.4


                                                                                                      0.38


                                                                                                      0.36


                                                                                                      0.34


                                                                                                             2008
                                                                                                                    2006
   End Notes:


                                                                                                                           2004
                                                                                                                                  2002
                                                                                                                                         2000
                                                                                                                                                1998
                                                                                                                                                       1996
                                                                                                                                                              1994


                                                                                                                                                                                                                                                                                                 Nixon
                                                                                                                                                                     1992
                                                                                                                                                                            1990


                                                                                                                                                                                                                                                                                        Carter
                                                                                                                                                                                    1988

                                                                                                                                                                                           1986


                                                                                                                                                                                                                                                                              R eagan
                                                                                                                                                                                                  1984

                                                                                                                                                                                                         1982

                                                                                                                                                                                                                1980


                                                                                                                                                                                                                                                                       Bush
                                                                                                                                                                                                                       1978

                                                                                                                                                                                                                              1976


                                                                                                                                                                                                                                                            Cl inton
                                                                                                                                                                                                                                     1974

                                                                                                                                                                                                                                            1972


                                                                                                                                                                                                                                                   Bush W
                                                                                                                                                                                                                                                    1970
                                                                                                                                                               Bush W              Clinton        Bush          Reagan         Carter       Nixon


   Dimensions in the data; questions on measures1:

   •    How are Productivity and Wage related?


   1.    Subsequent presentations will examine trends in wage and
         productivity. Each analysis examines variation in rates of change vs.
         comparison of absolute values. This “systems thinking” approach is
         employed in hopes of magnifying signals in the data to illustrate
         the impact of economic policy decisions on rates of change. The
         approach will help highlight what has worked, and what has not.

Related Research: a: http://www.talkleft.com/story/2010/3/23/112549/754 b: http://www.stanford.edu/group/scspi/media_magazines.html


    Copyright © .r. jenkins 2009 - 2010 , fronde baliste, all rights reserved, please site source when reproducing any portion of this slide
The next presentation in this series….


                                                                                         q

                                    50.00%


                                    40.00%


                                    30.00%
                                                                                                                   Growth Ratio
                                                                                                                  Top vs. Lowest
                                                                                                                      400%
                                     20.00%


                                     10.00%


                                      0.00%
                                              1968

                                                     1970

                                                            1972

                                                                   1974

                                                                          1976

                                                                                  1978

                                                                                             1980

                                                                                                    1982

                                                                                                           1984

                                                                                                                    1986

                                                                                                                           1988

                                                                                                                                   1990

                                                                                                                                          1992

                                                                                                                                                 1994


                                                                                                                                                        1996


                                                                                                                                                               1998


                                                                                                                                                                      2000


                                                                                                                                                                             2002


                                                                                                                                                                                    2004


                                                                                                                                                                                           2006


                                                                                                                                                                                                  2008
                                                      Middle 20%                 Top 20%               Lowest 20%


Copyright © .r. jenkins 2009 - 2010 , fronde baliste, all rights reserved, please site source when reproducing any portion of this slide
Inequality is Increasing: Do We Know Why?
                A Need for New Measures of Economy?

                                                                                   Part Two
                                                                                         q

                                    50.00%


                                    40.00%


                                    30.00%
                                                                                                                   Growth Ratio
                                                                                                                  Top vs. Lowest
                                                                                                                      400%
                                     20.00%


                                     10.00%


                                      0.00%
                                              1968

                                                     1970

                                                            1972

                                                                   1974

                                                                          1976

                                                                                  1978

                                                                                             1980

                                                                                                    1982

                                                                                                           1984

                                                                                                                    1986

                                                                                                                           1988

                                                                                                                                   1990

                                                                                                                                          1992

                                                                                                                                                 1994


                                                                                                                                                        1996


                                                                                                                                                               1998


                                                                                                                                                                      2000


                                                                                                                                                                             2002


                                                                                                                                                                                    2004


                                                                                                                                                                                           2006


                                                                                                                                                                                                  2008
                                                      Middle 20%                 Top 20%               Lowest 20%


                                       Wage and Productivity

                                  Related Research: :http://tinyurl.com/New-York-Times-Wages


Copyright © .r. jenkins 2009 - 2010 , fronde baliste, all rights reserved, please site source when reproducing any portion of this slide

More Related Content

Viewers also liked

Productivity, Inequality and Mobility, Andrew Leigh
Productivity, Inequality and Mobility, Andrew LeighProductivity, Inequality and Mobility, Andrew Leigh
Productivity, Inequality and Mobility, Andrew LeighStructuralpolicyanalysis
 
Poverty as a challenge class 9
Poverty as a challenge class 9 Poverty as a challenge class 9
Poverty as a challenge class 9 Naren Krishna
 
Inequality, social inequality and gender inequality: where is the women's pos...
Inequality, social inequality and gender inequality: where is the women's pos...Inequality, social inequality and gender inequality: where is the women's pos...
Inequality, social inequality and gender inequality: where is the women's pos...Zakiul Alam
 
Sociology Unit 5 Social Inequality
Sociology Unit 5 Social InequalitySociology Unit 5 Social Inequality
Sociology Unit 5 Social InequalityMrTimBradley
 
Poverty As A Challenge For Upload
Poverty As A Challenge For UploadPoverty As A Challenge For Upload
Poverty As A Challenge For Uploadguestc60b4d0
 
Income inequality
Income inequalityIncome inequality
Income inequalityalishaaan
 
Poverty as a challenge
Poverty as a challengePoverty as a challenge
Poverty as a challengemadan kumar
 
Inequality, Economic Growth and Development
Inequality, Economic Growth and DevelopmentInequality, Economic Growth and Development
Inequality, Economic Growth and Developmenttutor2u
 
Ppt on poverty, poverty, poverty in india, poverty in world, world poverty, p...
Ppt on poverty, poverty, poverty in india, poverty in world, world poverty, p...Ppt on poverty, poverty, poverty in india, poverty in world, world poverty, p...
Ppt on poverty, poverty, poverty in india, poverty in world, world poverty, p...kushagra21
 
Poverty slideshow
Poverty slideshowPoverty slideshow
Poverty slideshowkraekerc
 
Educational Inequality and Social Class
Educational Inequality and Social ClassEducational Inequality and Social Class
Educational Inequality and Social ClassJosh Harsant
 

Viewers also liked (16)

Productivity, Inequality and Mobility, Andrew Leigh
Productivity, Inequality and Mobility, Andrew LeighProductivity, Inequality and Mobility, Andrew Leigh
Productivity, Inequality and Mobility, Andrew Leigh
 
Social inequality
Social inequality Social inequality
Social inequality
 
Social Stratification
Social StratificationSocial Stratification
Social Stratification
 
Poverty as a challenge class 9
Poverty as a challenge class 9 Poverty as a challenge class 9
Poverty as a challenge class 9
 
Inequality, social inequality and gender inequality: where is the women's pos...
Inequality, social inequality and gender inequality: where is the women's pos...Inequality, social inequality and gender inequality: where is the women's pos...
Inequality, social inequality and gender inequality: where is the women's pos...
 
Sociology Unit 5 Social Inequality
Sociology Unit 5 Social InequalitySociology Unit 5 Social Inequality
Sociology Unit 5 Social Inequality
 
Poverty As A Challenge For Upload
Poverty As A Challenge For UploadPoverty As A Challenge For Upload
Poverty As A Challenge For Upload
 
Income inequality
Income inequalityIncome inequality
Income inequality
 
Poverty as a challenge
Poverty as a challengePoverty as a challenge
Poverty as a challenge
 
Inequality, Economic Growth and Development
Inequality, Economic Growth and DevelopmentInequality, Economic Growth and Development
Inequality, Economic Growth and Development
 
Social stratification
Social stratificationSocial stratification
Social stratification
 
Ppt on poverty, poverty, poverty in india, poverty in world, world poverty, p...
Ppt on poverty, poverty, poverty in india, poverty in world, world poverty, p...Ppt on poverty, poverty, poverty in india, poverty in world, world poverty, p...
Ppt on poverty, poverty, poverty in india, poverty in world, world poverty, p...
 
Poverty
PovertyPoverty
Poverty
 
Poverty slideshow
Poverty slideshowPoverty slideshow
Poverty slideshow
 
Social Inequality
Social  InequalitySocial  Inequality
Social Inequality
 
Educational Inequality and Social Class
Educational Inequality and Social ClassEducational Inequality and Social Class
Educational Inequality and Social Class
 

Recently uploaded

Pakistan PMLN Election Manifesto 2024.pdf
Pakistan PMLN Election Manifesto 2024.pdfPakistan PMLN Election Manifesto 2024.pdf
Pakistan PMLN Election Manifesto 2024.pdfFahimUddin61
 
KAHULUGAN AT KAHALAGAHAN NG GAWAING PANSIBIKO.pptx
KAHULUGAN AT KAHALAGAHAN NG GAWAING PANSIBIKO.pptxKAHULUGAN AT KAHALAGAHAN NG GAWAING PANSIBIKO.pptx
KAHULUGAN AT KAHALAGAHAN NG GAWAING PANSIBIKO.pptxjohnandrewcarlos
 
Julius Randle's Injury Status: Surgery Not Off the Table
Julius Randle's Injury Status: Surgery Not Off the TableJulius Randle's Injury Status: Surgery Not Off the Table
Julius Randle's Injury Status: Surgery Not Off the Tableget joys
 
Embed-2 (1).pdfb[k[k[[k[kkkpkdpokkdpkopko
Embed-2 (1).pdfb[k[k[[k[kkkpkdpokkdpkopkoEmbed-2 (1).pdfb[k[k[[k[kkkpkdpokkdpkopko
Embed-2 (1).pdfb[k[k[[k[kkkpkdpokkdpkopkobhavenpr
 
Powerful Love Spells in Phoenix, AZ (310) 882-6330 Bring Back Lost Lover
Powerful Love Spells in Phoenix, AZ (310) 882-6330 Bring Back Lost LoverPowerful Love Spells in Phoenix, AZ (310) 882-6330 Bring Back Lost Lover
Powerful Love Spells in Phoenix, AZ (310) 882-6330 Bring Back Lost LoverPsychicRuben LoveSpells
 
Minto-Morley Reforms 1909 (constitution).pptx
Minto-Morley Reforms 1909 (constitution).pptxMinto-Morley Reforms 1909 (constitution).pptx
Minto-Morley Reforms 1909 (constitution).pptxAwaiskhalid96
 
BDSM⚡Call Girls in Sector 143 Noida Escorts >༒8448380779 Escort Service
BDSM⚡Call Girls in Sector 143 Noida Escorts >༒8448380779 Escort ServiceBDSM⚡Call Girls in Sector 143 Noida Escorts >༒8448380779 Escort Service
BDSM⚡Call Girls in Sector 143 Noida Escorts >༒8448380779 Escort ServiceDelhi Call girls
 
1971 war india pakistan bangladesh liberation.ppt
1971 war india pakistan bangladesh liberation.ppt1971 war india pakistan bangladesh liberation.ppt
1971 war india pakistan bangladesh liberation.pptsammehtumblr
 
TDP As the Party of Hope For AP Youth Under N Chandrababu Naidu’s Leadership
TDP As the Party of Hope For AP Youth Under N Chandrababu Naidu’s LeadershipTDP As the Party of Hope For AP Youth Under N Chandrababu Naidu’s Leadership
TDP As the Party of Hope For AP Youth Under N Chandrababu Naidu’s Leadershipanjanibaddipudi1
 
WhatsApp 📞 8448380779 ✅Call Girls In Chaura Sector 22 ( Noida)
WhatsApp 📞 8448380779 ✅Call Girls In Chaura Sector 22 ( Noida)WhatsApp 📞 8448380779 ✅Call Girls In Chaura Sector 22 ( Noida)
WhatsApp 📞 8448380779 ✅Call Girls In Chaura Sector 22 ( Noida)Delhi Call girls
 
Defensa de JOH insiste que testimonio de analista de la DEA es falso y solici...
Defensa de JOH insiste que testimonio de analista de la DEA es falso y solici...Defensa de JOH insiste que testimonio de analista de la DEA es falso y solici...
Defensa de JOH insiste que testimonio de analista de la DEA es falso y solici...AlexisTorres963861
 
Verified Love Spells in Little Rock, AR (310) 882-6330 Get My Ex-Lover Back
Verified Love Spells in Little Rock, AR (310) 882-6330 Get My Ex-Lover BackVerified Love Spells in Little Rock, AR (310) 882-6330 Get My Ex-Lover Back
Verified Love Spells in Little Rock, AR (310) 882-6330 Get My Ex-Lover BackPsychicRuben LoveSpells
 
BDSM⚡Call Girls in Greater Noida Escorts >༒8448380779 Escort Service
BDSM⚡Call Girls in Greater Noida Escorts >༒8448380779 Escort ServiceBDSM⚡Call Girls in Greater Noida Escorts >༒8448380779 Escort Service
BDSM⚡Call Girls in Greater Noida Escorts >༒8448380779 Escort ServiceDelhi Call girls
 
28042024_First India Newspaper Jaipur.pdf
28042024_First India Newspaper Jaipur.pdf28042024_First India Newspaper Jaipur.pdf
28042024_First India Newspaper Jaipur.pdfFIRST INDIA
 
Call Girls in Mira Road Mumbai ( Neha 09892124323 ) College Escorts Service i...
Call Girls in Mira Road Mumbai ( Neha 09892124323 ) College Escorts Service i...Call Girls in Mira Road Mumbai ( Neha 09892124323 ) College Escorts Service i...
Call Girls in Mira Road Mumbai ( Neha 09892124323 ) College Escorts Service i...Pooja Nehwal
 
BDSM⚡Call Girls in Sector 135 Noida Escorts >༒8448380779 Escort Service
BDSM⚡Call Girls in Sector 135 Noida Escorts >༒8448380779 Escort ServiceBDSM⚡Call Girls in Sector 135 Noida Escorts >༒8448380779 Escort Service
BDSM⚡Call Girls in Sector 135 Noida Escorts >༒8448380779 Escort ServiceDelhi Call girls
 
Enjoy Night⚡Call Girls Rajokri Delhi >༒8448380779 Escort Service
Enjoy Night⚡Call Girls Rajokri Delhi >༒8448380779 Escort ServiceEnjoy Night⚡Call Girls Rajokri Delhi >༒8448380779 Escort Service
Enjoy Night⚡Call Girls Rajokri Delhi >༒8448380779 Escort ServiceDelhi Call girls
 
How Europe Underdeveloped Africa_walter.pdf
How Europe Underdeveloped Africa_walter.pdfHow Europe Underdeveloped Africa_walter.pdf
How Europe Underdeveloped Africa_walter.pdfLorenzo Lemes
 
Embed-4.pdf lkdiinlajeklhndklheduhuekjdh
Embed-4.pdf lkdiinlajeklhndklheduhuekjdhEmbed-4.pdf lkdiinlajeklhndklheduhuekjdh
Embed-4.pdf lkdiinlajeklhndklheduhuekjdhbhavenpr
 
Nara Chandrababu Naidu's Visionary Policies For Andhra Pradesh's Development
Nara Chandrababu Naidu's Visionary Policies For Andhra Pradesh's DevelopmentNara Chandrababu Naidu's Visionary Policies For Andhra Pradesh's Development
Nara Chandrababu Naidu's Visionary Policies For Andhra Pradesh's Developmentnarsireddynannuri1
 

Recently uploaded (20)

Pakistan PMLN Election Manifesto 2024.pdf
Pakistan PMLN Election Manifesto 2024.pdfPakistan PMLN Election Manifesto 2024.pdf
Pakistan PMLN Election Manifesto 2024.pdf
 
KAHULUGAN AT KAHALAGAHAN NG GAWAING PANSIBIKO.pptx
KAHULUGAN AT KAHALAGAHAN NG GAWAING PANSIBIKO.pptxKAHULUGAN AT KAHALAGAHAN NG GAWAING PANSIBIKO.pptx
KAHULUGAN AT KAHALAGAHAN NG GAWAING PANSIBIKO.pptx
 
Julius Randle's Injury Status: Surgery Not Off the Table
Julius Randle's Injury Status: Surgery Not Off the TableJulius Randle's Injury Status: Surgery Not Off the Table
Julius Randle's Injury Status: Surgery Not Off the Table
 
Embed-2 (1).pdfb[k[k[[k[kkkpkdpokkdpkopko
Embed-2 (1).pdfb[k[k[[k[kkkpkdpokkdpkopkoEmbed-2 (1).pdfb[k[k[[k[kkkpkdpokkdpkopko
Embed-2 (1).pdfb[k[k[[k[kkkpkdpokkdpkopko
 
Powerful Love Spells in Phoenix, AZ (310) 882-6330 Bring Back Lost Lover
Powerful Love Spells in Phoenix, AZ (310) 882-6330 Bring Back Lost LoverPowerful Love Spells in Phoenix, AZ (310) 882-6330 Bring Back Lost Lover
Powerful Love Spells in Phoenix, AZ (310) 882-6330 Bring Back Lost Lover
 
Minto-Morley Reforms 1909 (constitution).pptx
Minto-Morley Reforms 1909 (constitution).pptxMinto-Morley Reforms 1909 (constitution).pptx
Minto-Morley Reforms 1909 (constitution).pptx
 
BDSM⚡Call Girls in Sector 143 Noida Escorts >༒8448380779 Escort Service
BDSM⚡Call Girls in Sector 143 Noida Escorts >༒8448380779 Escort ServiceBDSM⚡Call Girls in Sector 143 Noida Escorts >༒8448380779 Escort Service
BDSM⚡Call Girls in Sector 143 Noida Escorts >༒8448380779 Escort Service
 
1971 war india pakistan bangladesh liberation.ppt
1971 war india pakistan bangladesh liberation.ppt1971 war india pakistan bangladesh liberation.ppt
1971 war india pakistan bangladesh liberation.ppt
 
TDP As the Party of Hope For AP Youth Under N Chandrababu Naidu’s Leadership
TDP As the Party of Hope For AP Youth Under N Chandrababu Naidu’s LeadershipTDP As the Party of Hope For AP Youth Under N Chandrababu Naidu’s Leadership
TDP As the Party of Hope For AP Youth Under N Chandrababu Naidu’s Leadership
 
WhatsApp 📞 8448380779 ✅Call Girls In Chaura Sector 22 ( Noida)
WhatsApp 📞 8448380779 ✅Call Girls In Chaura Sector 22 ( Noida)WhatsApp 📞 8448380779 ✅Call Girls In Chaura Sector 22 ( Noida)
WhatsApp 📞 8448380779 ✅Call Girls In Chaura Sector 22 ( Noida)
 
Defensa de JOH insiste que testimonio de analista de la DEA es falso y solici...
Defensa de JOH insiste que testimonio de analista de la DEA es falso y solici...Defensa de JOH insiste que testimonio de analista de la DEA es falso y solici...
Defensa de JOH insiste que testimonio de analista de la DEA es falso y solici...
 
Verified Love Spells in Little Rock, AR (310) 882-6330 Get My Ex-Lover Back
Verified Love Spells in Little Rock, AR (310) 882-6330 Get My Ex-Lover BackVerified Love Spells in Little Rock, AR (310) 882-6330 Get My Ex-Lover Back
Verified Love Spells in Little Rock, AR (310) 882-6330 Get My Ex-Lover Back
 
BDSM⚡Call Girls in Greater Noida Escorts >༒8448380779 Escort Service
BDSM⚡Call Girls in Greater Noida Escorts >༒8448380779 Escort ServiceBDSM⚡Call Girls in Greater Noida Escorts >༒8448380779 Escort Service
BDSM⚡Call Girls in Greater Noida Escorts >༒8448380779 Escort Service
 
28042024_First India Newspaper Jaipur.pdf
28042024_First India Newspaper Jaipur.pdf28042024_First India Newspaper Jaipur.pdf
28042024_First India Newspaper Jaipur.pdf
 
Call Girls in Mira Road Mumbai ( Neha 09892124323 ) College Escorts Service i...
Call Girls in Mira Road Mumbai ( Neha 09892124323 ) College Escorts Service i...Call Girls in Mira Road Mumbai ( Neha 09892124323 ) College Escorts Service i...
Call Girls in Mira Road Mumbai ( Neha 09892124323 ) College Escorts Service i...
 
BDSM⚡Call Girls in Sector 135 Noida Escorts >༒8448380779 Escort Service
BDSM⚡Call Girls in Sector 135 Noida Escorts >༒8448380779 Escort ServiceBDSM⚡Call Girls in Sector 135 Noida Escorts >༒8448380779 Escort Service
BDSM⚡Call Girls in Sector 135 Noida Escorts >༒8448380779 Escort Service
 
Enjoy Night⚡Call Girls Rajokri Delhi >༒8448380779 Escort Service
Enjoy Night⚡Call Girls Rajokri Delhi >༒8448380779 Escort ServiceEnjoy Night⚡Call Girls Rajokri Delhi >༒8448380779 Escort Service
Enjoy Night⚡Call Girls Rajokri Delhi >༒8448380779 Escort Service
 
How Europe Underdeveloped Africa_walter.pdf
How Europe Underdeveloped Africa_walter.pdfHow Europe Underdeveloped Africa_walter.pdf
How Europe Underdeveloped Africa_walter.pdf
 
Embed-4.pdf lkdiinlajeklhndklheduhuekjdh
Embed-4.pdf lkdiinlajeklhndklheduhuekjdhEmbed-4.pdf lkdiinlajeklhndklheduhuekjdh
Embed-4.pdf lkdiinlajeklhndklheduhuekjdh
 
Nara Chandrababu Naidu's Visionary Policies For Andhra Pradesh's Development
Nara Chandrababu Naidu's Visionary Policies For Andhra Pradesh's DevelopmentNara Chandrababu Naidu's Visionary Policies For Andhra Pradesh's Development
Nara Chandrababu Naidu's Visionary Policies For Andhra Pradesh's Development
 

Why Is Inequality Increasing? (view full screen)

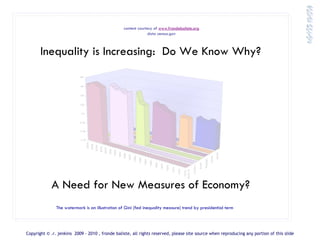
  • 1. content courtesy of www.frondebaliste.org data census.gov Inequality is Increasing: Do We Know Why? .48 .46 0.44 0.42 0.4 0.38 0.36 0.34 2008 2006 2004 2002 2000 1998 1996 1994 Nixon 1992 1990 Carter 1988 1986 R eagan 1984 1982 1980 B ush 1978 1976 Clinton 1974 1972 Bush W 1970 A Need for New Measures of Economy? The watermark is an illustration of Gini (fed inequality measure) trend by presidential term Copyright © .r. jenkins 2009 - 2010 , fronde baliste, all rights reserved, please site source when reproducing any portion of this slide
  • 2. content courtesy of www.frondebaliste.org data from national exit polls Definitions and Questions: • Is income properly defined? • How do wages and income differ? • Does growth always produce inequality? Comparison of Wage vs. Top & Mid Income pre-post 1980 Comparison of Income Growth: before and after 1980 .48 .46 0.44 0.42 0.4 Growth Ratio Top vs. Lowest 0.38 400% 0.36 Top & W age Growth Ex ceed Mid Income 0.34 2008 2006 2004 2002 2000 1998 1996 1994 Nixon 1992 1990 Carter 1988 1986 1980 1982 1984 1986 1988 1990 1992 1994 1996 1998 2000 2002 2004 2006 2008 R eagan 1984 1986 1988 1990 1992 1994 1996 1998 2000 2002 2004 2006 2008 1984 1982 1980 Bush 1978 1976 Clinton 1974 1972 Bush W 1970 Middle 20% Top 20% Copyright © rhesa jenkins 2009 - 2010 , fronde baliste, all rights reserved, please site source when reproducing any portion of this slide
  • 3. Why is inequality increasing? • The presentation paints a picture of continuing increase in inequality • As a starting point, inequality is defined in terms of disparity in income growth • Trend charts are presented comparing Income vs. Wage growth. This is first in a series of comparisons examining origins of increase in inequality. • The purpose of the presentation is to highlight metrics that reveal root cause relationships, the understanding of which can guide development of solutions. Inequalities - C Comparison of Income Growth: before and after 1980 Increasing Inequality? $200,000 Split screen of: $180,000 • Pre circa 1980 income $160,000 stratification $140,000 • Post circa 1980 income $120,000 stratification. $100,000 Growth Ratio • Income stratification Growth Ratio $80,000 Top vs. Lowest Top vs. Lowest 400% itself has many causes. EVEN $60,000 The focus of the $40,000 presentation is on $20,000 increasing inequality, not simply stratification $0 1984 1986 1988 1990 1992 1994 1996 1998 2000 2002 2004 2006 2008 1968 1970 1972 1974 1976 1978 1980 1982 Lowest 20% Middle 20% Top 20% Copyright © .r. jenkins 2009 - 2010 , fronde baliste, all rights reserved, please site source when reproducing any portion of this slide
  • 4. Charts based on Census Data – Income Surveys Inequalities - Income Growth: before 1980 • Income growth reported in $200,000 census data is based on $180,000 annual reports by household $160,000 • Data is reported by quintile (5 $140,000 earnings groups from highest $120,000 to lowest 20%) $100,000 $80,000 • Before 1980 growth in $60,000 income for low and middle Growth Ratio Top vs. Lowest 20% households was above or $40,000 EVEN equal to growth for high $20,000 income households $0 1967 • Mid 20% growth rate per 1968 1969 1970 1971 annum: 1.9% 1972 1973 1974 • Top 20% growth rate per 1975 1976 1977 1978 annum: 1.4% 1979 1980 1981 Lowest 20% Middle 20% Top 20% Income Growth Trends • Chart illustrates income growth from 1967 to 1981 for low – middle (16%), and top income (14%) groups. Growth rates are virtually even. • If this trend continued, inequality would have decreased over time. Copyright © .r. jenkins 2009 - 2010 , fronde baliste, all rights reserved, please site source when reproducing any portion of this slide
  • 5. Charts based on Census Data – Income Surveys $200,000 Inequalities - Income Growth: after 1980 • After 1980, income growth for low income and middle income $180,000 groups stalls and flattens at a $160,000 rate less than pre-1980 $140,000 growth rates. $120,000 $100,000 • After 1980 growth for the top Growth Ratio income group is steep and $80,000 Top vs. Lowest 400% sustained (Reagan Tax $60,000 Reforms?) $40,000 $20,000 • Mid 20% annual growth rate: $0 .03% • Top 20% annual growth rate: 1982 1983 1984 1985 1986 1987 1.3% 1988 1989 1990 1991 1992 1993 1994 1995 1996 1997 1998 1999 2000 2001 2002 2003 2004 2005 Lowest 20% Middle 20% Top 20% 2006 2007 2008 Origins of Wealth Gap? • Chart illustrates income growth from 1982 to 2008 for low – middle (13 %) and top (46 %) income groups • Disparity in growth in income for low- mid vs. top income groups grew to nearly 400% • Summary: 1967 to 2008 income growth for the top group was sustained. Income growth for the mid group decreased from1.9% per year pre 1980, to essentially non-existent post 1980 Copyright © .r. jenkins 2009 - 2010 , fronde baliste, all rights reserved, please site source when reproducing any portion of this slide
  • 6. Charts based on Census Data – Income Surveys $30,000 Inequalities - Equalizing Income Growth • The chart shows impact if $25,000 income growth rates are equalized after 1980. Top $20,000 tier: low tier multiplier measure of inequality is cut in half. $15,000 • Impact of equalizing growth $10,000 Equalizing Growth rates on multiplier as a measure Rates: Low Tier $5,000 Income Doubles of inequality: • Current Multiplier 15x $0 • Adjusted Multiplier 8x 1980 1982 1984 1986 1988 1990 1992 1994 1996 1998 2000 2002 Actual Low Tier Trend Adjusted Low Tier Trend 2004 2006 2008 Equalizing Income Growth Trends • Chart illustrates the impact if low tier income growth rates, from 1981 to 2008, are adjusted to equal growth rates of the top tier income over the same period. • If mid – low income growth matched top group growth after 1980, current day mid- low income would be 82% higher than reported 2008 levels • Reported low income $11K/yr : Adjusted to top tier growth: $21K/yr Copyright © .r. jenkins 2009 - 2010 , fronde baliste, all rights reserved, please site source when reproducing any portion of this slide
  • 7. Increasing Inequality – Root Cause: Part One - Wage growth stalling? • The following slides illustrate a shift when comparing overall wage rate trends to top tier and mid tier income growth. This shift in relationship begins circa 1980. • This initial focus on wage begins an examination of root causes of increasing inequality. Inequalities - Comparison of Wage vs. Top & Mid Income pre-post 1980 Wages vs. Income 110% Split screen: compares: 108% • Pre circa 1980 income vs. wage growth 106% • Post circa 1980 income 104% vs. wage growth. 102% • The chart reveals a 100% change in relationship 98% between wages and income for the top 96% Wage Growth Top & Wage income group. Top vs. Mid Growth Exceed 94% EVEN Mid Income • Mid income basically 92% tracks wage growth, 90% while top income shifts 1982 1984 1986 1988 1990 1992 1994 1996 1998 2000 2002 2004 2006 2008 1968 1970 1972 1974 1976 1978 1980 staying consistently Mid Income Wages Top Income higher. Copyright © .r. jenkins 2009 - 2010 , fronde baliste, all rights reserved, please site source when reproducing any portion of this slide
  • 8. Charts based on Census Data – Income Surveys I ne qu a lit ies - W ag e G ro wt h vs.To p T ier In co m e G ro w t h p re 1 98 0 • The chart focuses on Top 20% income group to highlight the 40 % shift in relationship between top tier income and wage. 35 % 3 0% • This shift is illustrated in the next slide. 2 5% • Pre 1980, income growth for 20 % the Mid 20% group 1 5% averaged 5% more than Top 20%, tracking wage trends. (Nixon Affirmative Action 1968 10% 1969 1970 Reforms?) 1971 1972 5% 1973 1974 1975 1976 0% 1977 1978 W a g es T o p I n co m e 1979 1980 Shift in Wage vs. Income Growth? • Chart compares overall Wage trends to Top 20% Income growth from 1967 - 1980. • Wage rate growth during this period: 34% : Top Tier income growth for this period: 15% • Pre 1980, wage rates increased faster than top tier Income, an indication of success of policies aimed at protecting & diversifying the workforce? Copyright © .r. jenkins 2009 - 2010 , fronde baliste, all rights reserved, please site source when reproducing any portion of this slide
  • 9. Charts based on Census Data – Income Surveys Inequalities - Wage Growth v s. Top Tie r Income Growth post 1980 • The period sees a dramatic shift in in which growth in top tier income outstrips wage growth. 5 0% 45 % • The gap persists, and widens. 40% • The trend for mid income is 3 5% opposite. The highest cumulative 30 % growth for mid tier occurs 1999 to 2001 at 34% (Clinton Jobs 25% Reforms?) 2 0% 1 5% • This shift is indication of higher 1982 1984 wage growth rates for high 1986 1988 10% 1990 wage earners, as well as 1992 1994 5% increase in passive income as a 1996 1998 2000 0% component of top tier income. 2002 Wages Top Income 2004 2006 2008 Relevant Article: “We Have To Tolerate Inequality” Shift in Wage vs. Income Growth? • Post 1980 (1981 -2008) Top 20% Income growth caught up with, then exceeded growth in Wages, i.e., reversing trend the blue bars began peaking above the purple bars.. • Wage rate growth remains: 34% - Top Tier income growth increases to 45% • At the same time, Mid 20% income growth falls behind - lags wage rate growth. (not pictured) Copyright © .r. jenkins 2009 - 2010 , fronde baliste, all rights reserved, please site source when reproducing any portion of this slide
  • 10. Inequalities - C Comparison of Income Growth: before and after 1980 Why is Inequality Increasing: $200,000 $180,000 $160,000 $140,000 $120,000 $100,000 Symptom Growth Ratio Growth Ratio $80,000 Top vs. Lowest Top vs. Lowest EVEN 400% $60,000 $40,000 • Increasing difference in growth trends of $20,000 $0 income groups 1984 1986 1988 1990 1992 1994 1996 1998 2000 2002 2004 2006 2008 1968 1970 1972 1974 1976 1978 1980 1982 Lowest 20% Middle 20% Top 20% income Cause 110% I n e q u a l it ie s - Comparison of Wage vs. Top & Mid Income pre-post 1980 1 0 8% • Top 20% Income disconnects from – grows 10 6 % faster than – overall wage rate 104% 1 0 2% 1 00 % 98% Effect 9 6% W ag e G ro w th T o p v s . M id Top & W age 94% Growth Ex ceed EV EN Mid Income 92% • Continually increasing inequality 90 % 1968 1970 1972 1974 1976 1978 1980 1980 1982 1984 1986 1988 1990 1992 1994 1996 1998 2000 2002 2004 2006 2008 wage M id I n c o m e W age s T op I ncom e Solution .48 .46 • ‘Work In Progress….Targeted Stimulus” 0.44 0.42 0.4 0.38 Relevant Research: http://tinyurl.com/GiniEffect 0.36 0.34 http://tinyurl.com/LarryMishel-Inequality 2008 2006 2004 2002 2000 1998 1996 rising 1994 Nixon 1992 1990 Carter 1988 1986 R eagan 1984 1982 1980 inequality B ush 1978 1976 Clinton 1974 1972 Bush W 1970 Copyright © .r. jenkins 2009 - 2010 , fronde baliste, all rights reserved, please site source when reproducing any portion of this slide
  • 11. content courtesy of www.frondebaliste.org data from national exit polls 0.48 0.46 0.44 0.42 0.4 0.38 0.36 0.34 2008 2006 End Notes: 2004 2002 2000 1998 1996 1994 Nixon 1992 1990 Carter 1988 1986 R eagan 1984 1982 1980 Bush 1978 1976 Cl inton 1974 1972 Bush W 1970 Bush W Clinton Bush Reagan Carter Nixon Dimensions in the data; questions on measures1: • How are Productivity and Wage related? 1. Subsequent presentations will examine trends in wage and productivity. Each analysis examines variation in rates of change vs. comparison of absolute values. This “systems thinking” approach is employed in hopes of magnifying signals in the data to illustrate the impact of economic policy decisions on rates of change. The approach will help highlight what has worked, and what has not. Related Research: a: http://www.talkleft.com/story/2010/3/23/112549/754 b: http://www.stanford.edu/group/scspi/media_magazines.html Copyright © .r. jenkins 2009 - 2010 , fronde baliste, all rights reserved, please site source when reproducing any portion of this slide
  • 12. The next presentation in this series…. q 50.00% 40.00% 30.00% Growth Ratio Top vs. Lowest 400% 20.00% 10.00% 0.00% 1968 1970 1972 1974 1976 1978 1980 1982 1984 1986 1988 1990 1992 1994 1996 1998 2000 2002 2004 2006 2008 Middle 20% Top 20% Lowest 20% Copyright © .r. jenkins 2009 - 2010 , fronde baliste, all rights reserved, please site source when reproducing any portion of this slide
  • 13. Inequality is Increasing: Do We Know Why? A Need for New Measures of Economy? Part Two q 50.00% 40.00% 30.00% Growth Ratio Top vs. Lowest 400% 20.00% 10.00% 0.00% 1968 1970 1972 1974 1976 1978 1980 1982 1984 1986 1988 1990 1992 1994 1996 1998 2000 2002 2004 2006 2008 Middle 20% Top 20% Lowest 20% Wage and Productivity Related Research: :http://tinyurl.com/New-York-Times-Wages Copyright © .r. jenkins 2009 - 2010 , fronde baliste, all rights reserved, please site source when reproducing any portion of this slide
  • 14. Copyright © .r. jenkins 2009 - 2010 , fronde baliste, all rights reserved, please site source when reproducing any portion of this slide