SKIM Segmentation - Examples of client deliverables
•
2 likes•4,513 views

For more information, visit skimgroup.com/segmentation

Recommended
More Related Content
Similar to SKIM Segmentation - Examples of client deliverables
Similar to SKIM Segmentation - Examples of client deliverables (20)
More from SKIM
More from SKIM (20)
Recently uploaded
Recently uploaded (20)
SKIM Segmentation - Examples of client deliverables
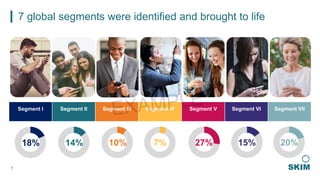
- 1. Segment I Segment II Segment III Segment IV Segment V Segment VI Segment VII 18% 14% 10% 7% 27% 15% 20% 1 7 global segments were identified and brought to life
- 2. 2 Segment Overview I value high quality, and buy a lot of products and services. I am worried about companies having my personal data stored I want my provider to provide a premium experience for me. SEGMENT 1 SEGMENT 2 SEGMENT 3 Persona High Level Importance Personalized Products & Services Premium Brands Tech Savvy Bundled Products & Services Great TV Connected Everywhere ID Protection Products Tech-Savviness High High Medium Service Engagement Medium Medium Medium Interest in Adding Products and Services High High High Switchers Yes Yes Yes Average Household Income $117 K $106 K $97 K Average Age 35 39 40 Average Bundle Spend $145 $145 $145 % with OTT 74% 76% 67% Average OTT Spend $68 $49 $61
- 3. 3 Meet our Segment 1 ▪ feel that technology products represent who they are ▪ want the coolest tech, but are too busy to do the research to figure out what that is ▪ want personalized recommendations on what they should buy Extremely social beings who use technology for enjoyment & entertainment Indulgence Practicality Does extensive research before making technology decisions Relies on company to make recommendations and decisions for them “Without my iPad and iPhone I would be COMPLETELY LOST, LONELY AND TOTALLY BORED out of my mind!!! I will be just a normal person without my devices. Others will see me as a LAME without my iPhone, iPod, MacBook Pro, and iPad. I am way too fly to be LAME.”
- 4. GENDER RACE MEAN AGE 35 YEARS OLD 66% MALE 76% CAUCASIAN MEAN INCOME NUMBER OF KIDS $117K PER YEAR 4 Segment 1 Demographics Segment 1 tends to be males that are married with kids. They live a very busy lifestyle in urban areas, and are the youngest of all the segments. They also are the most likely to have graduated college and moved out on their own in the past 2 years. 70% 55% 57% 70% Be married (avg. = 58%) Live in an urban area (avg. = 33%) Personally monitor their data closely (avg. = 43%) Feel that the type of brands they buy says something about who they are (avg. = 37%) SOUTHWEST — 17% WEST — 25% NORTHEAST — 16% SOUTHEAST — 17% CENTRAL — 25% LIFE STAGE: SEGMENT 1 IS MORE LIKELY TO… 2 EDUCATION High School Diploma — 11% Some College — 15% College Degree — 47% Post-grad Degree — 16% ETHNICITY Caucasian: Hispanic: Asian: AA: 76% 13% 9% 7%
- 5. 5 Meet our Segment 2 ▪ value quality technology products ▪ love the category and do their own research on products and services ▪ have a lot of add-on services ▪ always have their cell phones and use a ton of data Love technology & learning about new products and services Indulgence Practicality Does extensive research before making technology decisions Relies on companies to make recommendations and decisions for them “I am a huge fan of technology and have been all my life. Technology, when used properly, can make a huge positive impact in our daily lives. I think of the changes that have taken place in my lifespan and am blown away by what seemed impossible not too long ago. As a lifelong fan of Star Trek, I look forward to seeing how new technologies can improve the human condition.”
- 6. GENDER RACE MEAN AGE 39 YEARS OLD 57% MALE 81% CAUCASIAN MEAN INCOME NUMBER OF KIDS $106K PER YEAR 6 Segment 2 Demographics Segment 2 tend to be males living in a suburban areas. They love high-quality tech and pay more for add-on services. They are most likely to be the sole decision makers for technology services. SOUTHWEST — 15% WEST — 24% NORTHEAST — 16% SOUTHEAST — 18% CENTRAL — 28% 64% 18% 26% 52% Be married (avg. = 58%) Have begun travelling domestically more in the past two years (avg. = 13%) Have made a significant purchase in the past 2 years (avg. = 19%) Feel that the type of brands they buy says something about who they are (avg. = 37%) LIFE STAGE: SEGMENT 2 ARE MORE LIKELY TO… 2 ETHNICITY Caucasian: Hispanic: Asian: AA: 81% 11% 6% 6% EDUCATION High school Diploma — 9% Some College — 21% College Degree — 40% Post-grad Degree — 19%
- 7. 7 Meet our Segment 3 ▪ are wary of how much personal information is stored with companies ▪ are seriously considering buying identity and personal data protection services Conflicted about heavy technology dependence: feel guilty and try to “digitally detox” Indulgence Practicality Does extensive research before making technology decisions Relies on companies to make recommendations and decisions for them “Entertainment always steals time away from me, time I could spend making a real human connection with someone in that grocery store, time I could have spent sleeping or petting my dog or hugging my partner even more. I love entertainment and connections no doubt but it takes away chances to really experience life more authentically and with a lot less distraction.”
- 8. GENDER RACE MEAN AGE 40 YEARS OLD 56% MALE 81% CAUCASIAN MEAN INCOME NUMBER OF KIDS $97K PER YEAR 8 Segment 3 Demographics Segment 3 tends to be Caucasian males who are employed full-time. They always have their technology with them, and are very interested in protecting their identity and personal data. SOUTHWEST — 15% WEST — 26% NORTHEAST — 14% SOUTHEAST — 18% CENTRAL — 27% 17% 7% 49% 46% Have had a large increase in household income in the past 2 years (avg. = 11%) Have had a child enter high school in the past 2 years (avg. = 4%) Personally monitor their data closely (avg. = 43%) Feel that the type of brands they buy says something about who they are (avg. = 37%) LIFE STAGE: SEGMENT 3 ARE MORE LIKELY TO… 2 ETHNICITY Caucasian: Hispanic: Asian: AA: 81% 11% 6% 9% EDUCATION High school Diploma — 9% Some College — 21% College Degree — 39% Post-grad Degree — 18%
- 9. 9 Market Size of Segments Client Proportion of Share Competitor 1 Proportion of Share Competitor 2 Proportion of Share TotalMarket Share 30% 15% 20% 20% 50% 35% 25% 20% 40% 100% 100% 100% 40% 25% 35% Competitor 3 Proportion of Share 25% 15% 5% Segment 1 Segment 2 Segment 3