Aberdeen analyst insight a.m. castle
•
1 like•1,364 views

Why Sandler Training is one of the most consistent qualifiers of a salespersons success.

Recommended
More Related Content
Recently uploaded
Recently uploaded (20)
Featured
Featured (20)
Aberdeen analyst insight a.m. castle
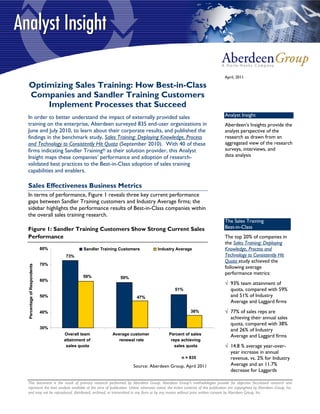
- 1. April, 2011 Optimizing Sales Training: How Best-in-Class Companies and Sandler Training Customers Implement Processes that Succeed In order to better understand the impact of externally provided sales Analyst Insight training on the enterprise, Aberdeen surveyed 835 end-user organizations in Aberdeen’s Insights provide the June and July 2010, to learn about their corporate results, and published the analyst perspective of the findings in the benchmark study, Sales Training: Deploying Knowledge, Process research as drawn from an and Technology to Consistently Hit Quota (September 2010). With 40 of these aggregated view of the research firms indicating Sandler Training® as their solution provider, this Analyst surveys, interviews, and Insight maps these companies’ performance and adoption of research- data analysis validated best practices to the Best-in-Class adoption of sales training capabilities and enablers. Sales Effectiveness Business Metrics In terms of performance, Figure 1 reveals three key current performance gaps between Sandler Training customers and Industry Average firms; the sidebar highlights the performance results of Best-in-Class companies within the overall sales training research. The Sales Training Figure 1: Sandler Training Customers Show Strong Current Sales Best-in-Class Performance The top 20% of companies in the Sales Training: Deploying 80% Sandler Training Customers Industry Average Knowledge, Process and 73% Technology to Consistently Hit Quota study achieved the 70% Percentage of Respondents following average performance metrics: 59% 59% 60% √ 93% team attainment of 51% quota, compared with 59% 50% 47% and 51% of Industry Average and Laggard firms 40% 38% √ 77% of sales reps are achieving their annual sales quota, compared with 38% 30% and 26% of Industry Overall team Average customer Percent of sales Average and Laggard firms attainment of renewal rate reps achieving sales quota sales quota √ 14.8 % average year-over- year increase in annual n = 835 revenue, vs. 2% for Industry Source: Aberdeen Group, April 2011 Average and an 11.7% decrease for Laggards This document is the result of primary research performed by Aberdeen Group. Aberdeen Group's methodologies provide for objective fact-based research and represent the best analysis available at the time of publication. Unless otherwise noted, the entire contents of this publication are copyrighted by Aberdeen Group, Inc. and may not be reproduced, distributed, archived, or transmitted in any form or by any means without prior written consent by Aberdeen Group, Inc.
- 2. Optimizing Sales Training: How Best-in-Class Companies and Sandler Training Customers Implement Processes that Succeed Page 2 With better quota attainment and more efficient customer loyalty, these firms – and their sales professionals- are achieving admirable sales effectiveness results. Closer examination will show that these organizations are outperforming Industry Average companies because they are more likely to have adopted key Best-in-Class differentiators. Now, let's take a look at a number of best practices in sales training that the top performers within the research are deploying, as well as comparing the adoption by Sandler Training customers of the same. Instructor-Led Training How do the top-performing organizations deliver best sales practices to their team? Figure 2 shows us that the most traditional approach is secure, in that live, instructor-led sessions are by far considered the most effective modality, among all survey respondents. Such a tried-and-true finding does not detract from the value of contemporary technologies – in fact, 51% of the top performers also use online e-learning, mobile and video modalities to support their instructor-led approach – but merely supports, as a best practice, a proven approach that works. In the case of Sandler Training customers, predictably since they actively acquire this specific approach, 88% of them consider instructor-led training as the most effective training modality, higher than the Best-in-Class. Figure 2: Most Effective Sales Training Modalities by the Best-in-Class 90% 83% 80% 75% Best-in-Class All others 70% Percentage of Respondents 60% 50% 40% 40% 31% 30% 28% 25% 27% 20% 20% 16% 8% 8% 8% 10% 0% Instructor- Formal or On-the-job Blended Synchronous, Asynchronous, led, in- structured instructor- live online self-paced person mentoring/ led and e- coaching learning n = 835 Source: Aberdeen Group, September 2010 © 2011 Aberdeen Group. Telephone: 617 854 5200 www.aberdeen.com Fax: 617 723 7897
- 3. Optimizing Sales Training: How Best-in-Class Companies and Sandler Training Customers Implement Processes that Succeed Page 3 Post-Training Reinforcement Best-in-Class companies outpace Laggards in the research by nearly a two- Aberdeen’s PACE Methodology times factor (54% vs. 28%) in providing post-training reinforcement of the Aberdeen applies a methodology best practices commonly learned in classroom-style, instructor-led sales to benchmark research that education sessions. The sales leaders of these firms have learned that long- evaluates the business Pressures, term success depends on underscoring the best practices taught in sales Actions, Capabilities, and training deployments, not only among the reps that have experienced the Enablers (PACE) that indicate training, but also in extending this knowledge to future hires and other corporate behavior in specific customer-facing functions within the enterprise. Moreover, the concept of business processes: "tribal knowledge" is based on an assumption that sales reps themselves, as √ Pressures — external forces well as marketers, customer service professionals and other market-facing that impact an organization’s staff, can contribute to the enterprise's understanding of selling best market position, practices. Plus, the modalities used for secondary sales training and beyond competitiveness, or business can also be more geared toward online and remote support, as opposed to operations. the more costly but still highly beneficial initial or annual classroom-style approach. In Figure 3, we see the significant year-over-year performance √ Actions — the strategic approaches that an deltas enjoyed by adopters of this knowledge management capability, when organization takes in response compared with other firms; at 46% adoption, Sandler Training customers to industry pressures. trail the Best-in-Class, though an additional 18% indicate plans to do so within the next 12 months. √ Capabilities — the business process competencies (process, organization, Figure 3: Keeping Best Practices Top-of-Mind with Post-Training performance and knowledge Reinforcement management) required to execute corporate strategy. Post-training reinforcement users No use of reinforcement 1.0% 0.8% √ Enablers — the key 0.6% functionality of technology 0.2% solutions required to support 0.0% the organization’s enabling -0.2% business practices. -1.0% YOY change -1.4% -2.0% -2.1% -2.5% -2.7% -2.7% -3.0% -4.0% -4.0% Team Time to Reps Sales Sales -5.0% attainment productivity achieving turnover cycle of quota quota reduction reduction n = 835 Source: Aberdeen Group, April 2011 © 2011 Aberdeen Group. Telephone: 617 854 5200 www.aberdeen.com Fax: 617 723 7897
- 4. Optimizing Sales Training: How Best-in-Class Companies and Sandler Training Customers Implement Processes that Succeed Page 4 Behavioral Analysis and Assessment Now, let’s examine behavioral analysis and assessments - defined in the Sales Training Fast Facts survey as the practice of deploying formal assessments and/or behavioral √ The annual sales quota analyses of sales team candidates or members, both before and post- among survey participants is training. These enablers are deployed by the Best-in-Class 47% more $1.3M for the Best-in-Class, frequently (44% vs. 30%) than Laggards. Identifying which individuals are best compared to $880k for suited to particular roles can align the skills, talents and personalities best Laggards suited for different sales positions and engender a more efficient use of territory assignments, inside/outside sales partnering, and even career path √ The estimated cost of development within the sales organization. Deploying this enabler is further replacing a full-time sales rep is $35,000 complemented by a 49% Best-in-Class use of: (a) processes to assess sales reps against competency requirements to determine specific √ The average annual sales skill/competency gaps (vs. 42% for Industry Average and 25% for Laggard turnover among all firms); and (b) assessment/measurement tools to understand pre-training participants is 14.7%, though sales rep performance metrics (vs. 32% and 13%). Figure 4 demonstrates the "ideal turnover" cited the strong current performance metrics among all organizations deploying was 8.6% for the Best-in- Class, vs. 11.1% for Laggards formal assessments, in comparison to those that do not. Among respondents indicating Sandler Training as their provider, 37% deploy √ The average "fully loaded" behavioral analysis and assessment, with 21% additional ones planning to do annual cost for a Best-in- so in the next year. Class sales rep is $125k, vs. $100k for other companies Figure 4: Real Value Attained by Assessing Sales Rep Skills Competency assessments Non-users 70% 66% 65% 59% 60% Current Percentage 55% 52% 49% 50% 47% 44% 45% 40% 37% 35% 34% 30% Overall sales Customer Reps First-year team quota renewal achieving rep quota attainment rate quota attainment n = 835 Source: Aberdeen Group, April 2011 Cross-Training When asked if “we provide the sales team with extensive cross-training of other company functions, such as marketing, customer service, procurement, etc.,” the sales training Best-in-Class supported this © 2011 Aberdeen Group. Telephone: 617 854 5200 www.aberdeen.com Fax: 617 723 7897
- 5. Optimizing Sales Training: How Best-in-Class Companies and Sandler Training Customers Implement Processes that Succeed Page 5 knowledge management capability 77% more frequently than all other companies (46% vs. 26%). The latter group has not realized the value of cross-training sales with other functions inside the enterprise in order to help them walk in other departments’ shoes, missing out on the benefits, to the sales team, of understanding how other customer-facing colleagues are tasked and motivated. This is particularly important in scenarios when the quality of lead generation by marketing, or client service by customer care, is considered relevant to the sales group’s ability to close, maintain and cross-sell/up-sell their accounts. Cross-training also represents an important opportunity for Sandler Training customers to improve their overall performance, as currently only 23% of them - half the rate of the Sales Training Fast Facts Best-in-Class - are doing so. √ Among companies that use formal sales training, the Customized Coaching average firm has done so for An examination of companies that indicate use of “customized coaching 3.7 years from third-party providers that is specific to our company or even individual √ 79% of their sales staff have sales opportunities” reveals their adoption of four capabilities (Figure 5) that typically participated within are, on average, adopted 25% more often by the Best-in-Class survey the past year respondents than Laggards. In the case of specific selling campaigns or “plays” associated with product launches, new geographic territories or √ Managers' sales training focuses vary among the even individual, massive target accounts in need of highly specific selling maturity classes: the Best-in- strategies, there are significant benefits in developing a unique, targeted Class emphasize selling skills marketing/sales messaging tool belt that is carefully designed to fit the needs 50% more frequently than of that individual pursuit scenario. Thirty-eight percent (38%) of Sandler other companies, but Training customers provide this support to their team, which is a higher products/pricing 41% less rate than both Industry Average and Laggard firms, at 33% in aggregate. often, while “general management training" is the Figure 5: Customized Sales Coaching Deployments Linked to Bes- leading management training in-Class Capabilities content among all respondents Providers of customized coaching Non-users 90% 85% 80% Current Percentage 70% 59% 60% 55% 54% 50% 43% 40% 36% 30% 30% 23% 20% Use of a Dedicated sales Manager- Formal formal sales training staff specific internal methodology resource training certification for sales training n = 835 Source: Aberdeen Group, April 2011 © 2011 Aberdeen Group. Telephone: 617 854 5200 www.aberdeen.com Fax: 617 723 7897
- 6. Optimizing Sales Training: How Best-in-Class Companies and Sandler Training Customers Implement Processes that Succeed Page 6 For newly-hired reps, in particular, this can be especially helpful for those with a steeper learning curve than experienced sellers – as they may need more instruction in account-centric selling basics – and the companies that follow this course report a first-year-rep quota attainment average of 42%, compared to 35% of others. Additional data points that support the use of customized coaching include: • It is used 72% more frequently by the Best-in-Class in comparison to Laggards (43% vs. 25%), though not yet by a majority of top performers • Formal coaching is considered one of the most effective sales training modalities by 29% more of the Best-in-Class than Laggards (31% vs. 24%) • “Strategic account mapping” is taught by 47% of the Best-in-Class, yet only 29% and 22% of Industry Average and Laggard firms • “Creating demand within the prospect or customer for your product/service” resonates with 31% of the top performers, and 12% of Laggards CRM/SFA integration of call planning and selling milestones The integration of call planning, selling milestones or stages into a company’s CRM or SFA instance follows as a logical way to formally identify and capture these different nuances in real-time, so that reps and managers alike can more accurately track the progress of each discrete deal. Figure 6: Annual Growth Associated with Integrating Sale Call Planning Into the CRM Deployment 3.0% CRM integration of call planning Non-users 2.7% 2.0% 1.2% YOY change 1.0% 0.8% 0.7% 0.0% -0.1% -1.0% -0.8% -1.1% -1.2% -1.6% -2.0% -1.8% Annual Average deal Sales Customer Overall sales corporate size or travel renewal attainment revenue contract expense rate of quota value reduction n = 835 Source: Aberdeen Group, April 2011 © 2011 Aberdeen Group. Telephone: 617 854 5200 www.aberdeen.com Fax: 617 723 7897
- 7. Optimizing Sales Training: How Best-in-Class Companies and Sandler Training Customers Implement Processes that Succeed Page 7 Opportunities that remain in identified sales stages too long can thus be more easily flagged for one-off coaching based on sales training content specific to the stage; the Best-in-Class in the sales training study deploy this integration 83% more frequently (55% vs. 30%) than Laggards. Indeed, while sales training is often viewed as a service provided by external organizations with a tried-and-true methodology, or licensable content acquired from them and then re-purposed internally, the use of the CRM system to support better selling extends beyond the integration of call planning milestones. On an annualized basis, adopters of this best practice create far more corporate value than other firms (Figure 6); 45% of Sandler Training customers are aligned with this approach, and thus appreciate the tangible benefits that accrue with integration. Case in Point Consider the case of A.M. Castle, a $1B provider of specialty products, "Our Sandler training allows us services, and supply chain solutions to industry and the public sector. to consistently provide more According to Blain Tiffany, President of the Castle Metals Aerospace differentiation from our division of the company, “We were in business for 115 years before any competitors, through better formal sales training was implemented,” which in his experience meant that sales and service techniques." “no consistent selling methodology, which could be taught, promoted and ~ Blain Tiffany, President, repeated,” had been offered to the wide variety of seasoned and newer Castle Meals Aerospace sales reps. Castle implemented an externally-provided, comprehensive sales training program “boot camp” in 2007, which was considered very effective, but Tiffany acknowledges that with the economic crash that immediately followed, “we weren’t able to execute on the most important element of sales training – reinforcement of the lessons learned” by their 90+ staff who had participated. Yet Castle emerged from the recession with a commitment to being better prepared for the next time the business climate grew tight, and sales training became a central tenet of the company’s desire to “consistently provide more differentiation from our competitors, through better sales and service techniques, that would also allow us,” says Tiffany, “to more effectively sell at a higher level throughout our customer base.” Hence the summer 2010 creation of “Castle Metals Plus,” a bespoke program that combined a refreshed external training methodology with the company’s own identified best practices, complete with Six Sigma-like certification for all levels of sales professionals. This “mash-up” of methodology and industry expertise, explains Tiffany, immediately made a difference, particularly because this time, constant reinforcement of the sales training content – webinars, the vendor’s portal access, team-based conference calls and exercises – is already implemented, and showcases the program’s value to the organization. Tiffany reports that 15% of his division’s current sales pipeline is directly associated with the Castle Metals Plus approach. Additionally, Tiffany said, “We’re getting feedback from our © 2011 Aberdeen Group. Telephone: 617 854 5200 www.aberdeen.com Fax: 617 723 7897
- 8. Optimizing Sales Training: How Best-in-Class Companies and Sandler Training Customers Implement Processes that Succeed Page 8 long-term customers that our solutions and service have improved, which directly impacts the bottom line in terms of better customer retention.” Conclusion Sales training represents an investment that companies continue to retain as a “must have” rather than a “nice to have” – with the Best-in-Class performers planning nearly twice as large a budget increase next year as other companies – as the realization that an educated, focused sales team is tantamount to success, regardless of where in the economic cycle we currently reside. While spending cuts have helped enterprises reduce their expenses, this is the team that can most readily refresh the gap between the bottom and top lines. Providing the sales organization with the processes, technologies and services to do so effectively remains the wisest strategy of all; the particular best practices we’ve analyzed in this research serve as wise steps for any professional selling team to consider. In the case of Sandler Training customers, for the most part, they are investing in these practices and realizing better-than-average performance results. For more information on this or other research topics, please visit www.aberdeen.com. Related Research The Extended Sales Enterprise: Sales Performance Management: Getting Channeling Better Results (March 2011) Everyone on the Same Page; August, Streamlining the Top of the Funnel: How 2010 Inside Sales Teams Source, Qualify and Sales Forecasting: Analytics to the Close Business (February 2011) Rescue!; June 2010 Sales Mobility: Quotas Untethered Optimizing Lead-To-Win: Shrinking the (November 2010) Sales Cycle and Focusing Closers on Sales Training: Deploying Knowledge, Sealing More Deals; May 2010 Process and Technology to Consistently Providing a 360˚ View of the Customer: Hit Quota; September 2010 Better Service - Higher Sales; March Sales and Marketing Alignment: 2010 Collaboration + Cooperation = Peak Sales Intelligence: Preparing for Smarter Performance (September 2010) Selling; February 2010 Author: Peter Ostrow, Research Director, Sales Effectiveness (peter.ostrow@aberdeen.com) For more than two decades, Aberdeen's research has been helping corporations worldwide become Best-in-Class. Having benchmarked the performance of more than 644,000 companies, Aberdeen is uniquely positioned to provide organizations with the facts that matter — the facts that enable companies to get ahead and drive results. That's why our research is relied on by more than 2.5 million readers in over 40 countries, 90% of the Fortune 1,000, and 93% of the Technology 500. As a Harte-Hanks Company, Aberdeen’s research provides insight and analysis to the Harte-Hanks community of local, regional, national and international marketing executives. Combined, we help our customers leverage the power of insight to deliver innovative multichannel marketing programs that drive business-changing results. For additional information, visit Aberdeen http://www.aberdeen.com or call (617) 854-5200, or to learn more about Harte-Hanks, call (800) 456-9748 or go to http://www.harte-hanks.com. This document is the result of primary research performed by Aberdeen Group. Aberdeen Group's methodologies provide for objective fact-based research and represent the best analysis available at the time of publication. Unless otherwise noted, the entire contents of this publication are copyrighted by Aberdeen Group, Inc. and may not be reproduced, distributed, archived, or transmitted in any form or by any means without prior written consent by Aberdeen Group, Inc. (2011a) © 2011 Aberdeen Group. Telephone: 617 854 5200 www.aberdeen.com Fax: 617 723 7897