Recomendados

Recomendados
Más contenido relacionado
La actualidad más candente
La actualidad más candente (20)
Destacado
Destacado (20)
Similar a Turtle Nest Predation Poster
Similar a Turtle Nest Predation Poster (20)
Último
Último (20)
Turtle Nest Predation Poster
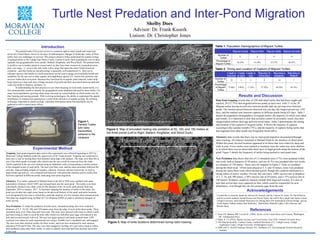
- 1. The painted turtle (Chrysemys picta) is a common sight in many ponds and waterways across the United States--however, because of anthropogenic changes in landscape, many of these turtles face new challenges in survival. This project aimed to better understand the spatial ecology of painted turtles at the Lehigh Gap Nature Center, Carbon County; these populations exist in three separate, but geographically close, ponds: Mallard, Kingfisher, and Wood Duck. The painted turtle is useful to use in studies aimed at conservation, as they have been extensively researched across their vast range—C. picta is the only turtle with a range that spans the entire North American continent—and their behavior and physiology is generally well-understood (1). They act as indicator species--the health of a turtle population can be used to gauge environmental health and suitability for the survival of other aquatic and amphibious species (2). Turtles also perform vital services within their ecosystem. Because they feed heavily on aquatic plant material, turtles help keep waterways clean and clear of large amounts of growth and their movement between land and water also helps to disperse nutrients, (1). In understanding the best practices to use when focusing on local turtle conservation, it is first immeasurably useful to identify the geographical areas inhabited and used by these turtles. For many local populations, growing urban areas encroach on critical habitat on which turtles rely for their hunting and nesting grounds. With evolving technologies, the ability to understand the spatial distribution of creatures has advanced as a niche field referred to as spatial ecology. By utilizing techniques important to spatial ecology, important information about this population can be gathered to aid in conservation efforts. Data from trapping reveals that, of 220 individual turtles that had been caught and marked, 28 (12.73%) had migrated between ponds at least once, with 27 of the 28 Migrant turtles having moved once between ponds, and one moving twice between ponds. The shortest period between observed was one day, the longest period was 1391 days, and the median time between captures in different ponds being 633 days. Table 1 details the population demographics of migrant turtles, the majority of which were adult and female. It is important to note that juveniles cannot be accurately sexed, thus their categorization reflects their age and non-sexed status. Table 2 demonstrates the timing and location of the captures of migrant turtles. It shows the majority of captures occurring in the summer months (75%), and the majority of captures being turtles that had migrated from other ponds into Kingfisher Pond (48%). Telemetry data reveals that there was no inter-pond migration documented through radio tracking. All subjects remained in Mallard Pond for the duration of observation. Within this pond, favored locations appeared to be those that were relatively deep and wide in area. Fewer turtles were tracked to locations were the water was more shallow, or in which there was an observably thick layer of algal growth along the bottom of the pond. Figure 3 details the frequency of turtles being tracked to each pond zone. Nest Predation data shows that two of 12 simulated nests (17%) were predated within one week, both at distances of 50 meters, and one (8.3%) was predated after two weeks at a distance of 150 meters. These sites are mapped in Figure 2. None we predated during the third week. Of the nests placed at 3, 5, and 10 meters, none were predated during the entire three-week observational period, though this could be attributed to a strong influx of snowy weather. Overall, this site had a 100% success rate at distances of 3, 5, 10, and 100 meters, a 50% success rate at 50 meters, and a 75% success rate at 150 meters. Predators caught on cameras include feral dogs and coyotes. It is also of note that several deer were captured on film, which could be responsible for nest disturbance, even though they do not consume eggs from the nest. Turtle Nest Predation and Inter-Pond Migration Shelby Does Advisor: Dr. Frank Kuserk Liaison: Dr. Christopher Jones Table 1. Population Demographics of Migrant Turtles Figure 1. Painted Turtles with radio transmitters adhered to the carapace Introduction Trapping: Inter-pond migration data used in this experiment was collected beginning in 2012 by Moravian College Students under the supervision of Dr. Frank Kuserk. Trapping was conducted at least once a year by baiting three-foot diameter hoop traps with sardines. The traps were then left in one of the three ponds overnight, after which time the nets would be removed from the water. Turtles captured in the net were marked using an alphabetic code corresponding to notches placed in the marginal scutes of each turtle. The nets were then reset, and the same procedure followed the next day. Data including lengths of carapace, plastron, foreclaw, and pre-cloacal tail, as well as approximate age and sex, was compiled and analyzed, with particular attention paid to turtles that had been captured in different ponds, indicating inter-pond migration. Telemetry: Five turtles captured in Mallard Pond in the fall of 2016 were outfitted with radio transmitters (Telonics LB-65 VHF) and released back into the same pond.. The turtles were then individually tracked every other week for the duration of the 16-week study period, from late September, 2016 to January, 2017. To facilitate mapping the location of turtles in the water, the pond was divided into eight zones based on the physical features of the pond, and turtle locations were designated by the zone in which they spent the majority of a five-minute observational period. This data was mapped using ArcMap 10.3 for Desktop (ESRI) in order to determine hotspots of turtle activity. Nest Predation: To study the predation of turtle nests, simulated nesting sites were created at distances of 3, 5, 10, 50, 100, and 150 meters away from the edge of each of the three ponds. These simulated nests were 10cm deep and 5cm wide. The nests were sprayed with water in which a turtle had been living in order to scent the hole, after which two bobwhite quail eggs were placed in the hole and covered loosely with soil. The nest was again sprayed with turtle-scented water. GPS locations were taken for each experimental site using a Trimble Geo7x handheld unit, and mapped. The sites were then checked weekly for three weeks, and were also monitored by trail cameras (Moultrie P150 and P150i). The sites were then mapped in ArcMap 10.3 and color-coded to reflect their predation status after three weeks, in order to identify nests that had been deemed successful in this trial. Experimental Method Figure 2. Map of simulated nesting site predation at 50, 100, and 150 meters at the three ponds (Left to Right: Mallard, Kingfisher, and Wood Duck) I would like to sincerely thank my Advisor Dr. Kuserk, and my Liaison Dr. Jones, Dr. David Bowne and his research students Jennah Krause and Alyssa Taylor, the staff at the Lehigh Gap Nature Center, Lehigh University, and Cardinal Directions for sharing their GIS information and knowledge, and my Turtle Squad: Nathan Jordan, Rob McKinley, Matt Kukla, Mitchell Lapka, Luke Peterson, and Brooke Santy Acknowledgements 1. Ernst CH, Barbour RW, Lovich JE. (1994). Turtles of the United States and Canada. Washington, vvvDC: Smithsonian Press. 2. Dodd, Jr. CJ. (2016). Reptile Ecology and Conservation. New York: Oxford University Press. 3. GIS Data Sourced By: Carbon County, Cardinal Directions LLC, Lehigh County, Lehigh GapNature Center, Lehigh University, Northampton County. 4. ESRI (2017). ArcGIS Desktop: Release 10.3. Redlands, CA: Environmental Systems Research Institute References Results and Discussion Migrant Female Migrant Male Migrant Adults Migrant Juveniles Number of Turtles 11 4 15 13 Percentage of Migrant Turtles 39.29% 14.29% 53.57% 46.43% Table 2. Timing and Location of Capture of Migrant Turtles Caught in June/July Caught in April Caught in Sept Migrating To Wood Duck Migrating to Kingfisher Migrating to Mallard Number of Turtles 22 2 5 8 14 7 Percentage of Migrant Turtles 75.86% 6.90% 17.24% 27.59% 48.28% 24.14% Figure 3. Map of turtle locations determined during radio tracking