SlideShare a Scribd company logo
1 of 2
Download to read offline
Utah

  •	Between	2008	and	2018,	new	jobs	in	Utah	                       Percentage of jobs in 2018 that will require a postsecondary
                                                                   education,	by	state.
    requiring postsecondary education and
    training	will	grow	by	202,000	while	jobs	for	                  DC                                                                       71%
                                                                   ND                                                                    70%

    high school graduates and dropouts will                        MN
                                                                   MA                                                              68%
                                                                                                                                         70%

                                                                   CO                                                           67%
    grow	by	97,000.                                                WA                                                           67%
                                                                   NE                                                        66%
                                                                    UT                                                      66%

  •	Between	2008	and	2018,	Utah	will	create	                       MD
                                                                    HI                                                    65%
                                                                                                                             66%

                                                                    CT
    477,000	job	vacancies	both	from	new	jobs	                         IL
                                                                                                                          65%
                                                                                                                        64%
                                                                    KS                                                  64%
    and	from	job	openings	due	to	retirement.                       VA                                                   64%
                                                                   NH                                                   64%
                                                                    NJ                                                  64%

  •	308,000	of	these	job	vacancies	will	be	                        OR
                                                                   NY                                                63%
                                                                                                                        64%

                                                                   AK                                                63%
    for	those	with	postsecondary	credentials,	                      MI                                            62%
                                                                   WY                                             62%
    126,000	for	high	school	graduates	and	                         MT                                             62%
                                                                    VT                                            62%

    43,000	for	high	school	dropouts.                                 IA
                                                                    SD
                                                                                                                  62%
                                                                                                                  62%
                                                                    WI                                          61%
                                                                    ID                                          61%
  •	Utah	ranks	24th	in	terms	of	the	proportion	                      RI                                         61%
                                                                   CA                                           61%

    of its 2018 jobs that will require a                           AZ
                                                                   NC                                     59%
                                                                                                                61%

                                                                   ME                                     59%
    Bachelor’s	degree,	and	is	31st	in	jobs	for	                     FL                                    59%
                                                                   MO                                     59%
    high	school	dropouts.                                          DE                                     59%
                                                                   GA                                  58%
                                                                   NM                                  58%
                                                                                                                          National Average
  •	66%	of	all	jobs	in	Utah	(1	million	jobs)	                      OH
                                                                    PA
                                                                                                    57%
                                                                                                    57%                   63% of all jobs will
                                                                   OK                               57%
    will require some postsecondary training                        TX                            56%
                                                                                                                          require postsecondary
                                                                    SC                            56%                     education by 2018
    beyond	high	school	in	2018.                                     AL                         55%
                                                                    IN                         55%
                                                                   NV                       54%
                                                                   TN                       54%
  Job vacancies arise from two sources: There are brand new        MS                       54%
  positions created as an occupation grows, and there are pre-     KY                       54%
  existing jobs that people leave behind when they retire, or      AR                 52%

  move into other occupations.                                      LA             51%
                                                                   WV        49%
                                                                       45%         50%          55%             60%         65%           70%


      utah’s raNk iN jobs forecasteD for 2018,                         By	2018,	66% of jobs in Utah will
                by eDucatioN level.
   education level                   2018 jobs        rank
                                                                       require	postsecondary	education.
   High school dropouts               148,000          31
   High school graduates              436,000          44              This is 3 percentage points above the
   Some	college,	no	degree            440,000          14              national average of 63%.
   Associate’s	degree                 173,000           2
   Bachelor’s	degree	                 319,000          24              Utah ranks 8th in postsecondary
   Graduate degree                    131,000          32
                                                                       education	intensity	for	2018.


The Georgetown University Center on Education and the Workforce   99
utah

                                                                                  1,200,000
   chaNge iN jobs by eDucatioN level: 2008 aND 2018.
                                                                                                                                                           1,063,000
 education level               2008 jobs      2018 jobs    Difference             1,000,000


 High school dropouts           124,000       148,000         24,000               800,000                         861,000

 High school graduates          363,000       436,000         73,000
                                                                                   600,000
 Postsecondary                  861,000       1,063,000      202,000
                                                                                   400,000                                                       463,000
                                                                                                        363,000
                                                                                   200,000
                                                          Postsecondary
                                                          High school graduates               124,000                                148,000
                                                          High school dropouts           0
                                                                                                        2008                                      2018


                   where the jobs will be iN 2018, by occupatioN aND eDucatioN level	(in	thousands	of	jobs)*
                                                          high school       high school        some        associate’s       bachelor’s        graduate
 occupatioNs                                               dropouts         graduates         college       degree            degree            degree         total
                   Management                                   3                   13           23                8            24                12             84
 managerial
 and               Business	operations	specialty                1                    7            9                5            13                 5             39
 professional      Financial specialists                        0                    4            7                5            15                 7             39
 office
                   Legal                                        0                    1            2                0             1                 5             10
                   Computer and mathematical
                                                                1                    4           12                5            21                 6             49
                   science
                   Architects and technicians                   0                    0            2                1             2                 1             7
 stem
                   Engineers and technicians                    0                    2            4                2            11                 6             25
                   Life and physical scientists                 0                    1            2                1             6                 4             14
                   Social scientists                            -                    -            1                0             2                 3             6

 community         Community and social services                0                    3            5                2            10                 9             28
 services          Arts,	design,	entertainment,	
 and arts                                                       0                    3            8                3            13                 3             30
                   sports,	and	media
 education         Education                                    1                    7           14                7            43                28             99
                   Healthcare practitioners                     0                    3            8               19            21                20             72
 healthcare
                   Healthcare support                           2                   11           14                7             5                 1             40
                   Food preparation and serving                25                   41           29                6             9                 2            113

 food and          Building	and	grounds	cleaning	
                                                               16                   21           12                4             4                 1             58
 personal          and maintenance
 services          Personal care                                2                   12           12                4             6                 1             37
                   Protective services                          1                    6           10                4             5                 1             27

 sales and         Sales                                       13                   57           60               20            40                 8            198
 office support    Office and administrative support           11                   82          110               36            42                 5            288
                   Farming,	fishing	and	forestry                1                    1            1                0             0                 0             4
                   Construction and extraction                 25                   42           25                7             4                 1            104
                   Installation,	maintenance,	and	
 blue collar                                                    7                   25           20               10             4                 0             66
                   equipment repair
                   Production                                  20                   48           27                7             7                 1            110
                   Transportation and material moving          18                   42           25                7             7                 1            100
 total**                                                      148                  436          440               173           319              131           1,647

*Zero does not necessarily mean no jobs. Since jobs are rounded to the nearest thousand, zero means less than 500 jobs.
**Total jobs are a snapshot of the economy that shows where jobs are located by education type. They differ from job vacancies because total
jobs are filled by people currently working in these positions who may not be leaving in the short-term to create a job opening.


                                                                             100               Projections of Jobs and Education Requirements Through 2018

More Related Content

More from State of Utah, Salt Lake City

Health Data Transparency: Utah’s All Payer Claims Database
Health Data Transparency: Utah’s All Payer Claims DatabaseHealth Data Transparency: Utah’s All Payer Claims Database
Health Data Transparency: Utah’s All Payer Claims DatabaseState of Utah, Salt Lake City
 
Health Disparities by Utah Legislative District 2019
Health Disparities by Utah Legislative District 2019Health Disparities by Utah Legislative District 2019
Health Disparities by Utah Legislative District 2019State of Utah, Salt Lake City
 
The Utah Geological Survey provides timely scientific information about Utah’...
The Utah Geological Survey provides timely scientific information about Utah’...The Utah Geological Survey provides timely scientific information about Utah’...
The Utah Geological Survey provides timely scientific information about Utah’...State of Utah, Salt Lake City
 
Utah Division of Wildlife Resources Presentation to 2019 Legislature
Utah Division of Wildlife Resources Presentation to 2019 LegislatureUtah Division of Wildlife Resources Presentation to 2019 Legislature
Utah Division of Wildlife Resources Presentation to 2019 LegislatureState of Utah, Salt Lake City
 
Utah Division of Aeronautics Annual Needs and Accomplishments
Utah Division of Aeronautics Annual Needs and AccomplishmentsUtah Division of Aeronautics Annual Needs and Accomplishments
Utah Division of Aeronautics Annual Needs and AccomplishmentsState of Utah, Salt Lake City
 
Fourth Quarter FY2018 Quarterly Report from Utah DCFS
Fourth Quarter FY2018 Quarterly Report from Utah DCFSFourth Quarter FY2018 Quarterly Report from Utah DCFS
Fourth Quarter FY2018 Quarterly Report from Utah DCFSState of Utah, Salt Lake City
 
Transportation Policy and Funding: Historical and Emerging Trends
Transportation Policy and Funding: Historical and Emerging TrendsTransportation Policy and Funding: Historical and Emerging Trends
Transportation Policy and Funding: Historical and Emerging TrendsState of Utah, Salt Lake City
 

More from State of Utah, Salt Lake City (20)

Utah Veterinary Diagnostic Laboratory
Utah Veterinary Diagnostic LaboratoryUtah Veterinary Diagnostic Laboratory
Utah Veterinary Diagnostic Laboratory
 
Health Data Transparency: Utah’s All Payer Claims Database
Health Data Transparency: Utah’s All Payer Claims DatabaseHealth Data Transparency: Utah’s All Payer Claims Database
Health Data Transparency: Utah’s All Payer Claims Database
 
Utah Division of Juvenile and Justice Services
Utah Division of Juvenile and Justice ServicesUtah Division of Juvenile and Justice Services
Utah Division of Juvenile and Justice Services
 
Health Disparities by Utah Legislative District 2019
Health Disparities by Utah Legislative District 2019Health Disparities by Utah Legislative District 2019
Health Disparities by Utah Legislative District 2019
 
Localscapes
LocalscapesLocalscapes
Localscapes
 
Status of Translocated Tortoises in Southwest Utah
Status of Translocated Tortoises in Southwest UtahStatus of Translocated Tortoises in Southwest Utah
Status of Translocated Tortoises in Southwest Utah
 
The Logan River Observatory
The Logan River ObservatoryThe Logan River Observatory
The Logan River Observatory
 
Utah Strategic Workforce Presentation
Utah Strategic Workforce PresentationUtah Strategic Workforce Presentation
Utah Strategic Workforce Presentation
 
The Utah Geological Survey provides timely scientific information about Utah’...
The Utah Geological Survey provides timely scientific information about Utah’...The Utah Geological Survey provides timely scientific information about Utah’...
The Utah Geological Survey provides timely scientific information about Utah’...
 
Utah Forestry, Fire and State Lands 2019
Utah Forestry, Fire and State Lands 2019Utah Forestry, Fire and State Lands 2019
Utah Forestry, Fire and State Lands 2019
 
Utah Division of Wildlife Resources Presentation to 2019 Legislature
Utah Division of Wildlife Resources Presentation to 2019 LegislatureUtah Division of Wildlife Resources Presentation to 2019 Legislature
Utah Division of Wildlife Resources Presentation to 2019 Legislature
 
UDOT Presentation to 2019 Legislature
UDOT Presentation to 2019 LegislatureUDOT Presentation to 2019 Legislature
UDOT Presentation to 2019 Legislature
 
Utah System of Technical Colleges
Utah System of Technical CollegesUtah System of Technical Colleges
Utah System of Technical Colleges
 
Public Water System Identification in Utah
Public Water System Identification in UtahPublic Water System Identification in Utah
Public Water System Identification in Utah
 
State of Utah Suicide Prevention
State of Utah Suicide PreventionState of Utah Suicide Prevention
State of Utah Suicide Prevention
 
Utah Division of Aeronautics Annual Needs and Accomplishments
Utah Division of Aeronautics Annual Needs and AccomplishmentsUtah Division of Aeronautics Annual Needs and Accomplishments
Utah Division of Aeronautics Annual Needs and Accomplishments
 
Fourth Quarter FY2018 Quarterly Report from Utah DCFS
Fourth Quarter FY2018 Quarterly Report from Utah DCFSFourth Quarter FY2018 Quarterly Report from Utah DCFS
Fourth Quarter FY2018 Quarterly Report from Utah DCFS
 
Update on FirstNet in Utah
Update on FirstNet in UtahUpdate on FirstNet in Utah
Update on FirstNet in Utah
 
Energy Incentives in Utah - 2018 Audit
Energy Incentives in Utah - 2018 AuditEnergy Incentives in Utah - 2018 Audit
Energy Incentives in Utah - 2018 Audit
 
Transportation Policy and Funding: Historical and Emerging Trends
Transportation Policy and Funding: Historical and Emerging TrendsTransportation Policy and Funding: Historical and Emerging Trends
Transportation Policy and Funding: Historical and Emerging Trends
 

Projections of Jobs_through 2018

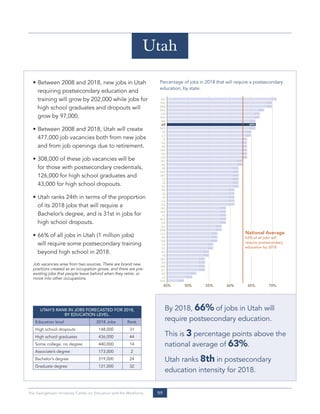
  • 1. Utah • Between 2008 and 2018, new jobs in Utah Percentage of jobs in 2018 that will require a postsecondary education, by state. requiring postsecondary education and training will grow by 202,000 while jobs for DC 71% ND 70% high school graduates and dropouts will MN MA 68% 70% CO 67% grow by 97,000. WA 67% NE 66% UT 66% • Between 2008 and 2018, Utah will create MD HI 65% 66% CT 477,000 job vacancies both from new jobs IL 65% 64% KS 64% and from job openings due to retirement. VA 64% NH 64% NJ 64% • 308,000 of these job vacancies will be OR NY 63% 64% AK 63% for those with postsecondary credentials, MI 62% WY 62% 126,000 for high school graduates and MT 62% VT 62% 43,000 for high school dropouts. IA SD 62% 62% WI 61% ID 61% • Utah ranks 24th in terms of the proportion RI 61% CA 61% of its 2018 jobs that will require a AZ NC 59% 61% ME 59% Bachelor’s degree, and is 31st in jobs for FL 59% MO 59% high school dropouts. DE 59% GA 58% NM 58% National Average • 66% of all jobs in Utah (1 million jobs) OH PA 57% 57% 63% of all jobs will OK 57% will require some postsecondary training TX 56% require postsecondary SC 56% education by 2018 beyond high school in 2018. AL 55% IN 55% NV 54% TN 54% Job vacancies arise from two sources: There are brand new MS 54% positions created as an occupation grows, and there are pre- KY 54% existing jobs that people leave behind when they retire, or AR 52% move into other occupations. LA 51% WV 49% 45% 50% 55% 60% 65% 70% utah’s raNk iN jobs forecasteD for 2018, By 2018, 66% of jobs in Utah will by eDucatioN level. education level 2018 jobs rank require postsecondary education. High school dropouts 148,000 31 High school graduates 436,000 44 This is 3 percentage points above the Some college, no degree 440,000 14 national average of 63%. Associate’s degree 173,000 2 Bachelor’s degree 319,000 24 Utah ranks 8th in postsecondary Graduate degree 131,000 32 education intensity for 2018. The Georgetown University Center on Education and the Workforce 99
  • 2. utah 1,200,000 chaNge iN jobs by eDucatioN level: 2008 aND 2018. 1,063,000 education level 2008 jobs 2018 jobs Difference 1,000,000 High school dropouts 124,000 148,000 24,000 800,000 861,000 High school graduates 363,000 436,000 73,000 600,000 Postsecondary 861,000 1,063,000 202,000 400,000 463,000 363,000 200,000 Postsecondary High school graduates 124,000 148,000 High school dropouts 0 2008 2018 where the jobs will be iN 2018, by occupatioN aND eDucatioN level (in thousands of jobs)* high school high school some associate’s bachelor’s graduate occupatioNs dropouts graduates college degree degree degree total Management 3 13 23 8 24 12 84 managerial and Business operations specialty 1 7 9 5 13 5 39 professional Financial specialists 0 4 7 5 15 7 39 office Legal 0 1 2 0 1 5 10 Computer and mathematical 1 4 12 5 21 6 49 science Architects and technicians 0 0 2 1 2 1 7 stem Engineers and technicians 0 2 4 2 11 6 25 Life and physical scientists 0 1 2 1 6 4 14 Social scientists - - 1 0 2 3 6 community Community and social services 0 3 5 2 10 9 28 services Arts, design, entertainment, and arts 0 3 8 3 13 3 30 sports, and media education Education 1 7 14 7 43 28 99 Healthcare practitioners 0 3 8 19 21 20 72 healthcare Healthcare support 2 11 14 7 5 1 40 Food preparation and serving 25 41 29 6 9 2 113 food and Building and grounds cleaning 16 21 12 4 4 1 58 personal and maintenance services Personal care 2 12 12 4 6 1 37 Protective services 1 6 10 4 5 1 27 sales and Sales 13 57 60 20 40 8 198 office support Office and administrative support 11 82 110 36 42 5 288 Farming, fishing and forestry 1 1 1 0 0 0 4 Construction and extraction 25 42 25 7 4 1 104 Installation, maintenance, and blue collar 7 25 20 10 4 0 66 equipment repair Production 20 48 27 7 7 1 110 Transportation and material moving 18 42 25 7 7 1 100 total** 148 436 440 173 319 131 1,647 *Zero does not necessarily mean no jobs. Since jobs are rounded to the nearest thousand, zero means less than 500 jobs. **Total jobs are a snapshot of the economy that shows where jobs are located by education type. They differ from job vacancies because total jobs are filled by people currently working in these positions who may not be leaving in the short-term to create a job opening. 100 Projections of Jobs and Education Requirements Through 2018