
Recomendados
Recomendados
Más contenido relacionado
Destacado
Destacado (20)
System 1 Tips Tricks Vol 3 Issue 5 May2012 Quick Plots
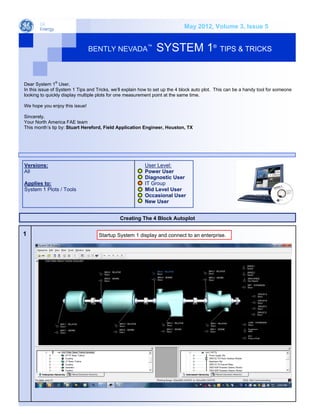
- 1. May 2012, Volume 3, Issue 5 BENTLY NEVADA™ SYSTEM 1® TIPS & TRICKS Dear System 1® User, In this issue of System 1 Tips and Tricks, we’ll explain how to set up the 4 block auto plot. This can be a handy tool for someone looking to quickly display multiple plots for one measurement point at the same time. We hope you enjoy this issue! Sincerely, Your North America FAE team This month’s tip by: Stuart Hereford, Field Application Engineer, Houston, TX Versions: User Level: All Power User Diagnostic User Applies to: IT Group System 1 Plots / Tools Mid Level User Occasional User New User Creating The 4 Block Autoplot 1 Startup System 1 display and connect to an enterprise.
- 2. 2 At the top of the screen, select Tools, then Options. 3 A new “Options” window will appear. Select the “Quick Plot Configuration” tab.
- 3. 4 Notice how the gray box on the right side of the screen is blank. This means that quick plots is not configured. Also notice how the quick plots icon on the main display screen (in yellow box) is grayed out (another indicator that quick plots has not been configured). 5 Select a plot type to be added to the quick plot group and left click on the arrow pointing to the right to add the plot type to the quick plot group.
- 4. 5 A 6 Select other desired plot types and add to the quick plot configuration. You may select up to 4 total plots.
- 5. 7 If the order of the plots needs to be changed, simply left click (hold down) on the plot type you want to move and drag the plot to the desired location. Left click and drag 8 After you have selected the plot types and position, click “OK”.
- 6. 9 Notice that the quick plot icon is now usable. 1 Highlight a point on your display that you wish to display the plots for and left click on the quick plot icon. 0
- 7. 1 The plots that you have just configured will now appear for the point selected at the plotting range shown. 1 Do you remember how to change the plot range in plots and in the plot defaults? If not, reference System 1 Tips & Tricks Vol 2, Issue 7 (July 2011).
- 8. DID YOU KNOW? The diagnostic power of System 1® can now be complemented and enhanced by the predictive analytics of SmartSignal. SmartSignal software identifies abnormal behavior by intelligently detecting statistically significant changes in the actual versus predicted behavior of complex data interrelationships, then provides exception-based notifications of developing problems to users. This automated approach provides “foresight” – the earliest warning of impending failures, so that you can apply the “insight” afforded by your System 1® diagnostic platform in a timely and effective manner. Click here to get more information on the SmartSignal or Better yet, register below for the SmartSignal Webinar on 18 July!! Bently Nevada Technical Support: bntechsupport@ge.com 775-215-1818 Bently Nevada website: http://www.ge-mcs.com/en/bently-nevada.html System 1 Blog (You’ll need to join the forum): http://supportcentral.ge.com/blog/blogs_frame.asp?prod_id=20858