2013 State Of The Vending Industry Report - VendingMarketWatch.com - Automatic Merchadiser
•
2 recomendaciones•2,319 vistas

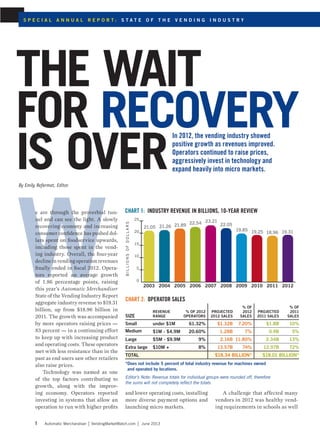
In 2012, the vending industry showed positive growth as revenues improved. operators continued to raise prices, aggressively invest in technology and expand heavily into micro markets.

Recomendados
Recomendados
Más contenido relacionado
La actualidad más candente
La actualidad más candente (20)
Similar a 2013 State Of The Vending Industry Report - VendingMarketWatch.com - Automatic Merchadiser
Similar a 2013 State Of The Vending Industry Report - VendingMarketWatch.com - Automatic Merchadiser (20)
Más de Steven Duque
Más de Steven Duque (20)
Último
Último (20)
2013 State Of The Vending Industry Report - VendingMarketWatch.com - Automatic Merchadiser
- 1. W e are through the proverbial tun- nel and can see the light. A slowly recovering economy and increasing consumer confidence has pushed dol- lars spent on foodservice upwards, including those spent in the vend- ing industry. Overall, the four-year decline in vending operation revenues finally ended in fiscal 2012. Opera- tors reported an average growth of 1.86 percentage points, raising this year’s Automatic Merchandiser State of the Vending Industry Report aggregate industry revenue to $19.31 billion, up from $18.96 billion in 2011. The growth was accompanied by more operators raising prices — 83 percent — in a continuing effort to keep up with increasing product and operating costs. These operators met with less resistance than in the past as end users saw other retailers also raise prices. Technology was named as one of the top factors contributing to growth, along with the improv- ing economy. Operators reported investing in systems that allow an operation to run with higher profits and lower operating costs, installing more diverse payment options and launching micro markets. A challenge that affected many vendors in 2012 was healthy vend- ing requirements in schools as well BILLIONSOFDOLLARS 23.21 19.31 21.05 21.26 21.89 22.54 22.05 19.85 19.25 18.96 0 5 10 15 20 25 2012201120102009200820072006200520042003 Chart 1: industry revenue in billions, 10-year review The wait for recovery is over In 2012, the vending industry showed positive growth as revenues improved. Operators continued to raise prices, aggressively invest in technology and expand heavily into micro markets. By Emily Refermat, Editor Chart 2: Operator sales Size Revenue range % of 2012 operators Projected 2012 sales % of 2012 sales Projected 2011 sales % of 2011 sales Small under $1M 61.32% $1.32B 7.20% $1.8B 10% Medium $1M - $4.9M 20.60% 1.28B 7% 0.9B 5% Large $5M - $9.9M 9% 2.16B 11.80% 2.34B 13% Extra large $10M + 8% 13.57B 74% 12.97B 72% Total $18.34 BILLION* $18.01 BILLION* *Does not include 5 percent of total industry revenue for machines owned and operated by locations. Editor’s Note: Revenue totals for individual groups were rounded off, therefore the sums will not completely reflect the totals. 1 Automatic Merchandiser VendingMarketWatch.com June 2013 S p e c i a l a n n u a l r e p o r t : s t a t e o f t h e v e n d i n g i n d u s t r y
- 2. as other vending locations. Opera- tors struggled with legislation that restricted the potential products sold and/or that placed taxes on traditional vending fare. They also reported concern about future leg- islation. Both the Food and Drug Administration’s final rule regard- ing calorie disclosure required by Obamacare and the U.S. Depart- ment of Agriculture proposed rule regarding the items allowed in school vending machines could severely constrict operator revenue and profits. Compared to retail sales growth, vending revenue continued to lag in 2012. According to Technomic, a food research firm, restaurants and bars showed revenue growth of 4.5 percent for 2012. Medium operations increase Besides 2012 being a growth year in terms of revenue, many smaller opera- tors were also able to grow. There was an increase in medium operations, defined as those with $1 million to $4.9 million in annual sales, as seen in chart 2. Locations hiring more employees and consumer confidence as well as embracing a new busi- Chart 3: Machines by location, 4-year review ● Manufacturing ● Offices ● Hotels/motels ● Restaurants, bars, clubs ● Retail sites ● Hospitals, nursing homes ● Universities, colleges ● Elementary, middle, high schools ● Military bases ● Correctional facilities ● Other 8.6% 7.3% 6.6% 0.7% 2.2% 2.5% 2.9% 11.5% 8.8% 9% 5.8% 5% 8.3% 8.2% 2.7% 5.2% 1.1% 5% 20.1% 22.4% 22.5% 33.2% 9.1% 0.4% 0.9% 8.8% 5.9% 4.7% 7% 1.3% 6.8% 28.5% 26.8% 31.3% 8.8% 22.2% 4.1%1.4% 2.5% 5.3% 1% 1.1% 8.55% 13.7% 20112009 2010 2012 12.7% 27.9% 40.8% 34.1% 21.8% 16.2% 46.5% 53.5% 56.3% 55.9% 12.4% 21.8% No change Reduced Added Warehouse Repair Delivery Sales 14.3 28.6% 23.7% 14.3% 11.3% 13.3% 22% 61% 28.6% 45% 50% 15% 10% 11.3% 16.7% 23.7% Warehouse Repair Delivery Sales N/A 50% 30.4% 0% 15.4% 25% 33.3% 69.6% 50% 30.8% 38.9% 26.9% 11.1% 26.9% 25% 41.2% Chart 4A: STAFFING CHANGES, 4-YEAR REVIEW ● 2009 ● 2010 ● 2011 ● 2012 Chart 4C: AREAS WHERE STAFF WAS REDUCED, 4-YEAR REVIEW ● 2009 ● 2010 ● 2011 ● 2012 Chart 4B: AREAS WHERE STAFF WAS ADDED, 4-YEAR REVIEW ● 2009 ● 2010 ● 2011 ● 2012 4.7% 6.9% 8.6% 14.1% 16.9% 8.6% 5.9% 3.6% 3.9% Divested Acquired Both acquired and divested Neither acquired nor divested 75.3% 72.7% 78.9% Chart 5: ACQUIRED OR DIVESTED BUSINESS, 3-YEAR REVIEW ● 2010 ● 2011 ● 2012 Chart 6: STRATEGIES FOR HANDLING HIGHER COSTS, 3-YEAR REVIEW Product 2010 2011 2012* Raised prices 18.24% 18.30% 83.10% Absorbed extra cost 15.2 14.18 62.3 Reduced service frequency 11.32 10.31 42.1 Rearranged routes 10.64 11.86 46.2 Eliminated unprofitable account 8.95 7.99 47.3 Lowered commissions 6.76 6.96 33.1 Postponed parts or equipment buys 5.74 6.96 19.7 Rearranged job responsibilities 4.9 4.12 22.4 Reduced company travel 4.56 2.84 12.8 Reduced equipment in accounts 4.39 4.64 22.4 Adjusted compensation/benefits 3.72 3.35 7.7 Reduced product variety 3.04 3.35 10.7 Postponed equipment repairs 1.69 3.09 4.9 Switched to using more cost-efficient vehicles 0.84 2.06 14.5 * Includes multiple mentions 2 Automatic Merchandiser VendingMarketWatch.com June 2013 S p e c i a l a n n u a l r e p o r t : s t a t e o f t h e v e n d i n g i n d u s t r y
- 3. ness model account for much of this change. The most successful opera- tors reported analyzing their business more closely to focus on profitability and limiting waste better than they did in the past, which often required technology implementation. There was a decline in the num- ber of extra-large operators in 2012, as defined by revenue. Declining same store sales, loss of accounts and location downsizing were the most reported reasons for reduced sales which also led to staff reductions. More than half of operators made no staffing changes in 2012, however. Of the owners that did make staff changes, more increased their deliv- ery staff than other positions, followed by nearly equal increases in sales and repair staff, see chart 4B. Reductions in staff were also overwhelmingly in delivery personnel and usually brought on by dropping revenues. Operators used a variety of strate- gies to handle rising costs in 2012 and were asked this year to report all steps taken, therefore the total in chart 6 will not equal 100 percent. However, the top ranking strategy was raising prices mostly in the candy, snack and confection category, shown in chart 7, which continues a four year trend. Operators were also likely to increase prices in cold drinks, OCS and vended food. Many operators reported they were more comfortable raising prices in 2012 due to other retail segments also increasing prices. Theneedforallfoodretailerstoraise their prices is supported by a forecast from the National Restaurant Asso- ciation, which tracks data for full and quick-serve restaurants, bars as well as cafeterias. The NRA reports that wholesale food prices continued to rise in2012,by2percent,makingtheaggre- gateincreaseforthelastsixyears30per- cent, minus a 3.8 percent drop in 2009. While more than half of operators reported absorbing extra costs, slightly moreoperatorschosetoremoveunprof- itableaccountscomparedto2011,where rearrangingaccountswasthethirdmost used strategy reported, shown in chart 6.Thenumberofoperatorspostponing partorequipmentbuysin2012dropped slightly,decreasingfromthesixthmost usedstrategy,totheeighth.Thisissup- ported by operators claiming 2012 into 2013iswhentheyareinvestingintech- nology and new growth opportunities. Interestingly, vendors adjusting their product mix to reduce service fre- quency dropped last year to a level seen priorto2010,indicatedinchart8A.For those that did reduce their mix, the candy, snack and confection category saw the greatest contraction, although again, the 2012 percentages in chart 8B willnotdirectlyrelatetotheprioryear’s because operators were asked to choose all the segments that applied. Another way vendors reacted in 2012 was to expand into new services. Fiscal 2012 witnessed the largest per- cent increase for this in the last five years. One new service reported was micro markets, which was broken out as its own segment for the first time in 2012 and showed more than half the growth, see chart 9B. More operators also began offering water service in 2012 than in 2011 as a way to com- pete with both other operators and water companies approaching loca- tions with add-on vending. Operators also reported it as a way to increase same site sales and replace a declining bottled water business. While office coffee service has been a big area of expansion, 2012 saw a drop in operators adding OCS, indicating the market is saturated. Most vending oper- ators now offer OCS to locations. How- ever, while the number adding OCS has declined, operators report that the revenue for OCS is increasing, covered in chart 12. The real surprise in 2012 was the number of operators reentering the bulk vending business. Operators reported investing in bulk for a num- ber of reasons. Some did it to eliminate these machines from existing locations. Chart 7: Segments where prices were raised, 3-year review Product 2010 2011 2012* Candy/snacks/ confections 28.07%28.03%87.60% OCS 12.57 11.72 46.3 Ice cream 7.02 6.28 20.8 Sundries/ toiletries 1.46 2.09 6.8 Milk 5.56 7.53 19.6 Vended food 9.65 10.46 42.9 Bulk vending 0.88 0 1.9 Hot beverages 7.6 5.44 26.4 Condoms 0.29 1.26 0.3 Bottled water (not single-serve) 3.22 2.09 8.7 Music 0.2 0 0.3 Cooperative service vending 0.58 0 0.9 Cigarettes 3.22 1.26 3.1 Cold drinks 17.54 21.76 52.5 Manual foodservice 2.05 1.26 6.2 Other N/A N/A 2.5 * Includes multiple mentions No Yes 48.8% 51.8% 37.8% 51.2% 48.2% 62.2% Chart 8A: ADJUSTED PRODUCT MIX TO REDUCE DELIVERIES, 2-Year Review ● 2010 ● 2011 ● 2012 Chart 8B: For those who reduced product variety, reduced in the following areas, 3-year review: Product 2010 2011 2012 OCS 32.65% 33.80% 78.20% Ice cream 3.06 8.45 13.7 Vended food 5.1 2.82 11.3 Hot beverage 9.18 9.86 19.4 Cold drinks 2.04 1.41 4 Sundries/ toiletries 2.04 0 1.6 Bottled water (not single serve) 2.04 0 3.2 Milk 2.04 0 1.6 Other N/A N/A 2.4 * Includes multiple mentions 3 Automatic Merchandiser VendingMarketWatch.com June 2013 S p e c i a l a n n u a l r e p o r t : s t a t e o f t h e v e n d i n g i n d u s t r y
- 4. Other Micro markets Retail store Drop shipping via courier Wholesale distribution/non vending locations Manual foodservice Catering Bulk Water service OCS 16.1% 21.4% 14.7% 3.6% 0% 5.5% 7.1% 6.5% N/A N/A 35.5% 57.8% 32.1% 10.1% 22.6% 14.3% 16.5% 6.4% 3.6% 4.6% 3.7% 0% 6.5% 0% 4.6% 12.9% 8.3% 17.9% 0% 0% Others used bulk as an add-on service that produces more revenue especially at a location the provider already vis- its. Many reported it was just a way to utilize every potential opportunity for revenue. Technology shows huge increases Operators embraced payment tech- nology at an accelerated rate in 2012, as more vendors recognized the changing need of the consumer. The number of bill recyclers increased slightly, following a 4-year upward trend, as indicated in chart 10A. Operators continued to give recy- clers mixed reviews. Some consider them a more affordable option than cashless readers, while others think they increase service calls. The other payment technology added in 2012 was cashless readers, which jumped 3 percent. The projected number of machines that accept a cashless form of payment is nearly 375,000. Most systems are ‘open’ compared to a closed system which only accepts a system specific prepaid card. The number of closed systems has been declining over the last few years, especially among vending operations outside of prisons and schools. The increase in cashless payment acceptance is a result of higher prod- uct price points, increased accep- tance of debit and credit in retail for smaller purchases, Gen X and Y/ millennials joining the workforce to become vending consumers and the growing research about how the sys- tems increase sales. One of the larger cashless suppliers recently reported that after 12 months of having a cash- less reader installed, sales per vend- ing machine increased an average of 28 percent, including a 17 percent increase in cash sales. Transaction and connectivity fees continue to be the biggest hurdle for cashless, although a small percent of operators are experimenting with charging between 10 and 25 cents for purchases made with a credit or debit card as opposed to cash. Oper- ators reported mixed reviews from locations with this two-tier pricing. Some receive resistance, while oth- Chart 9B: If yes, which services? ● 2010 ● 2011 ● 2012 20% 28.9% 31.1% 80% 71.1% 68.9% No Yes Chart 9A: Expanded into new services, 3-year review ● 2010 ● 2011 ● 2012 Chart 10a: technology upgrades, 4-year comparison* 2009 2010 2011 2012 Installed bill recyclers 17.5% 26% 29% 29.6% Added remote monitoring (wireless) 10 12 14 22 % of machine equipped with remote monitoring 1.65 % of machines equipped with cashless readers* 2.28 3.5 4 7 Added video screens 0 0 0.1 1.1 % of machine equipped with video screens 0.2 Added micro markets 0 2 5 15.8 % of operation that is micro markets 1.8 Chart 10B: Cashless projections, 3-year review 2010 2011 2012 Projected with cashless 189,842 199,955 374,472 Closed cashless 32,270 (17%) 31,993 (16%) 44,936 (12%) Open cashless 157,554 167,962 329,536 *Includes closed cashless systems Total machine base: 5,424,070 for 2010; 5,056,000 for 2011; 5,349,605 for 2012 4 Automatic Merchandiser VendingMarketWatch.com June 2013 S p e c i a l a n n u a l r e p o r t : s t a t e o f t h e v e n d i n g i n d u s t r y
- 5. ers have no comments. The higher price is commonly the posted price and a sign is added that details the amount discounted for using cash. Remote machine monitoring (RMM), sometimes referred to a machine being wireless, increased 8 percent in 2012, see chart 10A. While this increase represents machines with RMM capabilities, operators reported adding RMM even if they just added the hardware, but weren’t yet using the wireless monitoring capabilities to deliver greater operating effi- ciencies. Based on oper- ator reports, there are at least 80,000 machines with RMM capability. Technology addi- tions continued in 2012 with more touchscreen vending machines and video screen retrofits. Operators added this technology as more options became available, also indicated in chart 10A. Many examples introduced in 2012, such as small retrofit vending screens, allowed operators to purchase one piece of hardware, but get the benefits of video screens and cashless payment acceptance — making the investment even more attractive. Many operators reported liking that these video screens could also be used to display nutritional information when the calorie disclosure rule is finally published by the FDA. Micro markets spike The addition of micro markets jumped 10 percent in 2012, according to vend- ing operators, marking it as the most significant change in the vending business strategy. While there is an estimated 2,800 micro markets in ser- vice, operators reported 1.8 percent of their business drew revenue from this segment in 2012. That’s the equiva- lent to almost 90,000 machines. The popularity of micro mar- kets are attributed to many things, including allowing more products to be displayed in the same area and increasing variety. Because micro market kiosks use cashless payments, operators can use penny increments on product prices, as well as collect sales tax at the end of the transaction, similar to other retail establishments. Micro markets also drive up all sales, including those of fresh food — typi- cally 30 percent of market sales — and draw more customers to use the sys- tem than use the traditional vending bank. Some operators reported losing long-time locations to micro markets if they didn’t embrace the technology. The largest challenge presented by micro markets is the new merchandis- ing requirement since it needs to be managed more like a retail store than a vending machine. Also, in 2012 micro market data was not able to integrate with existing vending management systems (VMS), making it difficult to accurately track and manage all aspects of the business using one sys- tem. Recently however, micro market Chart 11: Share of sales by category, 4-year review Chart 12: Projected sales by category, 4-year review Percent revenue changes 2009 2010 2011 2012 2009 2010 2011 2012 Cold beverages $5.87 $5.97 $5.88 $5.97 -8.50% 1.58% -1.50% 1.58% Manual foodser- vice 5.437 5.39 5.384 3.33 -17.8 -0.08 -0.1 -38.15 Candy/snacks/ confections 4.167 4.04 3.977 4.13 -0.05 -3 -1.55 3.85 OCS 1.043 1.212 1.213 1.78 -3.4 16.2 0.01 46.74 Vend food 1.012 0.866 0.815 1.12 -20.9 -14.4 -5.8 37.42 Micro Markets N/A N/A N/A 0.35 Hot beverages 0.813 0.75 0.7 0.73 -16.1 -7.7 -1.3 4.29 Milk 0.337 0.288 0.246 0.4 -3.7 -4.9 -14.5 62.60 Ice cream 0.317 0.346 0.303 0.48 2.2 9.14 -12.4 58.42 Cigarettes 0.14 0.115 0.076 0.27 7.7 -17.8 -33.9 255.26 Other 0.713 0.421 0.379 0.75 -15.1 -40.9 -10 97.89 21% 29.6% 27.4% 5.2% 1.6% 5.1% 4.1% 3.6% 0.7% 1.7% 4.5% 3.9% 1.8% 2.2% 0.6% 1.5% 2009 2010 2011 2012 *Includes cooperative service vending, music, games, bulk vending, bottled water, sundries, toiletries, condoms, kiddie rides, and other foodservice revenue. 21% 31% 28% 6.3% 4.3% 3.7% 31% 21% 6.4% 1.6% 28.4% 2% 0.4% 1.3% 5.8% 1.8% 3.8% 21.4% 9.2% 2.5%30.9% 1.4% 3.9%2.1% 17.2% 21% 29.6% 27.4% 5.2% 1.6% 5.1% 4.1% 3.6%1.7% 4.5% 3.9% 1.8% 2.2% 0.6% 1.5% 2009 2010 2011 2012 *Includes cooperative service vending, music, games, bulk vending, bottled water, sundries, toiletries, condoms, kiddie rides, and other foodservice revenue. 21% 31% 28% 6.3% 4.3% 3.7% 31% 21% 6.4% 1.6% 28.4% 2% 0.4% 1.3% 5.8% 1.8% 3.8% 21.4% 9.2% 2.5%30.9% 1.4% 3.9%2.1% 17.2% 21% 29.6% 27.4% 5.2% 1.6% 5.1% 4.1% 3.6%1.7% 4.5% 3.9% 1.8% 2.2% 0.6% 1.5% 2009 2010 2011 2012 *Includes cooperative service vending, music, games, bulk vending, bottled water, sundries, toiletries, condoms, kiddie rides, and other foodservice revenue. 21% 31% 28% 6.3% 4.3% 3.7% 31% 21% 6.4% 1.6% 28.4% 2% 0.4% 1.3% 5.8% 1.8% 3.8% 21.4% 9.2% 2.5%30.9% 1.4% 3.9%2.1% 17.2% 4.5% 3.9% 1.8% 2.2%1.5% 2010 2011 2012 *Includes cooperative service vending, music, games, bulk vending, bottled water, sundries, toiletries, condoms, kiddie rides, and other foodservice revenue. 21% 31% 28% 6.3% 4.3% 3.7% 31% 21% 6.4% 1.6% 28.4% 2% 0.4% 1.3% 5.8% 1.8% 3.8% 21.4% 9.2% 2.5%30.9% 1.4% 3.9%2.1% 17.2% 2011 2012 *Includes cooperative service vending, music, games, bulk vending, bottled water, sundries, toiletries, condoms, kiddie rides, and other foodservice revenue. 4.3% 3.7% 31% 21% 6.4% 1.6% 28.4% 5.8% 1.8% 3.8% 21.4% 9.2% 2.5%30.9% 1.4% 3.9%2.1% 17.2% ● Candy/snacks/ confections ● OCS ● Ice cream ● Vended food ● Micro markets ● Hot beverages ● Cold beverages ● Manual foodservice ● Milk ● Cigarettes ● Other* 5 Automatic Merchandiser VendingMarketWatch.com June 2013 S p e c i a l a n n u a l r e p o r t : s t a t e o f t h e v e n d i n g i n d u s t r y
- 6. and software suppliers are develop- ing solutions for data integration that range from cloud-based systems to data standards used by micro market manufacturers. Product segment review In 2012, most product segments experienced an increase. The larg- est segment by revenue, cold bever- age, grew more than 1.5 percent in the vending channel, beating the 1 percent revenue growth reported in overall retail by the Beverage Market- ing Corp. (BMC). According to BMC, growth is attributed to the strength- ened economy. Ready-to-drink tea and coffee, as well as energy drinks, were the beverages that grew the most, while established segments like carbonated soft drinks and fruit beverages didn’t grow much in 2012, reports BMC data. Cold beverage machines, both closed front and glassfront, were relatively flat in 2012, up just half a percent, with the number of placed venders hovering around 3.5 million for both bottlers and vending opera- tors, shown in chart 13. The canned cold beverage segment gained market share as vending operators used them to offer beverages at a lower price point. Cup drinks grew for a similar reason as well as some being placed in micro market locations. The national average canned cold beverage price remained at 76 cents in 2012, shown in chart 13C. The average bottle price increased to $1.33 and the cup to 71 cents. The candy,snackandconfectionseg- ment increased in 2012, posting a 3.85 percent growth in revenue, the first growth in five years. However, 2012 also showed a decrease in this seg- ments’ unit sales, seen in chart 14B. According to Management Science Associates, Inc., which tracks UPC level sales data from vending machines and projects it to a national scale, vend- ing operators raised prices in this cat- egory an average of 2.17 percent in the past year, shown in chart 14E. This accounts for the increase in revenue despite falling unit sales. Unit sales fell in all candy segments, nutritional snacks, baked foods and nuts/seeds. Conversely, the number of crackers as well as food and meat snacks sold showed an increase in 2012. Hot beverage sales rebounded in 2012. The number of machines increased to 2009 levels, shown in chart 15A. Operators also increased most coffee prices in 2012 including fresh-brewed regular coffee (5 cents), fresh-brewed specialty/flavored (4 cents) and hot chocolate (7 cents). The most notable percent of sales change in this segment is a 6 percent increase in specialty, flavored drinks for 2012, while fresh-brewed regular coffee dropped 20 percent. OCS continued its trend of growth in revenue for the fourth straight year, proving it’s still a thriving seg- ment for profits, shown in chart 12. OCS sales, as a percent of total rev- enue, continued to post higher than hot beverage, a trend that began in 2007. Of the major product segments, OCS posted the most 1-year sales gain. Consumer research still points to OCS Chart 13a: Cold beverage machines by type, bottlers and vendors, 4-year review bottler owned Type 2009 2010 2011 2012 Bottle and can closed front 2,300,000 2,300,000 2,280,000 2,291,400 Glassfront 195,000 200,000 210,000 211,050 Cup 0 0 0 0 ToTAL 2,495,000 2,500,000 2,490,000 2,502,450 vendor owned Type 2009 2010 2011 2012 Bottle and can closed front 972,000 972,000 972,000 976,860 Glassfront 25,000 30,000 35,000 35,175 Cup 8,000 6,000 4,000 4,000 ToTAL 1,005,000 1,008,000 1,011,000 1,016,035 Chart 13B: Cold beverage sales, 4-year review % of sales Type 2009 2010 2011 2012 Can 29% 29% 29% 42.15% Bottle 70.7 70.8 70.7 55.13 Cup 0.3 0.2 0.3 3.35 projected totals Type 2009 2010 2011 2012 Can $1.69B $1.7B $1.704B $2.352B Bottle 4.56 4.11 4.155 3.076 Cup 0.018 0.017 0.017 0.187 Editor’s Note: These totals only apply to the volume sold by vending operators, not bottlers. Chart 13C: Average cold beverage prices, 4-year review Type 2009 2010 2011 2012 Can 71¢ 73¢ 76¢ 76¢ Bottle $1.25 $1.30 $1.32 $1.33 Cup 70¢ 70¢ 70¢ 71¢ 6 Automatic Merchandiser VendingMarketWatch.com June 2013 S p e c i a l a n n u a l r e p o r t : s t a t e o f t h e v e n d i n g i n d u s t r y
- 7. opportunities to include more spe- cialty drinks as well as single cup. The OCS Update on page 13 shares some tips for increasing OCS sales based on NAMA commissioned research. Food sales in 2012 showed an increase as well, especially in freshly prepared items, which increased 1.9 percent to 29.3 percent of operator sales. Operators reported growth in this area was due to the increase in micro markets. This is supported by the fact that food sales increased despite a decline in refrigerated machine sales, shown in chart 16A. Operators also reported increasing different types of food offerings both in markets and food machines. Chart 14A: candy/snack/confection machines, 4-year review 2009 2010 2011 2012 Projected Total 1,315,000 1,315,000 1,315,000 1,328,150 Chart 14B: Totals by category and subcategory % Sales Changes 2011 Projected revenue % sales of total Share change from 2010 Revenue Change Unit Change Candy $1.33B 32.17% -0.53% 1.89% -3.3% Chocolate candy 0.99 23.93 0.05 4.12 -1.8 Gum 0.06 1.41 -0.02 2.52 -2.8 Mint/hard roll 0.02 0.56 0.50 -3.79 -7.1 Non-chocolate 0.26 6.37 -0.43 -3.60 -8.5 Snacks $2.79B 67.53% 0.32% 4.34% -1.2% Total nutrition snacks 0.12 2.93 0.08 6.97 -1.1 Breakfast bars, cereal, fruit snacks, functional bars, nutritional pretzels, granola bars, rice cakes, trail mix Baked goods 0.85 20.49 0.40 5.91 -3.8 Cakes/brownies, cereal snacks, crème-filled cake, Danish, donuts/gems, honey buns, misc. (Poptarts), muffins, pies, regular cookies, sandwich cookies, sweet rolls, unfilled cakes Crackers 0.23 5.68 0.28 9.71 4.3 Regular crackers 0.15 3.75 0.35 14.67 4.7 Sandwich crackers 0.08 1.91 0.12 11.19 3.6 Food snacks 0.06 1.43 0.23 31.58 7.6 Meat snacks 0.06 1.37 0.27 48.69 8.9 Meat and cheese 0.00 0.07 0.062 -9.7 -15.9 Nuts and seeds 0.06 1.42 -0.08 -3.99 -3.6 Almonds, cashews, mixed nuts, peanuts, pistachio nuts, pumpkin seeds, sunflower seeds Salty snacks 1.47 35.61 -0.53 2.34 -2.3 Cheese curls, corn/tortilla chips, onion rings, popcorn, potato chips, potato sticks, pretzels, snack mix, misc. Chart 14D: Top frozen confections in 2012, Unit Volume # Product 1 Cloverhill Bakery 4-oz. Big Texas Cinnamon Roll 2 Flowers Foods Mrs. Freshley’s 5-oz. Jumbo Honey Bun 3 Flowers Foods Mrs. Freshley’s 6-oz. Grand Iced Honey Bun 4 Flowers Foods Mrs. Freshley’s 4-oz. Chocolate Cupcake 5 Cloverhill Bakery 4.75-oz. Jumbo Glazed Honey Bun 6 Cloverhill Bakery 4-oz. Danish Cheese Round 7 Cloverhill Bakery 4-oz. Glazed Honey Bun 8 Cloverhill Bakery 4.75-oz. Jumbo Iced Honey Bun 9 Aryzta Otis Spunkmeyer 4-oz. Blueberry Muffin 10 Flowers Foods Mrs. Freshley’s 4-oz. Danish Gourmet Texas Cinnamon Source: Vend product distributors Chart 14E: Top 10 candy/snack/confections in dollar sales, 4-year review Average selling price # Product 2009 2010 1-year change 2011 1-year change 2012 1-year change 1 Mars Chocolate NA 2-oz. Snickers Original $0.83 $0.88 6% $0.91 3.65% $0.95 4.40% 2 Mars Chocolate NA 1.74-oz. MM’s Peanut 0.84 0.89 5 0.91 3.1 0.95 4.40 3 Mars Chocolate NA 2-oz. Twix Bar 0.85 0.89 4.7 0.92 3.3 0.96 4.35 4 Frito-Lay 1.75-oz. Doritos Nacho Cheesier Big Grab 80 0.83 0.86 3.6 0.88 1.94 0.87 -1.14 5 Frito-Lay 1.5-oz. Lay’s Chips 0.81 0.84 3.5 0.87 2.18 0.88 1.15 6 Frito-Lay 1.5-oz. Ruffles Cheddar Sour Cream 0.85 0.88 3.7 0.90 2.91 0.90 0 7 Frito-Lay 1.125-oz. Cheetos Crunchy 0.87 0.75 -13.7 0.79 4.8 0.81 2.53 8 FA Chocolate Chip Cookie 2-oz NA NA 3.2 NA 2.19 0.95 ---- 9 Mars Chocolate NA 2.13-oz. Three Musketeers Original 0.84 0.88 4.7 0.91 3.56 0.94 3.27 10Frito-Lay 2.125-oz. Cheetos Crunchy 0.82 0.83 1.2 0.86 3.04 0.86 0.49 Editor’s Note: Percentage gains have been affected by rounding. Source: Management Science Associates ProVen data. Chart 14C: Average number of new candy/snack/confection products introduced to vending, 4-year review 2009 122 2010 245 2011 152 2012 157 Source: Management Science Associates ProVen data. 7 Automatic Merchandiser VendingMarketWatch.com June 2013 S p e c i a l a n n u a l r e p o r t : s t a t e o f t h e v e n d i n g i n d u s t r y
- 8. There was also an 8 percent jump in sales for “other” types of foods in 2012. The most reported items were cups of soup and packaged items that could be a snack or food. Operators also saw success with juice and desserts. Prices remained flat in the food segment, $2.40 for freshly prepared, $2.35 for frozen prepared and $2 for shelf stable. Milk, ice cream and cigarettes all showed growth in 2012, although they remain small product segments in vending, see chart 12. These seg- ments are doing better through a combination of an improving economy as well as operators offer- ing more product variety, especially in micro markets. Operators also reported doing more bulk vending in 2012 than in previous years rep- resented in the “other” category of chart 12. 2013: the new vending business Vending operators were somewhat divided about the future. Those that proceed with the same product mix, machines and business prac- tices from 5 or 10 years ago con- tinue to struggle. They suffer lost locations taken by savvy competi- tors and consumers wanting more variety. They report that location employees still hesitate to buy vend- ing products due to low wages. The operators who have acknowledged vending is a different business now have raised prices, invested in technology at various levels and started investigating new revenue streams, like micro markets, which eliminate commissions in most cases. They’ve strengthened OCS programs and started offering teas and water service to better serve the needs of the consumer. This is still a challenging market with negative consumer perception of vending machines and leaner workplaces, but the growth in 2012 looks like it will continue. Already in 2013 many operators who have embraced new and evolving tech- nologies and business practices report seeing even more growth. Chart 16A: Food machines, 4-year review Type 2009 2010 2011 2012 Refrigerated 133,000 131000 129000 128,700 Frozen* 51300 52,600 53,000 53,000 Ambient 2000 2000 2000 2000 Food systems (pizza, french fries) 3900 1500 1100 1000 Total 190200 187,100 185,000 184,700 Frozen food machines as a percent of total 27% 28.1% 28.6% 28.7% * Most were also used for ice cream. Chart 16B: Top 20 frozen food products in 2012, Unit Volume # Product # Product 1 Pierre Foods Big AZ Beef Charbroil with Cheese 11 Michelina’s Pepperoni Pizza Snack Rolls 2 White Castle Twin Cheeseburger 12 Nestle Chef America Hot Pockets Ham Cheese 3 Nestle Chef America Hot Pockets Pepperoni Pizza 13 Schwan’s Foods 7-inch Pepperoni Pizza 4 Pierre Foods Bubba Twin Chili Cheese Hot Dog 14 Michelina’s Salisbury Steak with Mashed Potato 5 Furlani Texas Toast 15 Michelina’s Pepper Steak and Rice 6 Pierre Foods Country Fried Chicken with Cheese 16 Schwan’s Foods 7-inch Supreme Pizza 7 Pierre Foods Hot Spicy Chicken Wings 17 Monogram Chicken Corn Dog 8 Dreyer’s Vanilla with Crunch Dibs 18 Pierre Foods Jumbo Cheeseburger with Bacon 9 Pierre Foods Double Beef Stacker with Cheese 19 Michelina’s Meatloaf and Gravy with Mashed Potato 10 JJ Snack Frozen Lemonade Cup 20 Pierre Foods Spicy Chicken Sandwich with Cheese Source: Vend product distributors Chart 15: Hot beverage machines, 4-year review 2009 2010 2011 2012 320,000 315,000 309,000 318,270 8 Automatic Merchandiser VendingMarketWatch.com June 2013 S p e c i a l a n n u a l r e p o r t : s t a t e o f t h e v e n d i n g i n d u s t r y