Purchasing Managers' Index August 1, 2012
•
0 likes•246 views

Purchasing Managers' Index August1, 2012: PMI climbs to 50.6 in July – a break in the negative trend in industry

Recommended
Recommended
More Related Content
What's hot
What's hot (12)
Viewers also liked
Viewers also liked (17)
Similar to Purchasing Managers' Index August 1, 2012
Similar to Purchasing Managers' Index August 1, 2012 (18)
More from Swedbank
More from Swedbank (20)
Recently uploaded
Recently uploaded (20)
Purchasing Managers' Index August 1, 2012
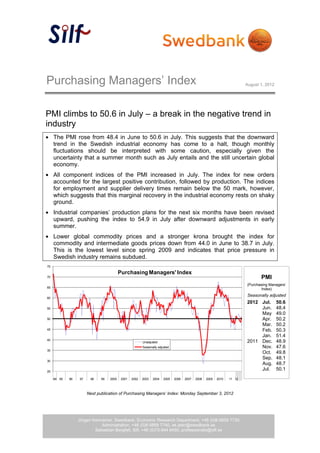
- 1. Purchasing Managers’ Index August 1, 2012 PMI climbs to 50.6 in July – a break in the negative trend in industry The PMI rose from 48.4 in June to 50.6 in July. This suggests that the downward trend in the Swedish industrial economy has come to a halt, though monthly fluctuations should be interpreted with some caution, especially given the uncertainty that a summer month such as July entails and the still uncertain global economy. All component indices of the PMI increased in July. The index for new orders accounted for the largest positive contribution, followed by production. The indices for employment and supplier delivery times remain below the 50 mark, however, which suggests that this marginal recovery in the industrial economy rests on shaky ground. Industrial companies’ production plans for the next six months have been revised upward, pushing the index to 54.9 in July after downward adjustments in early summer. Lower global commodity prices and a stronger krona brought the index for commodity and intermediate goods prices down from 44.0 in June to 38.7 in July. This is the lowest level since spring 2009 and indicates that price pressure in Swedish industry remains subdued. 75 Purchasing Managers' Index 70 PMI (Purchasing Managers’ 65 Index) Seasonally adjusted 60 2012 Jul. 50.6 55 Jun. 48.4 May 49.0 50 Apr. 50.2 Mar. 50.2 45 Feb. 50.3 Jan. 51.4 40 Unadjusted 2011 Dec. 48.9 Seasonally adjusted Nov. 47.6 35 Oct. 49.8 Sep. 48.1 30 Aug. 48.7 25 Jul. 50.1 94 95 96 97 98 99 2000 2001 2002 2003 2004 2005 2006 2007 2008 2009 2010 11 12 Next publication of Purchasing Managers’ Index: Monday September 3, 2012 Jörgen Kennemar, Swedbank, Economic Research Department, +46 (0)8-5859 7730 Administration, +46 (0)8-5859 7740, ek.sekr@swedbank.se Sebastian Bergfelt, Silf, +46 (0)73-944 6450, professionals@silf.se 1 (4)
- 2. Silf/Swedbanks’ Purchasing Managers’ Index. seasonally adjusted PMI Components of PMI Other indices Forecast Total New Produc- Employ- Delivery Export Domestic Back-log Planned Index orders tion ment times Inventories orders orders of orders Prices Import Production 2009 Apr 38.8 41.5 39.4 28.3 29.6 35.9 45.3 37.7 39.7 30.6 38.8 42.4 May 43.7 46.4 47.4 31.1 34.2 33.5 47.5 44.1 42.8 32.7 41.0 47.3 Jun 50.5 54.7 55.8 36.0 42.4 34.0 54.4 49.2 47.4 43.3 47.3 55.2 Jul 54.3 60.5 61.0 40.3 44.4 38.4 56.4 58.1 54.1 46.9 51.0 59.1 Aug 52.4 57.8 56.1 40.6 46.4 40.4 61.1 50.1 54.3 52.6 50.7 61.7 Sep 55.9 59.2 60.5 45.0 53.7 40.6 61.1 55.0 54.0 54.5 55.7 63.3 Oct 56.7 60.8 61.7 43.8 56.2 41.6 60.7 55.8 58.9 56.7 55.8 62.2 Nov 56.0 57.9 59.0 48.7 55.0 41.3 59.7 53.6 53.6 59.8 57.0 62.2 Dec 58.2 63.7 59.7 49.5 56.3 42.7 58.1 66.3 56.6 57.3 59.0 67.4 2010 Jan 61.7 66.8 70.2 49.6 61.5 48.3 62.3 64.8 62.6 61.2 61.3 69.5 Feb 61.5 67.5 65.3 55.0 61.4 53.6 62.7 63.6 64.2 61.3 59.7 68.1 Mar 61.1 63.8 63.7 54.9 67.0 50.2 62.3 58.9 60.6 65.7 62.3 69.6 Apr 64.0 68.1 66.3 56.6 68.3 46.0 64.6 63.2 62.5 75.6 60.3 77.5 May 66.0 68.8 71.0 60.1 71.5 50.7 62.6 64.1 64.3 71.0 59.9 73.0 Jun 62.4 61.1 66.8 60.3 69.2 50.4 57.4 60.1 60.9 71.1 59.5 73.1 Jul 64.2 67.3 72.2 56.3 66.4 51.4 61.4 63.2 63.4 70.9 60.9 72.0 Aug 60.6 61.8 61.9 60.5 64.5 52.0 57.4 58.7 59.7 68.5 56.1 72.4 Sep 63.3 65.8 67.4 60.3 66.3 52.9 61.4 62.9 62.2 71.1 58.6 70.8 Oct 61.8 63.0 63.5 59.0 66.8 47.9 61.6 58.2 61.7 66.4 59.3 72.4 Nov 61.3 60.4 64.2 60.2 67.2 50.2 58.9 56.3 58.2 70.8 61.4 72.5 Dec 60.2 63.6 62.8 57.1 64.5 55.5 60.5 63.6 59.5 71.9 59.7 74.0 2011 Jan 61.5 64.2 64.9 57.7 64.6 51.9 61.9 62.1 60.2 77.1 58.6 70.9 Feb 60.9 59.5 65.0 61.1 67.2 54.4 58.8 56.3 58.0 77.1 60.2 71.0 Mar 58.6 56.1 61.4 58.3 66.0 52.0 54.7 54.0 54.3 73.8 58.9 71.6 Apr 59.8 61.5 61.9 57.7 65.1 54.6 58.3 56.9 57.3 74.5 58.5 70.5 May 56.1 55.4 59.8 54.4 61.0 55.6 52.8 56.4 55.3 63.5 56.2 69.1 Jun 52.9 52.3 54.0 51.3 58.1 51.4 52.5 48.8 51.0 60.5 52.2 64.5 Jul 50.1 45.4 49.4 53.7 55.4 50.1 46.9 43.4 49.1 51.5 50.4 63.1 Aug 48.7 47.0 48.6 50.9 49.1 51.5 48.0 42.3 47.9 47.4 48.5 55.8 Sep 48.1 46.5 48.9 50.0 47.5 52.0 48.3 46.2 47.0 47.0 45.8 53.8 Oct 49.8 50.5 48.2 50.7 47.8 47.1 48.9 49.1 48.9 39.9 46.8 53.6 Nov 47.6 47.1 46.2 48.3 45.6 46.0 47.5 46.1 45.1 42.6 44.5 51.6 Dec 48.9 47.0 49.2 49.5 49.9 48.3 48.7 45.1 46.4 42.6 46.5 59.3 2012 Jan 51.4 52.0 52.9 48.0 51.0 47.0 49.9 49.0 50.6 50.3 50.3 56.2 Feb 50.3 49.5 51.9 48.3 52.6 51.2 48.7 48.5 48.0 52.5 50.6 57.7 Mar 50.2 50.5 48.6 49.5 49.3 43.7 50.1 48.6 48.6 55.3 47.9 56.5 Apr 50.2 51.2 51.2 46.7 49.3 46.3 52.3 48.3 52.7 52.3 48.6 55.0 May 49.0 49.2 51.2 46.3 46.9 47.9 51.1 44.9 47.0 45.8 46.5 54.5 Jun 48.4 46.4 50.9 46.7 46.8 46.0 50.3 44.1 46.9 44.0 48.5 53.7 Jul 50.6 51.2 54.0 47.7 46.9 48.2 52.3 47.3 48.5 38.7 52.4 54.9 2 (4)
- 3. Silf/Swedbanks’ Purchasing Managers’ Index PMI Components of PMI Other indices Forecast Total New- Produc- Employ- Delivery Export Domestic Back-log Planned Index orders tion ment times Inventories orders orders of orders Prices Import Production 2009 Apr 41.1 44.8 43.2 29.7 30.6 36.8 47.8 40.4 42.6 34.1 40.6 45.1 May 45.8 49.0 50.3 33.1 36.5 35.3 49.6 46.6 45.9 36.5 43.2 48.3 Jun 53.9 59.4 60.8 39.1 45.5 37.3 58.3 53.5 50.3 45.1 50.0 54.6 Jul 50.7 55.7 51.3 40.8 46.9 40.7 53.5 53.6 53.1 47.4 47.3 59.2 Aug 56.2 62.9 62.9 41.9 49.3 41.5 64.6 55.3 60.2 54.5 53.9 64.7 Sep 57.7 59.9 63.6 46.7 56.6 40.4 61.2 57.1 54.0 57.0 57.8 62.9 Oct 56.1 58.6 61.1 43.6 57.2 40.4 58.1 54.7 55.0 56.8 54.7 59.6 Nov 53.9 53.8 56.1 48.1 53.5 39.3 56.1 50.8 48.5 56.9 55.4 59.5 Dec 54.2 57.9 53.5 47.2 52.8 39.3 61.6 52.8 50.8 52.8 56.0 65.7 2010 Jan 59.7 65.4 67.7 47.2 57.9 49.2 61.7 62.3 61.5 59.4 60.1 70.6 Feb 62.2 70.4 66.3 54.3 59.4 52.9 65.5 65.0 66.9 60.6 59.8 70.2 Mar 62.4 66.7 66.4 54.5 66.6 51.4 64.8 60.3 63.4 66.1 64.2 71.6 Apr 66.0 70.9 69.6 58.0 69.2 46.8 66.6 65.4 64.9 79.3 61.7 79.9 May 67.8 70.8 73.6 62.1 73.6 52.5 64.0 66.1 66.9 74.4 61.6 73.4 Jun 65.3 64.9 71.2 63.2 71.8 53.6 60.4 63.7 63.2 72.5 61.6 72.0 Jul 60.3 62.1 62.4 56.3 68.2 53.6 58.0 58.4 62.1 70.8 56.8 71.6 Aug 63.9 66.3 68.0 61.5 66.7 53.0 60.4 63.4 65.1 69.7 58.7 75.0 Sep 64.8 66.2 70.2 61.7 68.7 52.6 61.4 64.9 61.9 73.2 60.3 70.0 Oct 60.9 60.5 62.5 58.4 67.3 46.3 58.9 56.6 57.6 65.8 57.9 69.5 Nov 58.9 55.9 61.0 59.4 65.3 47.9 55.2 53.1 52.8 67.6 59.7 69.6 Dec 56.0 57.6 56.2 54.3 60.5 52.1 55.9 58.3 53.4 67.2 56.6 72.2 2011 Jan 59.4 62.7 62.3 54.9 60.6 50.7 61.5 59.6 59.0 75.3 57.3 71.7 Feb 61.5 62.2 65.9 60.3 65.0 53.7 61.6 57.4 60.5 76.4 60.3 72.8 Mar 59.6 58.6 63.9 57.6 65.4 53.1 56.9 55.1 56.8 74.0 60.8 73.4 Apr 61.7 64.3 65.0 58.9 65.8 55.4 60.3 59.0 59.6 78.1 59.9 72.8 May 57.7 57.3 62.3 56.1 62.9 57.5 54.0 58.4 57.8 66.2 57.8 69.4 Jun 55.6 56.1 58.1 54.1 59.9 54.8 55.8 52.4 53.7 61.8 54.0 63.1 Jul 45.8 39.7 39.2 53.5 56.9 52.0 43.1 38.1 47.5 50.5 46.0 62.4 Aug 51.7 51.3 54.4 51.7 50.7 52.4 50.7 46.6 53.0 47.7 50.7 57.8 Sep 49.4 46.8 51.6 51.3 49.4 51.6 48.1 48.1 46.5 48.4 47.1 52.5 Oct 48.9 48.1 47.1 50.0 48.1 45.1 46.2 47.7 44.9 38.5 45.2 50.3 Nov 45.2 42.6 42.9 47.4 43.5 43.4 43.8 42.9 39.6 39.0 42.6 48.4 Dec 44.8 41.2 42.8 46.7 46.0 44.8 44.2 39.9 40.4 37.7 43.4 57.7 2012 Jan 49.6 51.0 50.7 45.2 47.3 45.5 49.7 46.9 49.7 49.0 49.3 57.2 Feb 51.1 52.4 53.1 47.6 50.7 50.7 51.7 50.0 50.7 52.5 51.0 59.8 Mar 51.5 53.3 51.3 49.0 49.0 44.6 52.6 50.0 51.3 56.3 50.0 58.6 Apr 52.4 54.4 54.7 48.0 50.3 47.2 54.7 50.7 55.5 56.5 50.3 57.5 May 50.8 51.3 54.0 48.0 49.0 50.0 52.6 47.0 50.0 49.0 48.3 55.0 Jun 51.2 50.0 55.3 49.4 49.4 49.1 53.4 47.5 49.1 45.1 50.6 52.5 Jul 46.6 45.8 44.2 47.7 48.7 50.3 48.7 42.2 47.1 37.7 48.4 54.5 3 (4)
- 4. 4 (4)