SlideShare una empresa de Scribd logo
1 de 35
Descargar para leer sin conexión
A hybrid approach to achieve
organizational agility
An empirical study of a food company
Majid Nejatian
Tarbiat Modares University (TMU), Tehran, Iran
Mohammad Hossein Zarei
Politecnico di Milano, Milan, Italy and
Universidad Politécnica de Madrid, Madrid, Spain
Mehran Nejati
Edith Cowan University, Joondalup, Australia, and
Seyed Mahmood Zanjirchi
Yazd University, Yazd, Iran
Abstract
Purpose – In today’s intense global competition, agility is advocated as a fundamental characteristic for
business survival and competitiveness. The purpose of this paper is to propose a practical methodology to
achieve and enhance organizational agility based on strategic objectives.
Design/methodology/approach – In the first step, a set of key performance indicators (KPIs) of the
organization being studied are recognized and classified under the perspectives of balanced scorecard (BSC).
Critical success factors are then identified by ranking the KPIs according to their importance in achieving
organizational strategic objectives using the Technique for Order of Preference by Similarity to Ideal Solution
(TOPSIS). In the second step, three houses of quality (HOQs) are constructed sequentially to identify and rank
the main agile attributes, agile enablers, and improvement paths. In addition, in order to translate linguistics
judgments of practitioners into numerical values in building HOQs, fuzzy logic is employed.
Findings – The capability of the proposed methodology is demonstrated by applying it to a case of a
multi-national food company in Iran. Through the application, the company could find the most suitable
improvement paths to improve its organizational agility.
Research limitations/implications – A limited number of KPIs were chosen due to computational and
visual constraints related to HOQs. Another limitation, similar to other agility studies, which facilitate
decision making among agility metrics, was that the metrics were more industry-specific and less inclusive.
Practical implications – A strong practical advantage for the application of the methodology over directly
choosing agility metrics without linking them is that through the methodology, the right metrics were
selected that match organization’s core values and marketing objectives. While metrics may ostensibly seem
unrelated or inappropriate, they actually contributed to the right areas where there were gaps between the
current and desired level of agility. It would otherwise be impossible to choose the right metrics without a
structured methodology.
Originality/value – This paper proposes a novel methodology for achieving organizational agility.
By utilizing and linking several tools such as BSC, fuzzy TOPSIS, and quality function deployment (QFD), the
proposed approach enables organizations to identify the most appropriate agile attributes, agile enablers, and
subsequently agile improvement paths.
Keywords Quality function deployment, Balanced scorecard, House of quality, Organizational agility,
Enterprise agility, Agile organization
Paper type Research paper
1. Introduction
Uncertainty and change have always been significant issues in the rapidly changing
business environment (Zhang and Sharifi, 2000). The beginning of the twenty-first century
was coincided with increasing customers’ dynamic demands and deterioration of economic
circumstance in many countries which has changed the marketplace into “battlefield”
(Yusuf et al., 1999). Since then, “business turbulence” and “change” have been recognized
as the main causes of failure in many industries (Small and Downey, 1996), even among
Benchmarking: An International
Journal
Vol. 25 No. 1, 2018
pp. 201-234
© Emerald Publishing Limited
1463-5771
DOI 10.1108/BIJ-09-2016-0147
Received 28 September 2016
Revised 22 November 2016
Accepted 2 December 2016
The current issue and full text archive of this journal is available on Emerald Insight at:
www.emeraldinsight.com/1463-5771.htm
201
Organizational
agility
giant organizations. This fact has forced enterprises to efficiently respond to the market
changes in a quicker and more flexible way.
In the beginning of the 1990s, a new solution for managing dynamic and constantly
changing environments emerged by the experts of Iacocca Institute of Lehigh University
(USA), called agility (Sherehiy et al., 2007). Ever since its inception, agility has become a
prevailing topic and received increasing attention from both industry and academia. Various
definitions of agility have been presented by different scholars; all of which share the same
trait: “the ability of an enterprise to survive and prosper in a competitive and unpredictable
environment by responding quickly and effectively to any kind of change – anticipated or
unpredicted – in proper ways and due time” (Gunasekaran, 1999; Brown and Bessant, 2003;
Sharifi and Zhang, 2001). It aims at satisfying customers’ various demands in terms of price,
quality, quantity, specification, and delivery (Prince and Kay, 2003). Although in the
beginning, it solely referred to the manufacturing context, today the paradigm of agility is
expanded to different types of organizations in various industries (Christopher, 2000).
Different terms are used in the literature to refer to agility at organizational level: enterprise
agility (Yang and Liu, 2012), business agility (Morgan, 2004), and organizational agility
(Nejatian and Zarei, 2013). Despite some minor differences, they can be interchangeably used.
Throughout this paper, the term “organizational agility” is used.
Previous literature has shown that organizational agility is tightly linked with the success of
organizations. It empowers organizations to produce and deliver innovative products and
services in a cost-efficient way (Swafford et al., 2006), increases customer satisfaction and
competitiveness, eliminates non-value added activities, decreases manufacturing costs
(Lin et al., 2006), leading to enhanced organizational excellence (Nafei, 2016b) and
organizational performance (Kuleelung and Ussahawanitchakit, 2015; Nafei, 2016a).
However, agility is not a solid goal to be gained and then forgotten; rather, it is the means to
maintain competitiveness in unpredictable, dynamic, and constantly changing markets (Jackson
and Johansson, 2003) and deliver the right products at the right time to the customers (Agarwal
et al., 2007; Lin et al., 2006; Yusuf et al., 1999). Hence, there is need for methodologies that
continuously measure the gap between current and desired levels of organizational agility along
with the changes in the organizational environment. However, the literature of agility scants
such studies. This paper tries to fill the void by proposing a systematic methodology and its
application for improving organizational agility. The methodology considers organization’s
strategy and core competencies and highlights the specific areas of focus that results in higher
organizational agility. As such, the main objective of this study is to propose a structured
methodology that improves organizational agility. The methodology is aimed to select the right
agility metrics (i.e. key performance indicators (KPIs), agile attributes, agile enablers, and
improvement paths) that are in line with organizational strategic goals and lead to increased
market competitiveness. Moreover, since previous methodological studies in the area of
organizational agility scant practical applications, another objective of this research is to show a
full empirical implementation of the proposed methodology in a competitive market.
The remainder of the paper is organized as the following. In Section 2, a review of the
prior studies on agility is provided, with a specific concentration on agile attributes, agile
enablers, and methodologies to achieve agility. Section 3 explains the proposed
methodology of the current study. Next, an empirical investigation is conducted to
demonstrate the application of the proposed methodology and the findings in Section 4.
Discussions of the findings, limitations, and some future research directions are provided in
Section 5. Finally, Section 6 rounds up and concludes the paper.
2. Literature review
This section reviews the literature of organizational agility with the focus on methodological
studies. Since most of these studies, as well as our paper, use specific agility metrics such as
202
BIJ
25,1
agile attributes and agile enablers, we first elucidate these metrics and briefly review the
literature around them. Then, we review and compare the main methodological papers
about organizational agility.
2.1 Agile attributes
Agile organizations are characterized by “agile attributes,” also known as
“agility capabilities,” which provide enterprises the potency to promptly respond to
the market changes (Ren et al., 2003; Bottani, 2010; Tallon and Pinsonneault, 2011).
Agile attributes are essential capabilities that a company has to develop within its
structure in order to effectively cope with the changes or pressures from the business
environment that drive companies to embrace the agile paradigm (called agility drivers)
(Sharifi and Zhang, 2001).
During the past years, researchers have found that the core concept of agile attributes,
which had been solely referred to manufacturing, has to be extended to the entire supply
chain as it is impossible to achieve agile manufacturing while the rest of the supply chain
operate on a normal speed (Christopher, 2000; Van Hoek et al., 2001; Ren et al., 2001; Sherehiy
et al., 2007; Nejatian and Zarei, 2013). This calls for engaging all the organizations within the
supply chain, either manufacturing or not, to move toward organizational agility.
Various agile attributes have been presented in the literature. Kidd (1994) suggested that
agility can be achieved through the following capabilities: “integration of organization,
highly skilled and knowledgeable people, and advanced technologies.” In a similar view,
Goldman et al. (1995) and Gunasekaran (1998) have introduced four main dimensions of
agility as “enriching the customer, co-operation, organizing to master change and
uncertainty, and leveraging the impact of people and information.” Ren et al. (2001) and
Christopher and Towill (2001) expressed that agile attributes encompass the integration of
information systems or technologies, people, business processes, and facilities. Dove (1996)
and Swafford et al. (2006) proposed the term “flexibility” as one of the main foundations of
agility. Yusuf et al. (1999) stated that the development of a strategic architecture, which
presents a corporate wide map of core skills, enables organization to make rapid changes
and afford reconfiguration of the business when an opportunity emerges. Mohanty and
Deshmukh (2001) proposed various attributes of agility ranging from rapid response to
enquiry and customer service to image and quality. Yusuf et al. (1999) proposed a
comprehensive taxonomy of agile attributes based on their review of literature comprising
32 attributes characterizing an agile enterprise classified under 10 decision domains.
We adopt their taxonomy in our methodology due to its completeness and inclusion of
decision domains. The taxonomy is shown in Table I.
It has been suggested by Ren et al. (2003) that different agile attributes would steer to
different levels of competitive bases, also referred to as competitive or competing priorities.
According to Yusuf et al. (1999), competitive bases, which companies typically compete
along, include responsiveness, new product introduction, delivery, flexibility, quality,
concern for the environment, and international competitiveness. The relative importance of
each competitive base in achieving competitive advantage depends on the specific market
field (Bottani, 2009a). Moreover, due to trade-offs between competitive bases, it has been
ascertained that companies cannot excel in all of them simultaneously (Burgess et al., 1998).
Therefore, agile attributes may alter depending on the competitive bases the enterprises are
aspiring to surpass in (Ren et al., 2003).
2.2 Agile enablers
In order to best achieve agile attributes, companies should utilize appropriate leverages,
referred to as “agile enablers” (Lin et al., 2006; Bottani, 2009a, 2010). Gehani (1995) identified
six key actions necessary to implement an agile strategy, namely, “cross-functional team
203
Organizational
agility
sharing, empowerment for front-line decision making, modular integration of
available technologies, delayed design specification, product succession planning, and
enterprise-wide integration of learning.” The adoption of cross-functional teams
and concurrent engineering practices as the substantial means for achieving time
compression was also supported by Kumar and Motwani (1995).
Later, seminal studies of Gunasekaran (1998, 1999) comprehensively defined and
identified main agile enablers in the agile manufacturing context, namely, “virtual
enterprise formation tools/metrics, physically distributed teams and manufacturing,
rapid partnership formation tools/metrics, concurrent engineering, integrated
product/production/business information system, rapid prototyping tools, and electronic
commerce.” The taxonomy was extracted from the work of earlier researchers
(e.g. Cho et al., 1996; Gehani, 1995; Burgess, 1994). It is still being used as the basis for
many current agility studies due to its comprehensiveness and validity.
2.3 Agility methodologies
One of the first integrated proposed frameworks to achieve agility has been offered by
Gunasekaran (1998) which illustrates how the main capabilities of agile manufacturing such
as “co-operation,” “value-based pricing strategies,” “investments in people and information,”
Decision domain Related agile attributes
Integration 1. Concurrent execution of activities
2. Enterprise integration
3. Information accessible to employees
Competence 4. Multi-venturing capabilities
5. Developed business practice difficult to copy
Team building 6. Empowered individuals working in teams
7. Cross-functional teams
8. Teams across company borders
9. Decentralized decision making
Technology 10. Technology awareness
11. Leadership in the use of current technology
12. Skill and knowledge enhancing technologies
13. Flexible production technology
Quality 14. Quality over product life
15. Products with substantial value-addition
16. First-time right design
17. Short development cycle times
Change 18. Continuous improvement
19. Culture of change
Partnership 20. Rapid partnership formation
21. Strategic relationship with customers
22. Close relationship with suppliers
23. Trust-based relationship with customers/suppliers
Market 24. New product introduction
25. Customer-driven innovations
26. Customer satisfaction
27. Response to changing market requirements
Education 28. Learning organization
29. Multi-skilled and flexible people
30. Workforce skill upgrade
31. Continuous training and development
Welfare 32. Employees’ satisfaction
Source: Yusuf et al. (1999)
Table I.
List of agile
attributes and in
decision domains
204
BIJ
25,1
and “organizational changes” should be supported and integrated with appropriate agile
enablers to develop an adaptable organization. Gunasekaran’s (1998) study illustrates
the impact of agile enablers on agile attributes and how it can contribute to organizational
agility. Yet, the model was mainly conceptual and could not fully provide a practical basis
for companies to achieve agility. Later, two other seminal studies of Zhang and Sharifi
(2000) and Sharifi et al. (2001) contributed to the evolution of agility literature.
They developed a three-step approach to implement agility in manufacturing
organizations which links “agility drivers” to four overriding agile capabilities
(also known as agile attributes). In the final step, a set of viable tools, labeled as “agile
providers,” are described which guarantees the achievement of capabilities.
Some methodological studies in the context of agility investigate the impact of agility on
organizational performance. Jackson and Johansson (2003) proposed a three-step model for
analyzing the agility of production systems. Their methodology started by assessing the
degree of market turbulence to determine the relevance of agility in a specific context.
Then, by concentrating on the potentials to enhance flexibility and change, the strategic
view of the company was examined in order to achieve competitive advantage. Finally,
the agile attributes required for future were identified. The aim of their model was to
evaluate organizational performance against four main agile attributes: “product-related
change capabilities,” “change competency,” “co-operation,” and “people” to identify
the required improvements. The studies of Dowlatshahi and Cao (2005, 2006) explored the
impact of alignment between two agile enablers, namely, virtual enterprise and information
technology (IT) on the business performance of agile manufacturing in different industries.
In the same vein, Vázquez-Bustelo et al. (2007) provided empirical support for the linkage
between agility and business performance and showed that agility can become a critical
success factor (CSF) in different industrial fields in Spain. Furthermore, some other
methodological studies propose agility measurement models and then test it through
in-field applications or case studies (e.g. Lin et al., 2006; Ren et al., 2009; Bottani, 2009a).
Another stream of agility literature is devoted to deductive approaches and
methodologies based on empirics. Zhang and Sharifi (2007) provided a taxonomy of agility
strategies based on an empirical study in the UK. They categorized the companies into
three clusters, namely, quick, responsive, and proactive players, and investigated the main
characteristics of each cluster based on the typical agility drivers and attributes. Another
in-field analysis of agility was performed by Bottani (2009b) who studied two cases related
to agile manufacturing and assessed the current agility level of the studied companies.
Later, she conducted another empirical study (Bottani, 2010) to investigate the profile of
agile companies and the enablers practically adopted by them for achieving agility.
The findings offered a detailed description of the agile paradigm and suggested new
taxonomies for agile attributes and enablers. More recently, a stream of literature
has expanded agility to supply chain field (e.g. Gligor et al., 2015; Fayezi et al., 2015;
Kisperska-Moron and Swierczek, 2009). For example, in a relevant study to ours,
Kisperska-Moron and Swierczek (2009) explored the main agile attributes of supply
chain in Polish companies. Table II summarizes main agility methodologies and
conceptual studies in the pertinent literature.
One of the recent seminal agility methodologies has been proposed by Bottani (2009a).
According to the review of literature by that study, most of the previous methodological
studies about agility share a general structure:
(1) recognizing competitive bases by which organizations can develop competitive
advantage considering the specifications of the marketplace;
(2) identifying agile attributes boosting the recognized competitive bases; and
(3) applying agile enablers to achieve the essential agile attributes.
205
Organizational
agility
Objective
Applicabilityof
themethodologyMethodsandtechniquesMainidentifiedagilitymetrics
Findingsfromtheapplication
(ifany)
Gunasekaran
(1998)
Proposingaconceptual
frameworkforagile
manufacturinganddefiningkey
agileenablers
ManufacturingBusinessprocessredesign,legal
issues,concurrentengineering,
computerintegrated
manufacturing,cost
management,totalquality
management,andinformation
technology
Keyagileenablers,namely,
virtualenterprise,formation
tools/metrics,physically
distributedmanufacturing
architectureandteams,rapid
partnershipformationtools/
metrics,concurrentengineering,
integratedproduct/production/
businessinformationsystem,
rapidprototypingtools,and
electroniccommerce
Conceptualpaper–no
application
Zhangand
Sharifi(2000)
Proposingamethodologyfor
enhancingagilitybasedona
conceptualagilitymodel
ManufacturingDatadrivenAsetofagilitycapabilities
categorizedunderresponsiveness,
competency,flexibility,andspeed
aswellasagilityprovidersand
agilitydrivers
Validationoftheproposed
methodologybyindustrial
questionnairesurveysand
casestudies
Linetal.
(2006)
Proposinganagilitymodelfor
measuringandenhancing
supplychainagility
SupplychainFuzzylogicandmultiple-
criteriadecisionmaking
(MCDM)
Supplychainagilityattributes
categorizedundercollaborative
relationships,process
integration,information
integration,andcustomer/
marketingsensitivity
Validationoftheproposed
model,providingaholistic
pictureofsupplychainagility,
identifyingsupplychain
weaknesses,facilitatingquality
improvementinthesupplychain
Sherehiyetal.
(2007)
Conceptualreviewofagile
manufacturingandagile
workforcetoextendto
organizationalagility
Organizational
levelatall
domains
ExtensiveliteraturereviewKeyorganizationalagile
attributesnamelyflexibility,
responsiveness,speed,cultureof
change,integrationandlow
complexity,high-qualityand
customizedproducts,and
mobilizationofcore
competencies
Conceptualreview–no
application
(continued)
Table II.
Main conceptual and
methodological studies
in the agility literature
206
BIJ
25,1
Objective
Applicabilityof
themethodologyMethodsandtechniquesMainidentifiedagilitymetrics
Findingsfromtheapplication
(ifany)
Bottani
(2009a)
Proposingapracticalintegrated
methodologyforenhancing
agilitywhichlinkscompetitive
bases,agileattributes,and
agileenablers
Organizational
levelatall
domains
QFD,HOQ,andfuzzylogicCompetitivebases,agile
attributes,andagileenablers
Norealapplicationisprovided.
Anillustrativeexampleusing
thedatafromtheliteratureis
giventoshowtheapplicability
ofthemethodology
CurrentpaperProposingandapplyinga
practicalintegrated
methodologyforenhancing
agilitywhichlinkscompetitive
bases,agileattributes,agile
enablers,andimprovement
paths
Organizational
levelatall
domains
QFD,HOQ,fuzzylogic,
TOPSIS,andBSC
Competitivebases,agile
attributes,agileenablers,and
improvementpaths
Fullapplicationoftheproposed
methodologytoamulti-
nationalcompanyina
competitivefoodmarket
Table II.
207
Organizational
agility
Her study developed an integrated methodology for implementing agility. The procedure
was grounded in linking competitive bases, agile attributes, and agile enablers to identify,
depending on the competitive priorities of the market field, appropriate agile enablers each
company should exploit to achieve the required agile attributes. To this end, the author
applied house of quality (HOQ) which is the main component of quality function deployment
(QFD) methodology. The approach could be easily adopted by companies that are willing to
implement agile strategies.
The current study attempts to develop Bottani’s (2009a) methodology and shows its
applications by addressing its shortcomings and following the future research directions
introduced in that paper. Hence, this paper makes several contributions to the work
of Bottani (2009a) in specific and to the literature of agility in general. First, the study of
Bottani (2009a) leaves a void regarding the application of the methodology. Bottani’s
methodology consisted of two consecutive HOQs which ends up with providing agile
enablers resulting from the second HOQ. Identifying agile enablers leaves the practitioners
with the question of “how these agile enablers can practically lead to enhancing agility?”
Our methodology answers this concern by adding a third HOQ which identifies a set of
pivotal “improvement paths” that satisfy the identified agile enablers. Second, in the study
of Bottani (2009a), there was no systematic procedure to recognize and categorize CSFs of
the organization. To tackle this shortcoming, we have used a balanced scorecard (BSC) to
clearly classify KPIs under financial and non-financial organizational measures and
prioritize them accordingly in order to diagnose which are the most important ones for
organization’s success.
Third, by a successful application of the methodology in the competitive food industry,
this research transforms the methodology from purely theoretical to an empirically tested
one, as suggested in the future research directions of Bottani (2009a). Generally, the
field of organizational agility suffers from scarcity of empirical studies (Sherehiy et al., 2007).
Our empirical work contributes to the body of literature in the field of agility by
showing the applicability of the methodology in a highly competitive market. Fourth, our
implementation reveals the correlations between agile attributes, as well as agile enablers,
and improvement paths calculated in the roof of the HOQs. The literature scants
research that investigates the interrelation between agility metrics in a practical domain
(Bottani, 2009a). Our empirical results indicate that the correlations among agile attributes,
enablers, and improvement paths have significant impacts on the final scores of the HOQs.
This finding provides valuable insights for further analysis.
3. The proposed approach
The proposed approach in this study is grounded on the earlier study by Bottani (2009a).
The general procedure of the proposed methodology is described in the following. The
stages of the methodology and the methods used at each step are presented in Figure 1.
The methodology starts with defining the appropriate indicators for evaluating the
organizational performance. These indicators will be selected by means of comparing and
analyzing information obtained from first, mission, vision, and values (MVV), strategies,
and overall objectives of the company; and second, from a pool of indicators, which is
extracted from the existing literature of organizational performance assessment.
The company’s MVV, strategies, and overall objectives provide the criteria for short
listing and selecting the KPIs under four major perspectives inspired by BSC: financial,
customer, internal processes, and learning and growth. Then, the importance of each KPI
and the performance gap between the existing performance level and the desired one will be
measured based on the opinions of experts in the company by means of questionnaire
within a two-stage process. Criteria are prioritized not only based on the gap analysis, but
also their importance in order to ensure that both KPI’s performance gap and importance are
208
BIJ
25,1
taken into account. To this end, we have deployed fuzzy Technique for Order of Preference
by Similarity to Ideal Solution (TOPSIS), which is a well-known method in multiple-criteria
decision-making (MCDM), to rank all the indicators based on the “importance of the
indicator” and “level of performance gap.” As a rule of thumb, the upper quartile (the highest
25 percent of KPIs) is chosen as the CSFs of the company for achieving its strategic
objectives, since they all have high importance and yet large gaps in between their current
and desired performance levels. Nonetheless, the percentage of CSFs to be chosen out of
KPIs is relative to several issues such as top managers’ dedication and willingness, and
assigned budget, resources, and time.
Our methodology uses a sequence of HOQs, the main component of QFD. QFD has shown
to be a useful tool to facilitate strategic decision making especially when combined with fuzzy
logic to address uncertain, vague, or volatile environments. Fuzzy QFD has been used for
different purposes such as new product planning and design (Chen and Ko, 2009; Liu, 2009),
supplier selection (Lima-Junior and Carpinetti, 2016; Dursun and Karsak, 2013; Bevilacqua
et al., 2006), and strategic logistics management (Bottani and Rizzi, 2006). Coming to the
context of agility, it ensures that the right agility metrics in line with the marketing objectives
are selected which accordingly mitigate the risk of misalignment between the selected agility
metrics and organization core values. It also fills the missing link in the literature between the
“What” are the appropriate organizational capabilities and “How” they can be used to increase
Literature analysis
Forming the pool of
performance indicators
Categorizing the KPIs
Designing the questionnaire
for KPIs importance
Designing the questionnaire
for gap measurement
Ranking the KPIs
Developing the first HOQ to
select agile attributes
Developing the second HOQ
to select agile enablers
BSC
Fuzzy-Likert scale
Fuzzy TOPSIS
Fuzzy QFD
Fuzzy-Likert scale
Stages Methods
Stage 1:
identifying
main KPIs
Stage 2:
KPIs ranking
Stage 3:
opting
improvement
paths
Developing the third HOQ to
select improvement paths
Fuzzy QFD
Fuzzy QFD
Figure 1.
The structure of the
proposed approach
209
Organizational
agility
competitiveness and efficiency (Koskinen, 2014). In our first HOQ, CSFs are satisfied using
relevant agile attributes. In the second HOQ, the most important agile attributes resulted from
the first HOQ are linked with agile enablers. Finally, in the third HOQ, agile enablers are
achieved through a set of improvement paths (Figure 2). Since one of our contributions is
adding a new HOQ to identify improvement paths, the processes of the third HOQ are
explained in more detail. For an elaborate reading on the processes of the first two HOQs,
readers are directed to Bottani (2009a). As shown in Figure 2, the proposed approach requires
building three HOQs. The structure of these houses is shown in Figure 3.
The third HOQ has a structure similar to the first two HOQs and aims to identify the most
critical improvement paths to achieve agile enablers swiftly. Agile enablers are placed in the
“Whats” column (AEk, k ¼ 1, …, p), while improvement paths are located in the “Hows” row
(IPd, d ¼ 1, …, g). Then, by considering the relationship between agile enablers (AEk) and
improvement paths (IPd) denoted by (Rkd). As well as the correlation between the dth and the
d0
th improvement path denoted by (Tdd0), the relative importance (RId) and the final score of
each improvement path (scored) can be calculated according to the following equations:
RId ¼
Xp
k¼1
Wk  Rkd d ¼ 1; . . .; g (1)
scored ¼ RId þ
X
d0
ad
Tdd0 Â RId0 d ¼ 1; . . .; g (2)
Finally, using the following equation, the fuzzy scores of the improvement paths are
converted into non-fuzzy figures and used for prioritizing the improvement paths:
crisp value ¼
l þ2mþu
4
(3)
Therefore, the output of the current method is a collection of the most pivotal improvement
paths, ranked based on their relative priority and importance in budget allocation and
implementation. These improvement paths are developed in line with the four perspectives
of BSC to achieve CSFs. Using the proposed methodology enhances the agility of an
Identifying agile enablers to
achieve agile attributes
Identifying agile attributes
enhancing CSFs
Identifying and selecting CSFs
Determining improvement
paths to achieve agile enablers
Third HOQ
“Whats”: agile enablers
“Hows”: improvement paths
Second HOQ
“Whats”: agile attributes
“Hows”: agile enablers
First HOQ
“Whats”: CSFs
“Hows”: agile attributes
Figure 2.
The four-step
methodological
approach for
achieving
organizational agility
210
BIJ
25,1
organization and enables it to identify, understand, and predict changes in the business and
market environment to react quickly to these changes creating a competitive advantage for
the organization.
4. The empirical investigation
4.1 Description of the case
Food industry was selected as the case of this paper due to its highly competitive environment,
significant effect on GDP, and its major role on national employment level. The research
approach was based on in-field analysis and the selected case was a company called Nutricia
MMP, an affiliation of Group DANONE, a globally high-ranked leader in the food industry. The
company’s mission is “to bring health through food to the largest number of people possible.”
Correlation matrix Tdd’
Relationship matrix (Rkd
)
Relative importance of IP (RId)
Ranking of IP (scored
)
Improvement paths (IPd
)
Importanceweight(Wk
)
Agileenablers(AEk
)
Correlation matrix Tkk’
Relationship matrix (Rjk
)
Relative importance of AE (RIk
)
Agile enablers (AEk
)
(Wj
)Importanceweight
Agileattributes(AAj
)
Ranking of AE (scorek
)
Correlation matrix Tjj’
Agile attributes (AAj
)
Relationship matrix (Rij
)
Relative importance of AA (RIj
)
Ranking of AA (scorej
)
(Wi
)Importanceweight
(CSFi
)
Figure 3.
The structure
of HOQs
211
Organizational
agility
The company is specialized in baby nutrition such as infant milk powders and its factory site is
located in the city of Mashhad, Iran. The factory operates to the highest of quality standards and
has recently been selected as a benchmark for the province of Khorasan Razavi by the Ministry
of Health and the Institute of Standards.
4.2 Questionnaires’ contents and data collection process
The required data for this study were collected through two questionnaires: questionnaire
(1) for identifying the major performance measurement indicators and their importance, and
questionnaire (2) for measuring the gap between actual and desired levels of agility for each
indicator. Both questionnaires were returned to the research team after being answered by
the experts (100 percent response rate). No missing or incomplete data were observed and all
the collected responses were used for the analysis. Moreover, in this study, we have
considered two groups as “experts”: first, all top and middle managers of the subject
company; and second, academic researchers and university lecturers holding a PhD in
management with relevant research experience in organization agility.
The purpose of developing questionnaire (1) was to identify the major performance
measurement indicators of the company in order to access its strategic goals. Therefore,
based on the review of the relevant literature on performance measurement of food producing
industries, a number of suitable indicators were extracted to form questionnaire (1). Then the
questionnaire was given to the experts for validation. After making necessary amendments,
the questionnaire was confirmed. The final performance measurement indicators used in
questionnaire (1) are shown in Figure 4.
In order to consider the importance of each indicator in questionnaire (1), a five-point
Likert scale was applied ranging from “the least important” to “very important.”
Totally, there were 45 questions divided into four sections. After collecting the responses
from the experts of the company, all the questionnaires were sent to the CEO of the company
to score the questionnaires (i.e. from 1 to 10) based on the managers’ experience and
expertise in the “CEO Score” section of the questionnaire. The CEO score in fact shows the
importance of respondent’s ideas. For instance, the CEO might be willing to outweigh the
responses of a department manager over a supervisor. The questionnaires were then
submitted to the research team and with the information collected from the questionnaire (1),
questionnaire (2) was developed. The ranges of responses for both questionnaires
were designed based on the fuzzy numbers introduced by Cheng et al. (1999). The value of
these fuzzy numbers and their linguistic expressions are presented in Table III.
To enhance the accuracy, at the end of each section in questionnaire (1) there was a section
for the experts to list the missing indicators which they think as important for the success of
their organization. As such, apart from the existing indicators in the questionnaire, some
indicators were proposed by the experts. After eliminating rather-identical indicators, the final
indicators were constructed. They are illustrated in Figure 5.
The new proposed indicators were included in questionnaire (2) to let the other experts
not only rank the importance of the indicators but also identify the gap between the current
situation and the optimal situation of the indicators. A five-point Likert scale, similar to
questionnaire (1), was applied to questionnaire (2) as depicted in Table III. To identify the
level of current performance and the level of optimal performance of each indicator, a range
of [0, 4] was applied. To convert each number to its fuzzy equivalent, the range proposed by
Cheng et al. (1999) was used which is shown in Table IV.
4.3 Examining the validity and reliability of questionnaires
Validity of the questionnaire determines to what extent the instrument can measure the specific
concept (Rasouli and Zarei, 2016). In other words, whether an instrument measures the specific
concept is determined by testing its validity. Since the previous studies in the literature were
considered in developing the questionnaire, and also experts’ opinions were taken into
212
BIJ
25,1
consideration to validate the questionnaire, the validity of the research instrument was confirmed
by experts.
One of the established techniques to assess the reliability is Cronbach’s α obtained from
the following equation:
a ¼
n
nÀ1
1À
P
S2
i
S2
t
!
(4)
1. Sales growth rate (Kuo and chen, 2008)
2. Return on Investment (ROI) (Wu et al., 2011)
3. Profit growth rate (Kuo and chen, 2008)
4. Business revenue (Kuo and chen, 2008)
5. Return on assets (Kuo and chen, 2008)
6. Cash flow (Yüksel and Dağdeviren, 2010)
7. Net profit (Wu et al., 2011)
8. Cost control (Wu et al., 2011)
9. Budget control (Wu et al., 2011)
10. Sale profitability (Yüksel and Dağdeviren, 2010)
11. Assets profitability (Yüksel and Dağdeviren, 2010)
12. Equity profitability (Yüksel and Dağdeviren, 2010)
13. New client development cost (Kuo and chen, 2008)
14. Turnover volume (total amount of sales income) (Wu et al., 2011)
15. Productivity (ratio of inputs (total investment) and outputs (total revenue)) (Wu et al., 2011)
16. Volume of Investment compared with the best competitors
1. Customer satisfaction (Wu et al., 2011)
2. Customer retention (Yüksel and Dağdeviren, 2010)
3. Market share (Wu et al., 2011)
4. Product/service quality (Wu et al., 2011)
5. Marketing effectiveness (Kuo and chen, 2008)
6. Flexibility of sale and service system (Wu et al., 2011)
7. Corporate and reputation Image (Wu et al., 2011)
8. Product price competitiveness
1. Product and service development (Yüksel and Dağdeviren, 2010)
2. Manufacturing process (Yüksel and Dağdeviren, 2010)
3. Product delivery (Yüksel and Dağdeviren, 2010)
4. New technologies (Yüksel and Dağdeviren, 2010)
5. On time rate of completing projects (Lee et al., 2008)
6. Goal achievement rate (Kuo and chen, 2008)
7. Standard operating procedures (SOP) (Wu et al., 2011)
8. Increasing administration efficiency (Wu et al., 2011)
9. Effectiveness and efficiency in processes and methods
10. Developing electronic form of processing methods
1. Training and skill (Yüksel and Dağdeviren, 2010)
2. Knowledge sharing (Yüksel and Dağdeviren, 2010)
3. Employees’ productivity (Wu et al., 2011)
4. Employees’ satisfaction (Cebeci, 2009)
5. Employee professionalism (Kuo and chen, 2008)
6. Communication channel (Kuo and chen, 2008)
7. Encouraging methods (Wu et al., 2011)
8. Teamwork and Cross-functional teams
9. Establishment of a learning-oriented organization (Kuo and chen, 2008)
10. Level of staff commitment to the aims of the organization
11. Optimizing human resource planning and maintaining system
Financial
perspective
Customer
perspective
Key performance
indicators (KPIs)
of balanced
scorecards
Internal
process
perspective
Learning and
growth
perspective Figure 4.
Performance
measurement
indicators applied
in questionnaire (1)
213
Organizational
agility
where St is the overall variance; n the number of questions of the questionnaire; and Si the
variance of the ith question. The value of α would range between −1 and 1. The closer the
value to 1, the higher reliability the questionnaire has. After collecting the data, SPSS
computer software was used to measure the Cronbach’s α for each perspective separately.
The results are presented in Table V.
The integrated value of Cronbach’s α for the questionnaire was equal to 0.951. Since the
value of Cronbach’s α coefficient exceeded the threshold of 0.7, the reliability of the
questionnaire was confirmed.
4.4 Agile attributes and enablers used for the case
In order to enhance the compatibility of the research with real-life conditions and enhance
the methodology efficiency, it is recommended to triangulate from multiple sources for
Linguistic expression Fuzzy number
Very low (VL) (0.25: 0: 0)
Low (L) (0.5: 0.25: 0)
Medium (M) (0.75: 0.5: 0.25)
High (H) (1: 0.75: 0.5)
Very high (VH) (1: 1: 0.75)
Source: Cheng et al. (1999)
Table III.
The value of fuzzy
numbers applied in
the questionnaire
Financial
perspective Cash management
Export and business development
Credibility
R&D – innovation
Performance-oriented culture
Customer
perspective
KPIs introduced
by experts of the
firm
Internal
process
perspective
Learning and
growth
perspective
Figure 5.
Performance
measurement
indicators proposed
by the experts of the
respective company
Euclidean gap Equivalent fuzzy number
0 (0.25: 0: 0)
1 (0.5: 0.25: 0)
2 (0.75: 0.5: 0.25)
3 (1: 0.75: 0.5)
4 (1: 1: 0.75)
Table IV.
Euclidean gap of
each indicator and
its fuzzy number
214
BIJ
25,1
identifying organizational agile attributes and enablers. In this research, the first source
included past research studies in the field and the second source involved analyzing the
existing organizational information, as well as the analysis of market and competitors.
Upon discussion with experts, the set of 32 agile attributes proposed by Yusuf et al. (1999)
was determined to have comprehensiveness and decided to be used in the current study.
To select agile enablers, six items from the set of enablers proposed by Gunasekaran (1998)
and Gunasekaran and Yusuf (2002) were used, which comprise of supply chain management,
project management, team building, knowledge management, simultaneous engineering, and
IT. Besides, in a research by Bottani (2010), 18 items were introduced as agile enablers in food
industry, out of which 7 new enablers were selected for the current study based on the expert
opinions. Figure 6 depicts the agile enablers used in the current study.
4.5 Findings
4.5.1 KPIs ranking. Upon identifying the importance level of each indicator using
questionnaire (1), and gap analysis of each indicator using questionnaire (2), all the indicators
were ranked according to their importance as well as the result of gap analysis using fuzzy
TOPSIS. The hierarchical structure of the decision-making problem is depicted in Figure 7.
Perspectives Number of items Cronbach’s α coefficient
Financial 16 0.899
Customer 8 0.780
Internal processes 10 0.795
Learning and growth 11 0.928
Table V.
Cronbach’s α
coefficient calculated
for different BSC
perspectives in
the questionnaire
Enablers
introduced by
experts of the
firm
Flexible manufacturing systems (FMS)
or flexible assembly systems (FAS)
Intranet connection
Extranet connections with networked
companies
Total quality management (TQM)
systems
Enterprise resource planning (ERP)
systems
Time-value analysis techniques
Management information systems
(MIS)
Figure 6.
Proposed agile
enablers
215
Organizational
agility
By applying TOPSIS, the final ranking of the performance indicators, shown in Table VI,
was made based on the closeness coefficient to the ideal solution (CCi).
This ranking revealed the CSFs for the studied organization. These factors were regarded as
the initial input for the first HOQ which can be achieved through agile attributes. Capabilities
with the highest crisp scores were the inputs for the second HOQ where they were empowered
and achieved through agility enablers. In a similar vein, enablers with the highest crisp scores
were moved to the third HOQ where they were gained through a series of improvement paths.
It is for sure favorable to remove the gap of all indicators; however, considering the time
and amount of resources assigned for the improvement at the time the study was being
conducted, the first quartile of indicators was chosen as CSFs (Figure 8).
4.5.2 The first HOQ. In order to calculate the fuzzy weight for each CSF, shown in
Table VII, the importance level of Wi was multiplied by its pertaining gap. It should
Importance
(of each KPI)
Gap
(of each KPI)
KPIs
Ranking
Learning and growth
perspective
Internal process
perspective
Customer
perspective
Financial
perspective
1. Sales growth rate
2. Return on investment
(ROI)
3. Profit growth rate
4. Business revenue
5. Return on assets
6. Cash flow
7. Net profit
8. Cost control
9. Budget control
10. Sale profitability
11. Assets profitability
12. Equity profitability
13. New client
development cost
14. Turnover volume
15. Productivity
16. Volume of
Investment compared
with the best
competitors
17. Cash management
1. Customer satisfaction
2. Customer retention
3. Market share
4. Product/service
Quality
5. Marketing
effectiveness
6. Flexibility of sale and
service system
7. Corporate and
reputation image
8. Product price
competitiveness
9. Credibility
10. Export and business
development
1. Product and service
development
2. Manufacturing
process
3. Product delivery
4. New technologies
5. On time rate of
completing projects
6. Goal achievement
rate
7. Standard operating
procedures (SOP)
8. Increasing
administration
efficiency
9. Effectiveness and
efficiency in
processes and
methods
10. Developing
Electronic form of
processing methods
11. R&D – innovation
1. Training and skill
2. Knowledge sharing
3. Employee
productivity
4. Employee satisfaction
5. Employee
professionalism
6. Communication
channel
7. Encouraging methods
8. Teamwork and Cross-
functional teams
9. Establishment of a
learning-oriented
organization
10. Level of staff
commitment to the
aims of the
organization
11. Optimizing human
resource planning and
maintaining system
12. Performance-oriented
culture
Figure 7.
Hierarchical structure
of the decision-making
problem using fuzzy
TOPSIS
216
BIJ
25,1
be noted that both figures are fuzzy and the result of multiplication is accordingly a
fuzzy number.
The evaluation of the impacts of agile attributes on CSFs in the relationship matrix of
the first HOQ required experts’ opinions from academia and industry. The opinions were
Rank KPI CCi Perspective Rank KPI CCi Perspective
1 Net profit 0.712 Financial 26 Sales growth rate 0.576 Financial
2 Cash flow 0.708 Financial 27 Budget control 0.573 Financial
3 Market share 0.660 Customer 28 Customer retention 0.571 Customer
4 Profit growth rate 0.657 Financial 29 Return on investment (ROI) 0.562 Financial
5 Employee productivity 0.649 Learning
and growth
30 Goal achievement rate 0.559 Internal
Process
6 Communication channel 0.634 Learning
and
Growth
31 Optimizing human resource
planning and maintaining
system
0.553 Learning
and
Growth
7 Level of staff
commitment to the aims
of the organization
0.632 Learning
and growth
32 Performance-oriented
culture
0.552 Learning
and growth
8 Knowledge sharing 0.628 Learning
and growth
33 Assets profitability 0.548 Financial
9 Training and skill 0.625 Learning
and growth
34 Marketing effectiveness 0.547 Customer
10 Cash management 0.624 Financial 35 Flexibility of sale and
service system
0.544 Customer
11 Teamwork and
cross-functional teams
0.622 Learning
and growth
36 Turnover volume 0.541 Financial
12 Customer satisfaction 0.605 Customer 37 Return on assets 0.540 Financial
13 Business revenue 0.605 Financial 38 Manufacturing process 0.540 Internal
process
14 Sale profitability 0.602 Financial 39 Product delivery 0.539 Internal
process
15 Credibility 0.600 Customer 40 Product and service
development
0.532 Internal
process
16 Employee
professionalism
0.597 Learning
and growth
41 Ontime rate of completing
projects
0.527 Internal
process
17 Employee’s satisfaction 0.596 Learning
and growth
42 Equity profitability 0.520 Financial
18 Establishment of a
learning-oriented
organization
0.595 Learning
and growth
43 Product price
competitiveness
0.514 Customer
19 Encouraging methods 0.594 Learning
and
Growth
44 Standard operating
procedures (SOP)
0.511 Internal
process
20 Cost control 0.588 Financial 45 Effectiveness and efficiency
in processes and methods
0.506 Internal
process
21 Export and business
development
0.588 Customer 46 Developing electronic form
of processing methods
0.495 Internal
process
22 R&D – innovation 0.586 Internal
process
47 Increasing administration
efficiency
0.473 Internal
process
23 Productivity 0.584 Financial 48 Volume of Investment
compared with the best
competitors
0.468 Financial
24 Product/Service quality 0.579 Customer 49 New client development
cost
0.456 Financial
25 Corporate and reputation
Image
0.576 Customer 50 New technologies 0.441 Internal
process
Table VI.
Final ranking of
performance
indicators
217
Organizational
agility
narratively obtained through phone interviews and then were converted into their fuzzy
equivalents. In order to enhance the accuracy of HOQs, the opinions were gathered from
three key groups, comprising of managers and experts at the case organization,
university professors with research experience in organizational agility, and active
researchers in the field.
Since the set of agile attributes in this study includes 32 components, evaluating their
correlations was complicated as it required 496 paired comparisons. In order to tackle the
complexity, this step was simplified by categorizing and ranking the agile enablers
according to the findings of Yusuf et al. (1999) advocated by Bottani (2009a). In that
classification, the studies that indicate correlations between different decision domains were
found according to the survey of literature. These studies are shown in Table VIII.
0.54
0.56
0.58
0.6
0.62
0.64
0.66
0.68
0.7
0.72
N
etprofit
Cash
flow
M
arketshare
Profitgrow
th
rate
Em
ployeeproductivity
Com
m
unication
channel
Financial perspective
Customer perspective
Internal process perspective
Learning and growth perspective
Levelofstaffcom
m
itm
entto
theaim
s
oftheorganization
K
now
ledgesharingTraining
and
skill
Cash
m
anagem
ent
Team
w
ork
and
cross-functionalteam
s
Custom
ersatisfaction
Businessrevenue
Figure 8.
The identified CFSs
CSFi Wi
Net profit 0.25 0.58 0.89
Cash flow 0.24 0.56 0.83
Market share 0.15 0.45 0.70
Profit growth rate 0.17 0.46 0.75
Employee productivity 0.17 0.45 0.75
Communication channel 0.12 0.40 0.67
Level of staff commitment to the aims of the organization 0.12 0.40 0.67
Knowledge sharing 0.14 0.40 0.71
Training and skill 0.15 0.39 0.69
Cash management 0.13 0.40 0.69
Teamwork and cross-functional teams 0.13 0.40 0.69
Customer satisfaction 0.07 0.33 0.59
Business revenue 0.11 0.35 0.64
Table VII.
CSFs and their
fuzzy weights
218
BIJ
25,1
DD1DD2DD3DD4DD5DD6DD7DD8DD9DD10
DD1Prahaladand
Hamel(1990)
Goldmanetal.
(1995)
Goldmanand
Nagel(1993)
Yusufetal.(1999)and
Youssef(1992)
Goldmanand
Nagel(1993)
Corbettand
Rastrick(2000)
DD2Higginsand
Maciariello(2004)
Yusufetal.(1999),
Kidd(1994)
Prahaladand
Hamel(1990)
Jacob
(2006)
Prahaladand
Hamel(1990)
Kidd(1994)
DD3KathuriaandDavis
(1999)
Lakemondand
Berggren(2006)
Higginsand
Maciariello(2004)
DD4Messeretal.(2006)
DD5JungandWang
(2006)
Corbettand
Rastrick(2000)
DD6Earleetal.(2006)
DD7Drogeetal.(2004)
DD8
DD9Kidd
(1994)
DD10
Notes:DD1:integration;DD2:competence;DD3:teambuilding;DD4:technology;DD5:quality;DD6:change;DD7:partnerships;DD8:market;DD9:education;
DD10:welfare
Source:Bottani(2009a)
Table VIII.
Correlations between
decision domains
resulting from
literature analysis
219
Organizational
agility
Each of the studies shown in Table VIII indicates the correlations between two specific
decision domains. They were used as the basis to derive the correlations required for the
roof of our HOQs. The table was also used as a guide for the experts such that by presenting
the highlights of studies indicated in Table VIII, the nature of correlations between decision
domains was clarified for the experts. Then, they were asked to express their own opinions
about the strength of correlations between the agile attributes in the roof of the first HOQ.
Thus, the roof in the first HOQ was completed as shown in Figure 9.
Next, using equations similar to Equations (1) and (2), the relative importance
(RIj, j ¼ 1, 2, …, 32) and the score (scorej) of each agile attributes were calculated. Results of
these calculations are presented in the last row of Figure 9.
Several results can be deducted from Figure 9. First, it shows that the agile enablers
under competence (DD2) achieved the highest crisp scores, followed by market (DD8),
education (DD9), and integration (DD1) respectively. These results were achieved due to the
high correlations between the aforementioned DDs and other DDs. Specifically, there was a
high correlation between competence (DD2) and quick response to market (DD8), and also
the education of personnel (DD9). Second, competence (DD2) could be empowered and
enhanced through integration (DD1) and applying the culture of change (DD6). Finally, team
building for product development (DD3) and quality (DD5), which both are involved in
developing and manufacturing products to meet customers’ expectations, as well as
software and hardware technology (DD4), and partnership with suppliers and customers
(DD7) were also recognized as overriding attributes to enhance organizational competence.
The ranking of agile attributes was estimated based on their crisp scores shown in Table IX.
4.5.3 The second HOQ. In order to form the second HOQ, either all the agile attributes or
the ones with the highest crisp scores can be moved from the first HOQ based on the time
and resources assigned for the improvement. In this case study, all agile attributes
presented in the first HOQ were listed under the “whats” column in the second HOQ to
illustrate a comprehensive implementation of the methodology. For estimating the weight of
agile attributes, the respective normalized scores in the penultimate row of the first HOQ
were used. Normalization was done by dividing the fuzzy score of each capability (scorej) by
the highest score (related to multi-venturing capabilities). Therefore, as shown in Figure 10
(the second HOQ), the agile attributes and their normalized weights are listed in the first and
second columns of the second HOQ, respectively.
In order to measure the correlations among the agile enablers in the roof of the second
HOQ, prior literature was consulted. Since the existing research in this area is limited,
merely some of the correlations among the agile enablers were identified. The studies
indicating correlations are shown in Table X.
Based on the results of the relationship matrix in Figure 10 and experts’ opinions, the
roof of the second HOQ was formed. Numerical results extracted from Figure 10 shows that
IT (AE6) had the highest crisp score due to frequent and high correlations with other agile
enablers as well as strong relations with some agile attributes. Therefore, it had the priority
for enhancing organizational agility, followed by management information systems (MISs)
(AE13) and supply chain management (AE1). The ranking of agile enablers based on their
crisp scores is shown in Table XI.
4.5.4 The third HOQ. Similar to the procedure of previous HOQs, all agile enablers were
moved from the second HOQ to the third HOQ and listed under the “whats” column to enhance
the process accuracy. Similar to the first HOQ, the estimation of the weights for agile enablers was
made by using the normalized scores in the penultimate row of the second HOQ. The normalized
score was calculated by dividing the fuzzy score of each enabler (scorek) by the highest score
(related to IT). Therefore, as shown in Figure 11 (the third HOQ), the agile enablers and their
normalized weights are listed in the first and second columns of the third HOQ, respectively.
220
BIJ
25,1
IntegrationCompetenceTeambuildingTechnologyQualityChangePartnershipMarketEducationWelfare
CriticalSuccessFactor
(CSFi)
Weight
(Wi)
Concurrent execution of activities
Enterprise Integration
Information accessible to employees
Multi-venturing capabilities
Developed business practice difficult to copy
Empowered individuals working in teams
Cross-functional teams
Teams across company borders
Decentralized decision making
Technology awareness
Leadership in the use of current technology
Skill and knowledge enhancing technologies
Flexible production technology
Quality over product life
Products with substantial value-addition
First-time right design
Short development cycle times
Continuous improvement
Culture of change
Rapid partnership formation
Strategic relationship with customers
Close relationship with suppliers
Trust-based relationship with customers/suppliers
New product introduction
Customer-driven innovations
Customer satisfaction
Response to changing market requirements
Learning organization
Multi-skilled and flexible people
Workforce skill upgrade
Continuous training and development
Employees satisfaction
Netprofit(0.25,0.58,0.89)WWSMWWWSWMMSMMWMMMWMSSMWMWW
Cashflow(0.24,0.56,0.83)MWSMWWMWMMSSMMWWWMMSMWW
Marketshare(0.15,0.45,0.70)WWSSMWWSSWSSSMWMWSMSSSSSMWWW
Profitgrowthrate(0.17,0.46,0.75)WWSSWSSWMMMMMWMMWWMSSWMM
Employeeproductivity(0.17,0.45,0.75)WMMSMMMWMMMMSSWMMSSSS
Communicationchannel(0.12,0.40,0.67)MMMWMMWWMWWWSSWMWWW
Levelofstaffcommitment
totheaimsofthe
organization
(0.12,0.40,0.67)MWSSMWMWMMWSSMMMMMMMWMSS
Knowledgesharing(0.14,0.40,0.71)WSWWMMMSMMMWMSWMM
Trainingandskill(0.15,0.39,0.69)MWMSSWWWSWSMMSMWWMMSMSS
Cashmanagement(0.13,0.40,0.69)SSMMWMMWM
Teamworkandcross-
functionalteams
(0.13,0.40,0.69)SMWWMSSSWMMMMSWMMMWMW
Customersatisfaction(0.07,0.33,0.59)WMSMSSMWWMSSMSSSMMWW
Businessrevenue(0.11,0.35,0.64)WWSWWSWMMSWSSMWMMMWMSSWWWW
RIj
(0.28,
1.27,
3.80)
(0.17,
0.80,
3.21)
(0.23,
1.02,
2.31)
(0.74,
2.81,
5.20)
(0.51,
2.06,
4.02)
(0.47,
2.06,
4.48)
(0.17,
0.82,
2.77)
(0.22,
1.02,
2.81)
(0.16,
0.83,
2.37)
(0.33,
1.47,
4.10)
(0.64,
2.54,
4.57)
(0.35,
1.74,
5.08)
(0.39,
1.79,
3.98)
(0.67,
2.96,
5.85)
(0.63,
2.50,
4.17)
(0.49,
2.09,
4.77)
(0.28,
1.15,
2.76)
(0.56,
2.49,
5.93)
(0.44,
1.97,
4.14)
(0.17,
0.79,
2.47)
(0.31,
1.47,
3.34)
(0.32,
1.51,
4.18)
(0.42,
2.05,
4.67)
(0.20,
0.90,
2.38)
(0.50,
2.36,
4.61)
(0.77,
3.12,
5.76)
(0.80,
3.46,
6.59)
(0.47,
2.09,
5.47)
(0.27,
1.24,
4.18)
(0.37,
1.52,
3.61)
(0.47,
2.06,
5.14)
(0.20,
0.85,
2.08)
Scorej
(1.27,
16.94,
58.35)
(1.15,
16.47,
57.77)
(1.22,
16.69,
56.86)
(1.90,
21.49,
72.49)
(1.67,
20.74,
71.31)
(0.95,
13.94,
48.66)
(0.65,
12.70,
46.95)
(0.69,
12.90,
46.99)
(0.64,
12.71,
46.55)
(0.53,
12.12,
42.88)
(0.84,
13.18,
43.35)
(0.56,
12.38,
43.85)
(0.60,
12.43,
42.75)
(0.67,
13.98,
47.89)
(0.63,
13.51,
46.21)
(0.49,
13.11,
46.81)
(0.28,
12.16,
44.79)
(1.24,
14.97,
48.27)
(1.12,
14.45,
46.48)
(0.85,
8.59,
26.83)
(0.99,
9.27,
27.70)
(1.00,
9.31,
28.54)
(1.10,
9.85,
29.03)
(1.23,
17.77,
63.85)
(1.54,
19.23,
66.08)
(1.81,
19.99,
67.24)
(1.84,
20.33,
68.06)
(1.35,
17.85,
60.53)
(1.15,
17.00,
59.24)
(1.26,
17.29,
58.67)
(1.36,
17.83,
60.20)
(0.20,
2.92,
11.28)
Normalizedvalues
(0.02,
0.79,
30.78)
(0.02,
0.77,
30.47)
(0.02,
0.78,
29.99)
(0.03,
1.00,
38.24)
(0.02,
0.97,
37.61)
(0.01,
0.65,
25.67)
(0.01,
0.59,
24.77)
(0.01,
0.60,
24.79)
(0.01,
0.59,
24.55)
(0.01,
0.56,
22.62)
(0.01,
0.61,
22.86)
(0.01,
0.58,
23.13)
(0.01,
0.58,
22.55)
(0.01,
0.65,
25.26)
(0.01,
0.63,
24.37)
(0.01,
0.61,
24.69)
(0.00,
0.57,
23.62)
(0.02,
0.70,
25.46)
(0.02,
0.67,
24.52)
(0.01,
0.40,
14.15)
(0.01,
0.43,
14.61)
(0.01,
0.43,
15.05)
(0.02,
0.46,
15.31)
(0.02,
0.83,
33.68)
(0.02,
0.89,
34.86)
(0.02,
0.93,
35.46)
(0.03,
0.95,
35.90)
(0.02,
0.83,
31.93)
(0.02,
0.79,
31.25)
(0.02,
0.80,
30.95)
(0.02,
0.83,
31.75)
(0.00,
0.14,
5.95)
Crispvalues23.3722.9622.8629.3428.6119.3718.2518.3718.1516.9117.6417.2917.0519.1318.4718.3817.3519.8619.1311.2111.8112.0412.4625.1626.5227.2627.6424.4023.6023.6324.304.33
SP
SP
P
P
P
P
P
P
P
P
P
P
SP
SP
P
P
P
P
P
P
P
P
SP
SP
SP
P
P
P
Notes:S,strong;M,medium;W,weak;SP,strongpositive;P,positive;N,negative;SN,strongnegative
Figure 9.
The first HOQ
221
Organizational
agility
In order to identify the most crucial improvement path for achieving agile enablers, opinions
from university and industry experts in the fields of production and operation management, IT,
and knowledge management were obtained. Each of the improvement paths was then developed
and proposed in accordance with the current organizational progress in the pertaining area.
The numerical results shown in Figure 11 indicate that “planning for obtaining
international business excellence awards” achieved the highest crisp score due to its
frequent and high correlations with other improvement paths as well as its strong relations
with some of the agile enablers. It is therefore the improvement path with the highest
priority, followed by “development and integration of functional applications in main areas
of organization” and “provision of enterprise resource planning (ERP) infrastructure.”
The ranking of improvement paths based on their crisp scores of the implementation
infrastructures is shown in Table XII. The table shows the suggestions by the academic
lecturers for improving the organization performance.
5. Discussion and limitations
This section discusses the findings from the application of our proposed methodology.
Then, we move to the limitations of our work suggesting the future research directions.
We start with elucidating the main findings of our study: looking at CSFs (Figure 8), out of
13 CSFs, 6 of them were related to “Learning and Growth” perspective, 5 of them to
Rank Agile attributes Decision domain Crisp score
1 Multi-venturing capabilities Competence 29.34
2 Developed business practice difficult to copy Competence 28.61
3 Response to changing market requirements Market 27.64
4 Customer satisfaction Market 27.26
5 Customer-driven innovations Market 26.52
6 New product introduction Market 25.16
7 Learning organization Education 24.40
8 Continuous training and development Education 24.30
9 Workforce skill upgrade Education 23.63
10 Multi-skilled and flexible people Education 23.60
11 Concurrent execution of activities Integration 23.37
12 Enterprise integration Integration 22.96
13 Information accessible to employees Integration 22.86
14 Continuous improvement Change 19.86
15 Empowered individuals working in teams Team building 19.37
16 Quality over product life Quality 19.13
17 Culture of change Change 19.13
18 Products with substantial value-addition Quality 18.47
19 First-time right design Quality 18.38
20 Teams across company borders Team building 18.37
21 Cross-functional teams Team building 18.25
22 Decentralized decision making Team building 18.15
23 Leadership in the use of current technology Technology 17.64
24 Short development cycle times Quality 17.35
25 Skill and knowledge enhancing technologies Technology 17.29
26 Flexible production technology Technology 17.05
27 Technology awareness Technology 16.91
28 Trust-based relationship with customers/suppliers Partnership 12.46
29 Close relationship with suppliers Partnership 12.04
30 Strategic relationship with customers Partnership 11.81
31 Rapid partnership formation Partnership 11.21
32 Employees’ satisfaction Welfare 4.33
Table IX.
Ranking of the agile
attributes according
to crisp scores
222
BIJ
25,1
“Financial” perspective, and 2 of them are related to “Customer” perspective. High number
of CSFs related to “Learning and Growth” perspective states that human resource
management should become the foci of the company. Bringing issues such as employees’
training, knowledge and skills, motivation, and productivity to the center of attention
propels the company toward achieving its strategic goals and benefitting from a higher level
Agile attributes (AAj) Weight (Wj)
Supplychainmanagement
Projectmanagement
Teambuilding
Knowledgemanagement
Concurrentengineering
Informationtechnology(IT)
Flexiblemanufacturingsystems(FMS)or
flexibleassemblysystems(FAS)
Intranetconnection
Extranetconnectionswithnetworked
companies
Totalqualitymanagement(TQM)systems
Enterpriseresourceplanning(ERP)
systems
Time-valueanalysistechniques
Managementinformationsystems(MIS)
Concurrent execution of
activities
(0.02, 0.79, 30.78) W M S S S S M M S
Enterprise integration (0.02, 0.77, 30.47) M M M S S S M S W S
Information accessible to
employees
(0.02, 0.78, 29.99) W M W S S S M S
Multi-venturing
capabilities
(0.03, 1.00, 38.24) S S M W M M M M M W W S
Developed business
practice difficult to copy
(0.02, 0.97, 37.61) M W W W M M
Empowered individuals
working in teams
(0.01, 0.65, 25.67) S S
Cross-functional teams (0.01, 0.59, 24.77) W M S M M
Teams across company
borders
(0.01, 0.60, 24.79) M W S W W W S W W
Decentralized decision
making
(0.01, 0.59, 24.55) M S M M S S
Technology awareness (0.01, 0.56, 22.62) M S W S M
Leadership in the use of
current technology
(0.01, 0.61, 22.86) W S S S S W S M S
Skill and knowledge
enhancing technologies
(0.01, 0.58, 23.13) M W S S M S W S M
Flexible production
technology
(0.01, 0.58, 22.55) M S W S W M M
Quality over product life (0.01, 0.65, 25.26) M W M S M S S
Products with substantial
value-addition
(0.01, 0.63, 24.37) S M S W S S S
First-time right design (0.01, 0.61, 24.69) S M S M W S S
Short development cycle
times
(0.00, 0.57, 23.62) M M S S S S M S S S S
Continuous improvement (0.02, 0.70, 25.46) M S S S W M M M S S W
Culture of change (0.02, 0.67, 24.52) M M S M M S M W M
Rapid partnership
formation
(0.01, 0.40, 14.15) S S M M M M S S M
Strategic relationship
with customers
(0.01, 0.43, 14.61) S S M S W S
Close relationship with
suppliers
(0.01, 0.43, 15.05) S W S S S S
Trust-based relationship
with customers/suppliers
(0.02, 0.46, 15.31) S M S S M
New product introduction (0.02, 0.83, 33.68) S M W M S S W S W M W S
Customer-driven
innovations
(0.02, 0.89, 34.86) S M S M W S W M W S
Customer satisfaction (0.02, 0.93, 35.46) S M S M M M M S
Response to changing
market requirements
(0.03, 0.95, 35.90) S M S W M W M W S
Learning organization (0.02, 0.83, 31.93) M M S S M W M M
Multi-skilled and flexible
people
(0.02, 0.79, 31.25) S M S W W W W W M
Workforce skill upgrade (0.02, 0.80, 30.95) W S M M S M
Continuous training and
development
(0.02, 0.83, 31.75) M S S S M M
Employees satisfaction (0.00, 0.14, 5.95) M M M
RIk
(0.15, 9.68,
426.89)
(0.06, 4.22,
219.41)
(0.08, 6.05,
300.90)
(0.13, 9.85,
482.12)
(0.05, 4.65,
222.94)
(0.17, 12.22,
549.78)
(0.10, 7.15,
338.52)
(0.09, 6.57,
318.87)
(0.14, 8.95,
436.01)
(0.12, 9.67,
452.82)
(0.09, 6.42,
327.43)
(0.05, 4.61,
270.23)
(0.20, 13.02,
569.35)
Scorek
(0.35, 37.08,
2,292.26)
(0.06, 16.12,
1,155.16)
(0.09, 22.41,
896.81)
(0.18, 37.12,
1,860.64)
(0.12, 15.87,
1,026.94)
(0.42, 44.95,
2,849.84)
(0.15, 14.64,
858.48)
(0.24, 30.36,
2,058.83)
(0.31, 32.60,
2,045.93)
(0.12, 22.97,
1,567.61)
(0.18, 29.56,
2,011.99)
(0.09, 16.82,
1,289.02)
(0.32, 38.02,
2,435.13)
Normalized values (0.00, 0.82,
5,500.30)
(0.00, 0.36,
2,771.81)
(0.00, 0.50,
2,151.90)
(0.00, 0.83,
4,464.62)
(0.00, 0.35,
2,464.16)
(0.00, 1.00,
6,838.23)
(0.00, 0.33,
2,059.94)
(0.00, 0.68,
4940.18)
(0.00, 0.73,
4,909.23)
(0.00, 0.51,
3,761.49)
(0.00, 0.66,
4,827.78)
(0.00, 0.37,
3,093.02)
(0.00, 0.85,
5,843.11)
Crisp values 591.69 296.87 235.43 483.77 264.70 735.04 221.98 529.95 527.86 403.42 517.82 330.69 627.87
SP
P
P
P
P
P
P
P
P
P
SP
SP
P
P P
P
P
P
P
P
PP
SP
SP SP
SP
SP
SP
SP
SP
SP
SP
SP
SP
P
PP
Notes: S, strong; M, medium; W, weak; SP, strong positive; P, positive; N, negative; SN, strong
negative
Figure 10.
The second HOQ
223
Organizational
agility
of agility. On the other hand, none of the identified CSFs belongs to “Internal Processes.”
Also, the first 3 indicators of “Internal Processes” among the 50 KPIs are ranked 22nd, 30th,
and 38th, considerably far from the CSFs (top 25 percent of KPIs). This implies that the
organization is performing well with respect to its internal processes. The main internal
processes of the organization concern production of milk nutrition products as mentioned
earlier. Given the high expertise and high level of technology used for the production,
scoring high for internal processes was not far from expectations.
The ranking of agile enablers (Table IX) reveals that the first top two enablers, namely,
“Multi-venturing capabilities” and “Developed business practice difficult to copy” belong to
the decision domain of “Competence.” The next four agile enablers pertain to “Market”
domain, namely, “Response to changing market requirements,” “Customer satisfaction,”
“Customer-driven innovations,” and “New product introduction.” Prioritizing “Competence”
and “Market” overall the other decision domains by the experts indicates that the food market
in Iran is highly competitive and requires high levels of innovation and responsiveness.
Basically, the main mechanism for survival in such markets is building unique competencies
which are unique, innovative, and difficult to imitate by rivals. This is coherent with the
resource-based view (RBV) theory stating that firms need to build and rely on resources
Supply chain
management
Concurrent
engineering
Project
management
Information
technology
Team
building
Knowledge
management
Supply chain
management
Van Hoek
(2000)
Vonderembse
et al. (2006) and
Chung and
Snyder (2000)
Christopher
(2000) and
Gowen and
Tallon (2003)
Yusuf et al.
(1999), Gowen
and Tallon
(2003)
Concurrent
engineering
Ainscough
et al. (2003)
Van Hoek
(2000) and
Gunasekaran
(1999)
Jacob (2006)
Project
management
Information
technology
Gunasekaran
(1999)
Team building
Knowledge
management
Source: Bottani (2009a)
Table X.
Correlations among
decision domains
extracted from the
literature
Rank Agile enablers Crisp score
1 Information technology (IT) 735
2 Management information systems (MIS) 628
3 Supply chain management 592
4 Intranet connection 530
5 Extranet connections with networked companies 528
6 Enterprise resource planning (ERP)systems 518
7 Knowledge management 484
8 Total quality management (TQM) systems 403
9 Time-value analysis techniques 331
10 Project management 297
11 Concurrent engineering 265
12 Team building 235
13 Flexible manufacturing systems (FMS) or flexible assembly systems (FAS) 222
Table XI.
Ranking of agile
enablers according to
their crisp scores
224
BIJ
25,1
AgileEnablers
(AEk)
Weight
(Wk)
Development and integration of functional applications in main
areas of organization
Provision of ERP infrastructure
Use of EDI in B2B interactions
Development of web-based activities as portal configuration
Designing and implementing decision support systems (DSS)
Planning for long-term interactions with suppliers
Planning for obtain international business excellence awards
Forming and developing quality circles
Six sigma implementation
Preparation of corporate knowledge strategy in knowledge
management area
Training needs assessment and long-term educational planning
with multi-skilled employees approach
Technology Management
Product development unit start up
Strategic Planning
Supplychainmanagement(0.00,0.82,5,500.30)MSSSSSMMWMM
Projectmanagement(0.00,0.36,2,771.81)WMM
Teambuilding(0.00,0.50,2,151.90)MSSMM
Knowledgemanagement(0.00,0.83,4,464.62)WMMSMSW
Concurrentengineering(0.00,0.35,2,464.16)MWWS
Informationtechnology(IT)(0.00,1.00,6,838.23)SSSSSMW
Flexiblemanufacturingsystems(FMS)orflexibleassemblysystems(FAS)(0.00,0.33,2,059.94)SWWMSSM
Intranetconnection(0.00,0.68,4,940.18)SMWS
Extranetconnectionswithnetworkedcompanies(0.00,0.73,4,909.23)WWSM
Totalqualitymanagement(TQM)systems(0.00,0.51,3,761.49)SSSSSMS
Enterpriseresourceplanning(ERP)systems(0.00,0.66,4,827.78)SSWMMM
Time-valueanalysistechniques(0.00,0.37,3,093.02)WWSW
Managementinformationsystems(MIS)(0.00,0.85,5,843.11)SSSMSWWW
RId
(0.00,3.59,
29,943.21)
(0.00,4.40,
33,125.49)
(0.00,3.40,
26,021.25)
(0.00,2.58,
19,808.15)
(0.00,3.11,
23,305.01)
(0.00,1.88,
14,423.16)
(0.00,2.91,
22,700.34)
(0.00,1.42,
11,323.76)
(0.00,2.14,
16,238.84)
(0.00,1.15,
9,597.00)
(0.00,1.50,
12,845.12)
(0.00,0.33,
3,710.03)
(0.00,1.27,
10,453.74)
(0.00,1.42,
17,576.89)
Scored
(0.00,8.37,
82,455.18)
(0.00,7.48,
70,536.74)
(0.00,6.70,
64,954.77)
(0.00,5.71,
56,584.77)
(0.00,6.81,
67,545.90)
(0.00,5.64,
62,680.72)
(0.00,7.73,
86,201.20)
(0.00,3.63,
36,205.58)
(0.00,4.04,
38,551.64)
(0.00,5.61,
66,127.24)
(0.00,3.72,
40,241.34)
(0.00,1.62,
23,848.64)
(0.00,2.14,
21,803.91)
(0.00,3.53,
44,711.55)
Crispvalues20,61817,63816,24214,14916,890156,7321,5549,0539,64016,53510,0625,9635,45211,180
SP
SP
SP
SP
SP
SP
SP
SP
SP
P
PP
P
P
P
P
P
P
P
P
P
PP
Notes:S,strong;M,medium;W,weak;SP,strongpositive;P,positive;N,negative;SN,strongnegative
Figure 11.
The third HOQ
225
Organizational
agility
which are inimitable, rare, valuable, and non-substitutable in order to achieve a sustained
competitive advantage in competitive markets (Barney, 1991). All the top 6 agile enablers
follow the same characteristic as the ones pointed out by the RBV theory.
A practical implication comes from comparing the identified KPIs under different
perspectives of BSC. It can be observed that “Customer” perspective has the least number of
KPIs identified by the experts (Figure 7). Also, few “Customer”-related KPIs are present in
the first quartile of ranking, known as CSFs (Figure 8). While the ultimate goal of
organizational agility is to retain customers and responding to their changing needs, it is
interesting that less attention is given to “Customer” perspective. We infer that the reason for
this is twofold. First, the studied case was located in a developing country where attention to
customer as a driver of organizational success is weaker compared to developed countries.
It is in line with the findings of previous studies in developing countries. Upadhaya et al. (2014)
used BSC to assess organizational effectiveness and its association with performance
measurement systems in Nepal. They concluded that customer performance measures in BSC
are considered less significant compared to other measures such as financial. The study of
Khan et al. (2011) on 60 cross-section Bangladeshi companies also confirmed that use of
financial measures on BSC overweighs non-financial ones such as customer measures.
Interestingly, they found out that food industry had the lowest use of non-financial measures
among other sectors (only 42 percent). Second, we argue that it is not only the “Customer”
perspective in BSC that can lead to being agile in fulfilling customers’ demands.
Organizational agility as a multifaceted concept is influenced, even though implicitly, by the
other three aspects of BSC as well. For example, improving the CSF “Communication
Channel” belonging to the “Learning and Growth” perspective, will undoubtedly contribute to
the betterment of customer experience.
Moreover, we discuss the relatability of CSFs, agile attributes, agile enablers, and
improvement paths. As an example, we scrutinize the metrics related to the “Customer”
perspective. The first CSF belonging to this perspective is “market share.” Four agile
attributes are identified for market share, namely, “New product introduction,”
“Customer-driven innovations,” “Customer satisfaction,” and “Response to changing
market requirements” fall under the decision domain “Market” (see Table I). These are the
agile attributes that can eventually result in the increase of market share. Here, one might
question that some of the pertaining agile enablers resulting from these agile attributes
might seem irrelevant, e.g. flexible manufacturing system and flexible assembly systems.
It can be argued that these enablers can increase the customer-driven innovations, satisfy
Rank Improvement projects Crisp score
1 Planning for obtain International business excellence awards 21,554
2 Development and integration of functional applications in main areas of organization 20,618
3 Provision of ERP infrastructure 17,638
4 Designing and implementing decision support systems (DSS) 16,890
5 Preparation of corporate knowledge strategy in knowledge management district 16,535
6 Use of EDI in B2B interactions 16,242
7 Planning for long-term interactions with suppliers 15,673
8 Development of web-based activities as portal configuration 14,149
9 Strategic planning 11,180
10 Training needs assessment and long-term educational planning with multi-skilled
employees approach 10,062
11 6 sigma implementation 9,640
12 Forming and developing quality circles 9,053
13 Technology management 5,963
14 Product development unit start up 5,452
Table XII.
Ranking of
improvement paths
according to their
crisp scores
226
BIJ
25,1
their needs, increase their loyalty, and consequently increase and develop the market share
(see Figure 10). Therefore, these factors impact the market share of the company. In fact, one
of the strengths of the proposed methodology is that through three consecutive and
intertwined HOQs identifies fundamental mechanisms that, even ostensibly unrelated,
lead to the enhancement of organizational agility. It would otherwise be impossible to find
such mechanisms by conventional methodologies.
We also posit that the use of ranking in our methodology should not cause negligence to
lower-ranked metrics. For example, the fact that “New Technologies” obtained the last place
among the 50 performance measurement indicators (see Table VI) and is the least important
indicator shows that the organization is currently using the latest up-to-date technologies in its
production system. However, maintaining high level of technology is crucial for the company to
survive in the highly competitive food market. This can also be understood from the
concerning agile attributes such as “Technology Awareness” which pinpoints the importance
of commitment to modern technologies. Therefore, existence of no or little gap to fill does not
imply that the company should stop its current efforts of staying tuned with new technologies.
Our findings also have some implications regarding the use of internet and information
systems. Analysis of Table XI (ranking of agile enablers) shows that IT, MIS, intranet, extranet,
ERP, and knowledge management have been, respectively, ranked as number 1-6 of the most
important agile enablers in the organizations. Since all of these factors are categorized under the
virtual enterprise tools, the organization needs to be more virtually empowered to become more
agile. It is essential to equip the organization with better internet and intranet infrastructure,
management information software, and data banks. Besides, harmonizing the employees and
operational processes with the new improved virtual environment is crucial for the
organization. Our findings are coherent with previous studies which showed that the use of
virtual enterprise systems enhances organizational agility in developed countries (e.g. New
Zealand (Mathrani, 2014), but at odds with the domestic studies of organizational agility in Iran
where IT has not shown to have any direct relationship, but it even showed a negative
relationship with organizational agility. This can be explained due to the fact that Iran as a
developing country suffers from unstable or slow internet connection and limited access to
some internet content. Therefore, the studied companies in the literature, which were equipped
with IT systems, failed to benefit from their IT advantage for improving their agility.
In addition, local Iranian companies studied in the literature were collaborating with partners
(e.g. suppliers) that were not IT equipped. Significant differences in IT utilization level isolate
the organization with higher IT infrastructure and causes major difficulties in building IT-based
communications with partners and moving toward the notion of virtual enterprise.
Building upon the empirical observations about the category to which top ranked KPIs belong
to, few number of customer-related KPIs, and internet and information systems findings, we put
forward some implications for organizations using the methodology. Basically, it is possible for a
company to choose a set of agility metrics that are deemed to make the organization more agile
based on the idea of managers or experts. However, these metrics, although believed to be
appropriate by decision makers, might not be fully in line with organizations’ core values and
marketing objective or they might address areas in which there is little gap between the current
and desired level of agility. It is because agility metrics, as shown by quantitative calculations
in HOQs, are highly interrelated. One cannot directly choose the right metrics based on his/her
insight or experience devoid of the risk of wrong or inconsistent judgments. It has been shown
that when making multiple-criteria decisions, the level of inconsistency in human’s judgments
exponentially increases as the number of criteria and their interdependence increases
(Saaty and Shang, 2011). The correlations calculated in each HOQ are beyond the capability of
human mind to be considered simultaneously. This is a strong advantage of using a systematic
and structured methodology that facilitates the decision-making process by considering
various aspects and correlations.
227
Organizational
agility
A major concern when deriving agile attributes and agile enablers from the literature is
that they are industry-specific. They are especially tailored for the manufacturing context
which leaves other industries with little or no relevant metrics. This is advocated by the study
of Bottani (2009b) where she states that literature-driven metrics used for the food industry
result in very low or low results while the company is in fact sufficiently agile. We have tried
to tackle this shortcoming by using multiple sources to identify metrics besides the literature.
These sources included experts’ ideas both from academia and the industry and also using the
studied organization information for defining pertinent metrics. However, defining agility
metrics such as KPIs, attributes, enablers, and improvement paths remains to be a limitation
to any methodological agility study including ours. Hence, more industry-specific research is
needed to explore different companies in a specific market segment and finding mutual agility
metrics to be used for that segment. Applications on real-world cases from different industries
can contribute to generating valuable knowledge in this area. Also, future literature reviews in
the agility arena can compile the previously identified metrics from the literature.
Another limitation concerning our application is that we have confined our analysis to
the first quartile of performance measurement indicators with higher priority. The reason
was that choosing a higher number of indicators increases the amount of calculations
significantly and makes the HOQs unusually large. A suggestion to address this limitation
is developing QFD computer software capable of handling the calculation and
visualization of larger HOQs. Moreover, the accuracy of HOQs can be enhanced
through using innovative methods such as analytic hierarchy process (AHP) which
measures the consistency of responses for each respondent at the time of building the
relationship and correlation matrix. This has not been implemented in the QFD domain
hitherto and would be an interesting future research direction.
Finally, this study does not explicitly measure the initial need for agility due to the
nature of our studied case. The Nutricia MMP Company in collaboration with DANONE
Group is the second largest producer of powdered milk in the world and has a close
competition with its rival brand, Nestle. Once a company like our studied case could strive
to achieve the highest market share in a competitive industry, it can be surmised that it
achieved the highest level of agility, regardless of how much its initial need to agility was.
However, for future studies, especially when the company is not a market pioneer or when
the market is less competitive, it is recommended that first the need to agility to the
organization is measured so that it can be used as a basis for determining
the improvement paths. Various methods have been proposed for measuring the agility
need level (e.g. Zhang and Sharifi (2000), inter alia).
6. Conclusions
This study aims at improving organizational agility by integrating some operations
management techniques from the domains of decision making, quality engineering,
and organizational performance assessment. It proposes a new approach at strategic
management level for achieving macro organizational goals in competitive industries.
To this end, upon evaluating organizational performance using BSC technique, the
importance level and existing gap in each of the performance indicators, extracted from
macro and strategic long-term goals of the organization, were identified. Then, using fuzzy
TOPSIS from MCDM domain, all indicators were ranked to identify the indicators with
highest priorities, called as the organizational CSFs. Later, using QFD technique in fuzzy
environments, the following three objectives were simultaneously pursued:
(1) reducing/removing the existing gap among CSFs using improvement paths
obtained from HOQs;
(2) propelling organizations towards achieving their strategic goals; and
228
BIJ
25,1
(3) enhancing organizational agility and increasing the capability to feel, perceive, and
predict changes in the business environment as well as empowering organizations to
show timely reaction to volatility through improving their competitive advantage.
The application of our methodology in the highly competitive food industry revealed that
it is capable of achieving the aforementioned objectives. The proposed methodology can
be used for future agility studies. We recommend recollecting the metrics, i.e. CSFs, agile
attributes, agile enablers, and improvement paths to fit the needs of the case and its
market and also to develop and expand our knowledge beyond the currently existing
metrics. Likewise, the proposed model can be adopted in other environments with high
levels of volatility and agility need such as humanitarian context. Humanitarian
operations need to be agile not only in the provision of aid, but also in adjusting the intra-
organizational pace with the environmental changes (e.g. responding to a disaster).
However, humanitarian literature has been more focused on operational agility and
organizational agility is rarely addressed (L’Hermitte et al., 2016). Application of the
proposed model can be an interesting future research avenue that fills the void of
organizational agility in humanitarian organizations.
References
Ainscough, M., Neailey, K. and Tennant, C. (2003), “A self-assessment tool for implementing concurrent
engineering through change management”, International Journal of Project Management, Vol. 21
No. 6, pp. 425-431.
Agarwal, A., Shankar, R. and Tiwari, M.K. (2007), “Modeling agility of supply chain”, Industrial
Marketing Management, Vol. 36 No. 4, pp. 443-457.
Barney, J. (1991), “Firm resources and sustained competitive advantage”, Journal of Management,
Vol. 17 No. 1, pp. 99-120.
Bevilacqua, M., Ciarapica, F.E. and Giacchetta, G. (2006), “A fuzzy-QFD approach to supplier selection”,
Journal of Purchasing & Supply Management, Vol. 12, pp. 14-27.
Bottani, E. (2009a), “A fuzzy QFD approach to achieve agility”, International Journal of Production
Economics, Vol. 119 No. 2, pp. 380-391.
Bottani, E. (2009b), “On the assessment of enterprise agility: issues from two case studies”,
International Journal of Logistics: Research and Application, Vol. 12 No. 3, pp. 213-230.
Bottani, E. (2010), “Profile and enablers of agile companies: an empirical investigation”, International
Journal of Production Economics, Vol. 125 No. 2, pp. 251-261.
Bottani, E. and Rizzi, A. (2006), “Strategic management of logistics service: a fuzzy QFD approach”,
International Journal of Production Economics, Vol. 103 No. 2, pp. 585-599.
Brown, S. and Bessant, J. (2003), “The manufacturing strategy-capabilities links in mass customization
and agile manufacturing-an exploratory study”, International Journal of Operations and
Production Management, Vol. 23 No. 7, pp. 707-730.
Burgess, T.F. (1994), “Making the leap to agility: defining and achieving agile manufacturing through
business process redesign and business network redesign”, International Journal of Operations
and Production Management, Vol. 23 No. 7, pp. 707-730.
Burgess, T.F., Gules, H.K., Gupla, J. and Tekin, M. (1998), “Competitive priorities, process innovations
and time-based competition in the manufacturing sectors of industrializing economics:
the case study of Turkey”, Benchmarking for Quality Management & Technology, Vol. 5 No. 4,
pp. 304-306.
Cebeci, U. (2009), “Fuzzy AHP-based decision support system for selecting ERP systems in
textile industry by using balanced scorecard”, Expert Systems with Applications, Vol. 36,
pp. 8900-8909.
229
Organizational
agility
Chen, L.-H. and Ko, W.-C. (2009), “Fuzzy approaches to quality function deployment for new product
design”, Fuzzy Sets and Systems, Vol. 160 No. 18, pp. 2620-2639.
Cheng, C.H., Yang, K.L. and Hwang, C.L. (1999), “Evaluating attack helicopters by AHP based on
linguistic variable weight”, European Journal of Operational Research, Vol. 116 No. 2,
pp. 423-435.
Cho, H., Jung, M.-Y. and Kim, M. (1996), “Enabling technologies of agile manufacturing and its related
activities in Korea”, Computers & Industrial Engineering, Vol. 30 No. 3, pp. 323-334.
Christopher, M. (2000), “The agile supply chain: competing in volatile markets”, Industrial Marketing
Management, Vol. 29 No. 1, pp. 37-44.
Christopher, M. and Towill, D. (2001), “An integrated model for the design of agile supply chains”,
International Journal of Physical Distribution & Logistics Management, Vol. 31 No. 4,
pp. 234-246.
Chung, S.H. and Snyder, C.A. (2000), “ERP adoption: a technological evolution approach”, International
Journal of Agile Management Systems, Vol. 2 No. 1, pp. 24-32.
Corbett, L.M. and Rastrick, K.N. (2000), “Quality performance and organizational culture:
a New Zealand study”, International Journal of Quality & Reliability Management, Vol. 17
No. 1, pp. 14-26.
Dove, R.K. (1996), “Tools for analysing and constructing agile capabilities”, US Agility Forum,
Bethlehem, PA.
Dowlatshahi, S. and Cao, Q. (2005), “The impact of alignment between virtual enterprise and
information technology on business performance in an agile manufacturing environment”,
Journal of Operations Management, Vol. 23 No. 5, pp. 531-550.
Dowlatshahi, S. and Cao, Q. (2006), “The relationships among virtual enterprise, information
technology, and business performance in agile manufacturing: an industry perspective”,
European Journal of Operational Research, Vol. 174 No. 2, pp. 835-860.
Droge, C., Jayaram, J. and Vickery, S.K. (2004), “The effects of internal versus external integration
practices on time-based performance and overall firm performance”, Journal of Operations
Management, Vol. 22 No. 6, pp. 557-573.
Dursun, M. and Karsak, E.E. (2013), “A QFD-based fuzzy MCDM approach for supplier selection”,
Applied Mathematical Modelling, Vol. 37, pp. 5864-5875.
Earle, J.S., Pagano, U. and Lesi, M. (2006), “Information technology, organizational form, and transition
to the market”, Journal of Economic Behavior & Organization, Vol. 60 No. 4, pp. 471-489.
Fayezi, S., Zutshi, A. and O’Loughlin, A. (2015), “How Australian manufacturing firms perceive and
understand the concepts of agility and flexibility in the supply chain”, International Journal of
Operations & Production Management, Vol. 35 No. 2, pp. 246-281.
Gehani, R.R. (1995), “Time-based management of technology: a taxonomic integration of tactical and
strategic roles”, International Journal of Operations and Production Management, Vol. 15 No. 2,
pp. 19-35.
Gligor, D.M., Esmark, C.L. and Holcomb, M.C. (2015), “Performance outcomes of supply chain
agility: when should you be agile?”, Journal of Operations Management, Vols 33-34, January,
pp. 71-82.
Goldman, S.L. and Nagel, R.N. (1993), “Management, technology and agility: the emergence of a new
era in manufacturing”, International Journal of Technology Management, Vol. 8 Nos 1-2,
pp. 18-38.
Goldman, S.L., Nagel, R.N. and Preiss, K. (1995), Agile Competitors and Virtual Organizations:
Strategies for Enriching the Customer, Van Nostrand Reinhold, New York, NY.
Gowen, C.R. and Tallon, W.J. (2003), “Enhancing supply chain practices through human resource
management”, Journal of Management Development, Vol. 22 No. 1, pp. 32-44.
Gunasekaran, A. (1998), “Agile manufacturing: enablers and an implementation framework”,
International Journal of Production Research, Vol. 36 No. 5, pp. 1223-1247.
230
BIJ
25,1
Gunasekaran, A. (1999), “Agile manufacturing: a framework for research and development”,
International Journal of Production Economics, Vol. 62 Nos 1-2, pp. 87-105.
Gunasekaran, A. and Yusuf, Y.Y. (2002), “Agile manufacturing: a taxonomy of strategic and
technological imperatives”, International Journal of Production Research, Vol. 40 No. 6,
pp. 1357-1385.
Higgins, K.L. and Maciariello, J.A. (2004), “Leading complex collaboration in network organizations:
a multidisciplinary approach”, Complex Collaboration: Building the Capabilities for Working
Across Boundaries, Vol. 10, Emerald Group Publishing Limited, pp. 203-241.
Jackson, M. and Johansson, C. (2003), “An agility analysis from a production system perspective”,
Integrated Manufacturing Systems, Vol. 14 No. 6, pp. 482-488.
Jacob, F. (2006), “Preparing industrial suppliers for customer integration”, Industrial Marketing
Management, Vol. 35 No. 1, pp. 45-56.
Jung, J.Y. and Wang, Y.J. (2006), “Relationship between total quality management (TQM) and
continuous improvement of international project management (CIIPM)”, Technovation, Vol. 26
No. 5, pp. 716-722.
Kathuria, R. and Davis, E.B. (1999), “Quality and work force management: from manufacturing
managers’ perspective”, Journal of Quality Management, Vol. 4 No. 2, pp. 147-166.
Khan, M.H.-U.-Z., Halabi, A.K. and Sartorius, K. (2011), “The use of multiple performance measures and
the balanced scorecard (BSC) in Bangladeshi firms: an empirical investigation”, Journal of
Accounting in Emerging Economies, Vol. 1 No. 2, pp. 160-190.
Kidd, P.T. (1994), Agile Manufacturing-Forging New Frontiers, Addison-Wesley, Wokingham.
Kisperska-Moron, D. and Swierczek, A. (2009), “The agile capabilities of Polish companies in the supply
chain: an empirical study”, International Journal of Production Economics, Vol. 118 No. 1,
pp. 217-224.
Koskinen, J. (2014), “Modular product design for dynamic capabilities of manufacturing organisations:
a case study”, International Journal of Business Innovation and Research, Vol. 8 No. 6,
pp. 671-683.
Kuleelung, T. and Ussahawanitchakit, P. (2015), “Organizational agility and firm performance:
evidence from information and communication technology (ICT) businesses in Thailand”,
The Business & Management Review, Vol. 7 No. 1, pp. 206-217.
Kumar, A. and Motwani, J. (1995), “A methodology for assessing time-based competitive advantage of
manufacturing firms”, International Journal of Operations and Production Management, Vol. 15
No. 2, pp. 36-53.
Kuo, Y.-F. and Chen, P.-C. (2008), “Constructing performance appraisal indicators for mobility of the
service industries using Fuzzy Delphi Method”, Expert Systems with Applications, Vol. 35 No. 4,
pp. 1930-1939.
Lakemond, N. and Berggren, C. (2006), “Co-locating NPD? The need for combining project focus and
organizational integration”, Technovation, Vol. 26 No. 7, pp. 807-819.
Lee, A.H.I., Chen, W.-C. and Chang, C.-J. (2008), “A fuzzy AHP and BSC approach for evaluating
performance of IT department in the manufacturing industry in Taiwan”, Expert Systems with
Applications, Vol. 34 No. 1, pp. 96-107.
L’Hermitte, C., Tatham, P., Brooks, B. and Bowles, M. (2016), “Supply chain agility in humanitarian
protracted operations”, Journal of Humanitarian Logistics and Supply Chain Management, Vol. 6
No. 2, pp. 173-201.
Lima-Junior, F.R. and Carpinetti, L.C.R. (2016), “A multicriteria approach based on fuzzy QFD for
choosing criteria for supplier selection”, Computers & Industrial Engineering, Vol. 101,
Supplement C, pp. 269-285.
Lin, C.-T., Chiu, H. and Chu, P.-Y. (2006), “Agility index in the supply chain”, International Journal of
Production Economics, Vol. 100 No. 2, pp. 285-299.
231
Organizational
agility
Liu, H.-T. (2009), “The extension of fuzzy QFD: from product planning to part deployment”,
Expert Systems with Applications, Vol. 36 No. 8, pp. 11131-11144.
Mathrani, S. (2014), “Using enterprise systems to enhance organizational agility”, Journal of Applied
Computing and Information Technology, Vol. 18 No. 1.
Messer, B., Patrick, C. and Seitz, S. (2006), “Achieving cost savings with innovative welding and
examination techniques”, International Journal of Pressure Vessels and Piping, Vol. 83 No. 5,
pp. 365-372.
Mohanty, R.P. and Deshmukh, S.G. (2001), “Agility: searching for definitions and boundaries”,
International Journal of Agile Manufacturing, Vol. 4 No. 2, pp. 43-68.
Morgan, R.E. (2004), “Business agility and internal marketing”, European Business Review, Vol. 16
No. 5, pp. 464-472.
Nafei, W.A. (2016a), “Organizational agility: the key to improve organizational performance”,
International Business Research, Vol. 9 No. 3, pp. 97-111.
Nafei, W.A. (2016b), “The role of organizational agility in enhancing organizational excellence: a study
on telecommunications sector in Egypt”, International Journal of Business and Management,
Vol. 11 No. 4, pp. 121-135.
Nejatian, M. and Zarei, M.H. (2013), “Moving towards organizational agility: are we improving in the
right direction?”, Global Journal of Flexible Systems Management, Vol. 14 No. 4, pp. 241-253.
Prahalad, C. and Hamel, G. (1990), “The core competence of the corporation”, Harvard Business Review,
Vol. 68, pp. 79-91.
Prince, J. and Kay, J.M. (2003), “Combining lean and agile characteristics: creation of virtual groups by
enhanced production flow analysis”, International Journal of Production Economics, Vol. 85
No. 3, pp. 305-318.
Rasouli, O. and Zarei, M.H. (2016), “Monitoring and reducing patient dissatisfaction: a case study of an
Iranian public hospital”, Total Quality Management & Business Excellence, Vol. 27 Nos 5-6,
pp. 531-559.
Ren, J., Yusuf, Y.Y. and Burns, D. (2001), “Organizational competitiveness: identifying the critical agile
attributes using principal component analysis”, Proceedings of the 16th International Conference
on Production Research, Prague, July.
Ren, J., Yusuf, Y.Y. and Burns, N.D. (2003), “The effects of agile attributes on competitive priorities:
a neural network approach”, Integrated Manufacturing Systems, Vol. 14 No. 6, pp. 489-497.
Ren, J., Yusuf, Y.Y. and Burns, D. (2009), “A decision-support framework for agile enterprise
partnering”, International Journal of Advanced Manufacturing Technology, Vol. 41 Nos 1-2,
pp. 180-192.
Saaty, T.L. and Shang, J.S. (2011), “An innovative orders-of-magnitude approach to AHP-based multi-
criteria decision making: prioritizing divergent intangible humane acts”, European Journal of
Operational Research, Vol. 214 No. 3, pp. 703-715.
Sharifi, H. and Zhang, Z. (2001), “Agile manufacturing in practice: application of a methodology”,
International Journal of Operations and Production Management, Vol. 21 Nos 5/6,
pp. 772-794.
Sharifi, H., Colquhoun, G., Barclay, I. and Dann, Z. (2001), “Agile manufacturing: a management and
operational framework”, Proceedings of the Institution of Mechanical Engineers, Part B: Journal
of Engineering Manufacture, Vol. 215 No. 6, pp. 857-869.
Sherehiy, B., Karwowski, W. and Layer, J.K. (2007), “A review of enterprise agility: concepts,
frameworks, and attributes”, International Journal of Industrial Ergonomics, Vol. 37 No. 5,
pp. 445-460.
Small, A.W. and Downey, A.E. (1996), “Orchestrating multiple changes: a framework for managing
concurrent changes of varied type and scope”, Proceedings of IEMC Conference on Managing
Virtual Enterprises, pp. 627-634.
232
BIJ
25,1
A hybrid approach to achieve oa

Más contenido relacionado

La actualidad más candente

Articles Jack Value Mapping Second Generation Performance Management 132
Articles Jack Value Mapping Second Generation Performance Management 132Articles Jack Value Mapping Second Generation Performance Management 132
Articles Jack Value Mapping Second Generation Performance Management 132swati18
 
The Adoption of Benchmarking Principles for Project Management Performance Im...
The Adoption of Benchmarking Principles for Project Management Performance Im...The Adoption of Benchmarking Principles for Project Management Performance Im...
The Adoption of Benchmarking Principles for Project Management Performance Im...ijmpict
 
The Effect of Change Management on Operational Excellence moderated by Commit...
The Effect of Change Management on Operational Excellence moderated by Commit...The Effect of Change Management on Operational Excellence moderated by Commit...
The Effect of Change Management on Operational Excellence moderated by Commit...oon fok yew
 
AGILE MANUFACTURING THROUGH MANAGEMENT DRIVER
AGILE MANUFACTURING THROUGH MANAGEMENT DRIVERAGILE MANUFACTURING THROUGH MANAGEMENT DRIVER
AGILE MANUFACTURING THROUGH MANAGEMENT DRIVERIAEME Publication
 
Correlations among Brand Image, Dynamic Capability, Knowledge Management Capa...
Correlations among Brand Image, Dynamic Capability, Knowledge Management Capa...Correlations among Brand Image, Dynamic Capability, Knowledge Management Capa...
Correlations among Brand Image, Dynamic Capability, Knowledge Management Capa...inventionjournals
 
Research Inventy : International Journal of Engineering and Science is publis...
Research Inventy : International Journal of Engineering and Science is publis...Research Inventy : International Journal of Engineering and Science is publis...
Research Inventy : International Journal of Engineering and Science is publis...researchinventy
 
Business Excellence: A Comparative Study of Various Models, Criteria’s and Aw...
Business Excellence: A Comparative Study of Various Models, Criteria’s and Aw...Business Excellence: A Comparative Study of Various Models, Criteria’s and Aw...
Business Excellence: A Comparative Study of Various Models, Criteria’s and Aw...IRJET Journal
 
International Journal of Engineering Research and Development (IJERD)
International Journal of Engineering Research and Development (IJERD)International Journal of Engineering Research and Development (IJERD)
International Journal of Engineering Research and Development (IJERD)IJERD Editor
 
Management Control in Contemporary Organization: Opportunities, Challenges an...
Management Control in Contemporary Organization: Opportunities, Challenges an...Management Control in Contemporary Organization: Opportunities, Challenges an...
Management Control in Contemporary Organization: Opportunities, Challenges an...Dr. Amarjeet Singh
 
Literature review 9 nov 2
Literature review 9 nov 2Literature review 9 nov 2
Literature review 9 nov 2TK Tof
 
Examining Innovation Capability In A Supply Chain Context
Examining Innovation Capability In A Supply Chain ContextExamining Innovation Capability In A Supply Chain Context
Examining Innovation Capability In A Supply Chain ContextCSCJournals
 
IRJET- A Study on Emerging Trends in Performance Appraisal IN 21st ERA
IRJET-  	  A Study on Emerging Trends in Performance Appraisal IN 21st ERAIRJET-  	  A Study on Emerging Trends in Performance Appraisal IN 21st ERA
IRJET- A Study on Emerging Trends in Performance Appraisal IN 21st ERAIRJET Journal
 
M M Bagali, PhD, Research paper, MBA Faculty, HRM, HR, HRD, PhD in HR and Man...
M M Bagali, PhD, Research paper, MBA Faculty, HRM, HR, HRD, PhD in HR and Man...M M Bagali, PhD, Research paper, MBA Faculty, HRM, HR, HRD, PhD in HR and Man...
M M Bagali, PhD, Research paper, MBA Faculty, HRM, HR, HRD, PhD in HR and Man...dr m m bagali, phd in hr
 
Managing new organizational forms
Managing new organizational formsManaging new organizational forms
Managing new organizational formsStudent
 
Utilizing the BSC and EFQM as a Combination Framework; Scrutinizing the Possi...
Utilizing the BSC and EFQM as a Combination Framework; Scrutinizing the Possi...Utilizing the BSC and EFQM as a Combination Framework; Scrutinizing the Possi...
Utilizing the BSC and EFQM as a Combination Framework; Scrutinizing the Possi...Waqas Tariq
 

La actualidad más candente (18)

Articles Jack Value Mapping Second Generation Performance Management 132
Articles Jack Value Mapping Second Generation Performance Management 132Articles Jack Value Mapping Second Generation Performance Management 132
Articles Jack Value Mapping Second Generation Performance Management 132
 
The Adoption of Benchmarking Principles for Project Management Performance Im...
The Adoption of Benchmarking Principles for Project Management Performance Im...The Adoption of Benchmarking Principles for Project Management Performance Im...
The Adoption of Benchmarking Principles for Project Management Performance Im...
 
50120130406024
5012013040602450120130406024
50120130406024
 
The Effect of Change Management on Operational Excellence moderated by Commit...
The Effect of Change Management on Operational Excellence moderated by Commit...The Effect of Change Management on Operational Excellence moderated by Commit...
The Effect of Change Management on Operational Excellence moderated by Commit...
 
AGILE MANUFACTURING THROUGH MANAGEMENT DRIVER
AGILE MANUFACTURING THROUGH MANAGEMENT DRIVERAGILE MANUFACTURING THROUGH MANAGEMENT DRIVER
AGILE MANUFACTURING THROUGH MANAGEMENT DRIVER
 
Correlations among Brand Image, Dynamic Capability, Knowledge Management Capa...
Correlations among Brand Image, Dynamic Capability, Knowledge Management Capa...Correlations among Brand Image, Dynamic Capability, Knowledge Management Capa...
Correlations among Brand Image, Dynamic Capability, Knowledge Management Capa...
 
Research Inventy : International Journal of Engineering and Science is publis...
Research Inventy : International Journal of Engineering and Science is publis...Research Inventy : International Journal of Engineering and Science is publis...
Research Inventy : International Journal of Engineering and Science is publis...
 
Business Excellence: A Comparative Study of Various Models, Criteria’s and Aw...
Business Excellence: A Comparative Study of Various Models, Criteria’s and Aw...Business Excellence: A Comparative Study of Various Models, Criteria’s and Aw...
Business Excellence: A Comparative Study of Various Models, Criteria’s and Aw...
 
International Journal of Engineering Research and Development (IJERD)
International Journal of Engineering Research and Development (IJERD)International Journal of Engineering Research and Development (IJERD)
International Journal of Engineering Research and Development (IJERD)
 
0256090920140101
02560909201401010256090920140101
0256090920140101
 
Management Control in Contemporary Organization: Opportunities, Challenges an...
Management Control in Contemporary Organization: Opportunities, Challenges an...Management Control in Contemporary Organization: Opportunities, Challenges an...
Management Control in Contemporary Organization: Opportunities, Challenges an...
 
Literature review 9 nov 2
Literature review 9 nov 2Literature review 9 nov 2
Literature review 9 nov 2
 
Examining Innovation Capability In A Supply Chain Context
Examining Innovation Capability In A Supply Chain ContextExamining Innovation Capability In A Supply Chain Context
Examining Innovation Capability In A Supply Chain Context
 
4
44
4
 
IRJET- A Study on Emerging Trends in Performance Appraisal IN 21st ERA
IRJET-  	  A Study on Emerging Trends in Performance Appraisal IN 21st ERAIRJET-  	  A Study on Emerging Trends in Performance Appraisal IN 21st ERA
IRJET- A Study on Emerging Trends in Performance Appraisal IN 21st ERA
 
M M Bagali, PhD, Research paper, MBA Faculty, HRM, HR, HRD, PhD in HR and Man...
M M Bagali, PhD, Research paper, MBA Faculty, HRM, HR, HRD, PhD in HR and Man...M M Bagali, PhD, Research paper, MBA Faculty, HRM, HR, HRD, PhD in HR and Man...
M M Bagali, PhD, Research paper, MBA Faculty, HRM, HR, HRD, PhD in HR and Man...
 
Managing new organizational forms
Managing new organizational formsManaging new organizational forms
Managing new organizational forms
 
Utilizing the BSC and EFQM as a Combination Framework; Scrutinizing the Possi...
Utilizing the BSC and EFQM as a Combination Framework; Scrutinizing the Possi...Utilizing the BSC and EFQM as a Combination Framework; Scrutinizing the Possi...
Utilizing the BSC and EFQM as a Combination Framework; Scrutinizing the Possi...
 

Similar a A hybrid approach to achieve oa

A STUDY ON SC PERFORMANCE MEASUREMENT IN MANUFACTURING INDUSTRY THROUGH BALAN...
A STUDY ON SC PERFORMANCE MEASUREMENT IN MANUFACTURING INDUSTRY THROUGH BALAN...A STUDY ON SC PERFORMANCE MEASUREMENT IN MANUFACTURING INDUSTRY THROUGH BALAN...
A STUDY ON SC PERFORMANCE MEASUREMENT IN MANUFACTURING INDUSTRY THROUGH BALAN...Sabrina Baloi
 
Implications Of Human Resource Variables On Supply Chain Performance And Comp...
Implications Of Human Resource Variables On Supply Chain Performance And Comp...Implications Of Human Resource Variables On Supply Chain Performance And Comp...
Implications Of Human Resource Variables On Supply Chain Performance And Comp...CSCJournals
 
A REVIEW OF LITERATURE IN MANAGEMENT CONTROL SYSTEM (MCS), BUSINESS STRATEGY,...
A REVIEW OF LITERATURE IN MANAGEMENT CONTROL SYSTEM (MCS), BUSINESS STRATEGY,...A REVIEW OF LITERATURE IN MANAGEMENT CONTROL SYSTEM (MCS), BUSINESS STRATEGY,...
A REVIEW OF LITERATURE IN MANAGEMENT CONTROL SYSTEM (MCS), BUSINESS STRATEGY,...Christine Maffla
 
Linking Theory & Practice Navigating the innovation landscape pas.docx
Linking Theory & Practice Navigating the innovation landscape pas.docxLinking Theory & Practice Navigating the innovation landscape pas.docx
Linking Theory & Practice Navigating the innovation landscape pas.docxSHIVA101531
 
DeterminantsofFirmPerformanceASubjectiveModel.pdf
DeterminantsofFirmPerformanceASubjectiveModel.pdfDeterminantsofFirmPerformanceASubjectiveModel.pdf
DeterminantsofFirmPerformanceASubjectiveModel.pdfbeenayadav15
 
Linking Theory & PracticeNavigating the innovation landsca.docx
Linking Theory & PracticeNavigating the innovation landsca.docxLinking Theory & PracticeNavigating the innovation landsca.docx
Linking Theory & PracticeNavigating the innovation landsca.docxsmile790243
 
Drivers of supply chain performance enhancing organizational output an explo...
Drivers of supply chain performance enhancing organizational output  an explo...Drivers of supply chain performance enhancing organizational output  an explo...
Drivers of supply chain performance enhancing organizational output an explo...Alexander Decker
 
The relationship between generic strategies and organizational performance: A...
The relationship between generic strategies and organizational performance: A...The relationship between generic strategies and organizational performance: A...
The relationship between generic strategies and organizational performance: A...AI Publications
 
Effect of Supply Chain Management Practices on Organizational Performance of ...
Effect of Supply Chain Management Practices on Organizational Performance of ...Effect of Supply Chain Management Practices on Organizational Performance of ...
Effect of Supply Chain Management Practices on Organizational Performance of ...AJHSSR Journal
 
Lecture 3 benchmarking in quality system
Lecture 3  benchmarking in quality systemLecture 3  benchmarking in quality system
Lecture 3 benchmarking in quality systemTantish QS, UTM
 
An appraisal on small firms corporate culture
An appraisal on small firms corporate cultureAn appraisal on small firms corporate culture
An appraisal on small firms corporate cultureprjpublications
 
Corporate entrepreneurship as a strategic approach for internal innovation pe...
Corporate entrepreneurship as a strategic approach for internal innovation pe...Corporate entrepreneurship as a strategic approach for internal innovation pe...
Corporate entrepreneurship as a strategic approach for internal innovation pe...Ying wei (Joe) Chou
 
Draft Due Week 5 and worth 50 pointsHave you ever needed just th.docx
Draft Due Week 5 and worth 50 pointsHave you ever needed just th.docxDraft Due Week 5 and worth 50 pointsHave you ever needed just th.docx
Draft Due Week 5 and worth 50 pointsHave you ever needed just th.docxkanepbyrne80830
 
KLB4132
KLB4132  KLB4132
KLB4132 KLIBEL
 
Reviewing Methodology of research Papers
Reviewing Methodology of research PapersReviewing Methodology of research Papers
Reviewing Methodology of research Papersneerajshahi
 
Achieving sustainable competitive advantage through resource configur
Achieving sustainable competitive advantage through resource configurAchieving sustainable competitive advantage through resource configur
Achieving sustainable competitive advantage through resource configurIAEME Publication
 
Achieving sustainable competitive advantage through resource configur
Achieving sustainable competitive advantage through resource configurAchieving sustainable competitive advantage through resource configur
Achieving sustainable competitive advantage through resource configurIAEME Publication
 
Achieving sustainable competitive advantage through resource configur
Achieving sustainable competitive advantage through resource configurAchieving sustainable competitive advantage through resource configur
Achieving sustainable competitive advantage through resource configurIAEME Publication
 

Similar a A hybrid approach to achieve oa (20)

A STUDY ON SC PERFORMANCE MEASUREMENT IN MANUFACTURING INDUSTRY THROUGH BALAN...
A STUDY ON SC PERFORMANCE MEASUREMENT IN MANUFACTURING INDUSTRY THROUGH BALAN...A STUDY ON SC PERFORMANCE MEASUREMENT IN MANUFACTURING INDUSTRY THROUGH BALAN...
A STUDY ON SC PERFORMANCE MEASUREMENT IN MANUFACTURING INDUSTRY THROUGH BALAN...
 
Implications Of Human Resource Variables On Supply Chain Performance And Comp...
Implications Of Human Resource Variables On Supply Chain Performance And Comp...Implications Of Human Resource Variables On Supply Chain Performance And Comp...
Implications Of Human Resource Variables On Supply Chain Performance And Comp...
 
A REVIEW OF LITERATURE IN MANAGEMENT CONTROL SYSTEM (MCS), BUSINESS STRATEGY,...
A REVIEW OF LITERATURE IN MANAGEMENT CONTROL SYSTEM (MCS), BUSINESS STRATEGY,...A REVIEW OF LITERATURE IN MANAGEMENT CONTROL SYSTEM (MCS), BUSINESS STRATEGY,...
A REVIEW OF LITERATURE IN MANAGEMENT CONTROL SYSTEM (MCS), BUSINESS STRATEGY,...
 
Linking Theory & Practice Navigating the innovation landscape pas.docx
Linking Theory & Practice Navigating the innovation landscape pas.docxLinking Theory & Practice Navigating the innovation landscape pas.docx
Linking Theory & Practice Navigating the innovation landscape pas.docx
 
DeterminantsofFirmPerformanceASubjectiveModel.pdf
DeterminantsofFirmPerformanceASubjectiveModel.pdfDeterminantsofFirmPerformanceASubjectiveModel.pdf
DeterminantsofFirmPerformanceASubjectiveModel.pdf
 
Linking Theory & PracticeNavigating the innovation landsca.docx
Linking Theory & PracticeNavigating the innovation landsca.docxLinking Theory & PracticeNavigating the innovation landsca.docx
Linking Theory & PracticeNavigating the innovation landsca.docx
 
Drivers of supply chain performance enhancing organizational output an explo...
Drivers of supply chain performance enhancing organizational output  an explo...Drivers of supply chain performance enhancing organizational output  an explo...
Drivers of supply chain performance enhancing organizational output an explo...
 
The relationship between generic strategies and organizational performance: A...
The relationship between generic strategies and organizational performance: A...The relationship between generic strategies and organizational performance: A...
The relationship between generic strategies and organizational performance: A...
 
Effect of Supply Chain Management Practices on Organizational Performance of ...
Effect of Supply Chain Management Practices on Organizational Performance of ...Effect of Supply Chain Management Practices on Organizational Performance of ...
Effect of Supply Chain Management Practices on Organizational Performance of ...
 
Lecture 3 benchmarking in quality system
Lecture 3  benchmarking in quality systemLecture 3  benchmarking in quality system
Lecture 3 benchmarking in quality system
 
An appraisal on small firms corporate culture
An appraisal on small firms corporate cultureAn appraisal on small firms corporate culture
An appraisal on small firms corporate culture
 
Corporate entrepreneurship as a strategic approach for internal innovation pe...
Corporate entrepreneurship as a strategic approach for internal innovation pe...Corporate entrepreneurship as a strategic approach for internal innovation pe...
Corporate entrepreneurship as a strategic approach for internal innovation pe...
 
Literature Review on Performance Management System
Literature Review on Performance Management SystemLiterature Review on Performance Management System
Literature Review on Performance Management System
 
AGILE_MANUFACTURING.DOC
AGILE_MANUFACTURING.DOCAGILE_MANUFACTURING.DOC
AGILE_MANUFACTURING.DOC
 
Draft Due Week 5 and worth 50 pointsHave you ever needed just th.docx
Draft Due Week 5 and worth 50 pointsHave you ever needed just th.docxDraft Due Week 5 and worth 50 pointsHave you ever needed just th.docx
Draft Due Week 5 and worth 50 pointsHave you ever needed just th.docx
 
KLB4132
KLB4132  KLB4132
KLB4132
 
Reviewing Methodology of research Papers
Reviewing Methodology of research PapersReviewing Methodology of research Papers
Reviewing Methodology of research Papers
 
Achieving sustainable competitive advantage through resource configur
Achieving sustainable competitive advantage through resource configurAchieving sustainable competitive advantage through resource configur
Achieving sustainable competitive advantage through resource configur
 
Achieving sustainable competitive advantage through resource configur
Achieving sustainable competitive advantage through resource configurAchieving sustainable competitive advantage through resource configur
Achieving sustainable competitive advantage through resource configur
 
Achieving sustainable competitive advantage through resource configur
Achieving sustainable competitive advantage through resource configurAchieving sustainable competitive advantage through resource configur
Achieving sustainable competitive advantage through resource configur
 

Más de Syahrial Maulana

Más de Syahrial Maulana (8)

1.pptx
1.pptx1.pptx
1.pptx
 
3202 article text-12268-1-10-20190901 (1)
3202 article text-12268-1-10-20190901 (1)3202 article text-12268-1-10-20190901 (1)
3202 article text-12268-1-10-20190901 (1)
 
10.1.1.981.6521
10.1.1.981.652110.1.1.981.6521
10.1.1.981.6521
 
Agile talent-management-hr-whitepaper-prowareness
Agile talent-management-hr-whitepaper-prowarenessAgile talent-management-hr-whitepaper-prowareness
Agile talent-management-hr-whitepaper-prowareness
 
06 negara-hukum-2016
06 negara-hukum-201606 negara-hukum-2016
06 negara-hukum-2016
 
Heat transfer
Heat transferHeat transfer
Heat transfer
 
Humorgusdur
HumorgusdurHumorgusdur
Humorgusdur
 
5 procurement-management
5 procurement-management5 procurement-management
5 procurement-management
 

Último

Shaping Organizational Culture Beyond Wishful Thinking
Shaping Organizational Culture Beyond Wishful ThinkingShaping Organizational Culture Beyond Wishful Thinking
Shaping Organizational Culture Beyond Wishful ThinkingGiuseppe De Simone
 
Better SAFe than sorry - Why scaled agile frameworks do not necessarily impro...
Better SAFe than sorry - Why scaled agile frameworks do not necessarily impro...Better SAFe than sorry - Why scaled agile frameworks do not necessarily impro...
Better SAFe than sorry - Why scaled agile frameworks do not necessarily impro...Conny Dethloff
 
HOTEL MANAGEMENT SYSTEM PPT PRESENTATION
HOTEL MANAGEMENT SYSTEM PPT PRESENTATIONHOTEL MANAGEMENT SYSTEM PPT PRESENTATION
HOTEL MANAGEMENT SYSTEM PPT PRESENTATIONsivani14565220
 
Management 11th Edition - Chapter 11 - Adaptive Organizational Design
Management 11th Edition - Chapter 11 - Adaptive Organizational DesignManagement 11th Edition - Chapter 11 - Adaptive Organizational Design
Management 11th Edition - Chapter 11 - Adaptive Organizational Designshakkardaddy
 
Effective learning in the Age of Hybrid Work - Agile Saturday Tallinn 2024
Effective learning in the Age of Hybrid Work - Agile Saturday Tallinn 2024Effective learning in the Age of Hybrid Work - Agile Saturday Tallinn 2024
Effective learning in the Age of Hybrid Work - Agile Saturday Tallinn 2024Giuseppe De Simone
 
Choosing the best strategy qspm matrix.pptx
Choosing the best strategy qspm matrix.pptxChoosing the best strategy qspm matrix.pptx
Choosing the best strategy qspm matrix.pptxMadan Karki
 
The Final Activity in Project Management
The Final Activity in Project ManagementThe Final Activity in Project Management
The Final Activity in Project ManagementCIToolkit
 
BoSUSA23 | Chris Spiek & Justin Dickow | Autobooks Product & Engineering
BoSUSA23 | Chris Spiek & Justin Dickow | Autobooks Product & EngineeringBoSUSA23 | Chris Spiek & Justin Dickow | Autobooks Product & Engineering
BoSUSA23 | Chris Spiek & Justin Dickow | Autobooks Product & EngineeringBusiness of Software Conference
 
How-How Diagram: A Practical Approach to Problem Resolution
How-How Diagram: A Practical Approach to Problem ResolutionHow-How Diagram: A Practical Approach to Problem Resolution
How-How Diagram: A Practical Approach to Problem ResolutionCIToolkit
 
Mind Mapping: A Visual Approach to Organize Ideas and Thoughts
Mind Mapping: A Visual Approach to Organize Ideas and ThoughtsMind Mapping: A Visual Approach to Organize Ideas and Thoughts
Mind Mapping: A Visual Approach to Organize Ideas and ThoughtsCIToolkit
 
Management 11th Edition - Chapter 13 - Managing Teams
Management 11th Edition - Chapter 13 - Managing TeamsManagement 11th Edition - Chapter 13 - Managing Teams
Management 11th Edition - Chapter 13 - Managing Teamsshakkardaddy
 
Hajra Karrim: Transformative Leadership Driving Innovation and Efficiency in ...
Hajra Karrim: Transformative Leadership Driving Innovation and Efficiency in ...Hajra Karrim: Transformative Leadership Driving Innovation and Efficiency in ...
Hajra Karrim: Transformative Leadership Driving Innovation and Efficiency in ...dsnow9802
 
Management 11th Edition - Chapter 9 - Strategic Management
Management 11th Edition - Chapter 9 - Strategic ManagementManagement 11th Edition - Chapter 9 - Strategic Management
Management 11th Edition - Chapter 9 - Strategic Managementshakkardaddy
 
Exploring Variable Relationships with Scatter Diagram Analysis
Exploring Variable Relationships with Scatter Diagram AnalysisExploring Variable Relationships with Scatter Diagram Analysis
Exploring Variable Relationships with Scatter Diagram AnalysisCIToolkit
 
The Role of Box Plots in Comparing Multiple Data Sets
The Role of Box Plots in Comparing Multiple Data SetsThe Role of Box Plots in Comparing Multiple Data Sets
The Role of Box Plots in Comparing Multiple Data SetsCIToolkit
 
Advancing Enterprise Risk Management Practices- A Strategic Framework by Naga...
Advancing Enterprise Risk Management Practices- A Strategic Framework by Naga...Advancing Enterprise Risk Management Practices- A Strategic Framework by Naga...
Advancing Enterprise Risk Management Practices- A Strategic Framework by Naga...Nagarjuna Reddy Aturi
 
Paired Comparison Analysis: A Practical Tool for Evaluating Options and Prior...
Paired Comparison Analysis: A Practical Tool for Evaluating Options and Prior...Paired Comparison Analysis: A Practical Tool for Evaluating Options and Prior...
Paired Comparison Analysis: A Practical Tool for Evaluating Options and Prior...CIToolkit
 
How Technologies will change the relationship with Human Resources
How Technologies will change the relationship with Human ResourcesHow Technologies will change the relationship with Human Resources
How Technologies will change the relationship with Human ResourcesMassimo Canducci
 
Adapting to Change: Using PEST Analysis for Better Decision-Making
Adapting to Change: Using PEST Analysis for Better Decision-MakingAdapting to Change: Using PEST Analysis for Better Decision-Making
Adapting to Change: Using PEST Analysis for Better Decision-MakingCIToolkit
 
Operations Management -- Sustainability and Supply Chain Management.pdf
Operations Management -- Sustainability and Supply Chain Management.pdfOperations Management -- Sustainability and Supply Chain Management.pdf
Operations Management -- Sustainability and Supply Chain Management.pdfcoolsnoopy1
 

Último (20)

Shaping Organizational Culture Beyond Wishful Thinking
Shaping Organizational Culture Beyond Wishful ThinkingShaping Organizational Culture Beyond Wishful Thinking
Shaping Organizational Culture Beyond Wishful Thinking
 
Better SAFe than sorry - Why scaled agile frameworks do not necessarily impro...
Better SAFe than sorry - Why scaled agile frameworks do not necessarily impro...Better SAFe than sorry - Why scaled agile frameworks do not necessarily impro...
Better SAFe than sorry - Why scaled agile frameworks do not necessarily impro...
 
HOTEL MANAGEMENT SYSTEM PPT PRESENTATION
HOTEL MANAGEMENT SYSTEM PPT PRESENTATIONHOTEL MANAGEMENT SYSTEM PPT PRESENTATION
HOTEL MANAGEMENT SYSTEM PPT PRESENTATION
 
Management 11th Edition - Chapter 11 - Adaptive Organizational Design
Management 11th Edition - Chapter 11 - Adaptive Organizational DesignManagement 11th Edition - Chapter 11 - Adaptive Organizational Design
Management 11th Edition - Chapter 11 - Adaptive Organizational Design
 
Effective learning in the Age of Hybrid Work - Agile Saturday Tallinn 2024
Effective learning in the Age of Hybrid Work - Agile Saturday Tallinn 2024Effective learning in the Age of Hybrid Work - Agile Saturday Tallinn 2024
Effective learning in the Age of Hybrid Work - Agile Saturday Tallinn 2024
 
Choosing the best strategy qspm matrix.pptx
Choosing the best strategy qspm matrix.pptxChoosing the best strategy qspm matrix.pptx
Choosing the best strategy qspm matrix.pptx
 
The Final Activity in Project Management
The Final Activity in Project ManagementThe Final Activity in Project Management
The Final Activity in Project Management
 
BoSUSA23 | Chris Spiek & Justin Dickow | Autobooks Product & Engineering
BoSUSA23 | Chris Spiek & Justin Dickow | Autobooks Product & EngineeringBoSUSA23 | Chris Spiek & Justin Dickow | Autobooks Product & Engineering
BoSUSA23 | Chris Spiek & Justin Dickow | Autobooks Product & Engineering
 
How-How Diagram: A Practical Approach to Problem Resolution
How-How Diagram: A Practical Approach to Problem ResolutionHow-How Diagram: A Practical Approach to Problem Resolution
How-How Diagram: A Practical Approach to Problem Resolution
 
Mind Mapping: A Visual Approach to Organize Ideas and Thoughts
Mind Mapping: A Visual Approach to Organize Ideas and ThoughtsMind Mapping: A Visual Approach to Organize Ideas and Thoughts
Mind Mapping: A Visual Approach to Organize Ideas and Thoughts
 
Management 11th Edition - Chapter 13 - Managing Teams
Management 11th Edition - Chapter 13 - Managing TeamsManagement 11th Edition - Chapter 13 - Managing Teams
Management 11th Edition - Chapter 13 - Managing Teams
 
Hajra Karrim: Transformative Leadership Driving Innovation and Efficiency in ...
Hajra Karrim: Transformative Leadership Driving Innovation and Efficiency in ...Hajra Karrim: Transformative Leadership Driving Innovation and Efficiency in ...
Hajra Karrim: Transformative Leadership Driving Innovation and Efficiency in ...
 
Management 11th Edition - Chapter 9 - Strategic Management
Management 11th Edition - Chapter 9 - Strategic ManagementManagement 11th Edition - Chapter 9 - Strategic Management
Management 11th Edition - Chapter 9 - Strategic Management
 
Exploring Variable Relationships with Scatter Diagram Analysis
Exploring Variable Relationships with Scatter Diagram AnalysisExploring Variable Relationships with Scatter Diagram Analysis
Exploring Variable Relationships with Scatter Diagram Analysis
 
The Role of Box Plots in Comparing Multiple Data Sets
The Role of Box Plots in Comparing Multiple Data SetsThe Role of Box Plots in Comparing Multiple Data Sets
The Role of Box Plots in Comparing Multiple Data Sets
 
Advancing Enterprise Risk Management Practices- A Strategic Framework by Naga...
Advancing Enterprise Risk Management Practices- A Strategic Framework by Naga...Advancing Enterprise Risk Management Practices- A Strategic Framework by Naga...
Advancing Enterprise Risk Management Practices- A Strategic Framework by Naga...
 
Paired Comparison Analysis: A Practical Tool for Evaluating Options and Prior...
Paired Comparison Analysis: A Practical Tool for Evaluating Options and Prior...Paired Comparison Analysis: A Practical Tool for Evaluating Options and Prior...
Paired Comparison Analysis: A Practical Tool for Evaluating Options and Prior...
 
How Technologies will change the relationship with Human Resources
How Technologies will change the relationship with Human ResourcesHow Technologies will change the relationship with Human Resources
How Technologies will change the relationship with Human Resources
 
Adapting to Change: Using PEST Analysis for Better Decision-Making
Adapting to Change: Using PEST Analysis for Better Decision-MakingAdapting to Change: Using PEST Analysis for Better Decision-Making
Adapting to Change: Using PEST Analysis for Better Decision-Making
 
Operations Management -- Sustainability and Supply Chain Management.pdf
Operations Management -- Sustainability and Supply Chain Management.pdfOperations Management -- Sustainability and Supply Chain Management.pdf
Operations Management -- Sustainability and Supply Chain Management.pdf
 

A hybrid approach to achieve oa

  • 1. A hybrid approach to achieve organizational agility An empirical study of a food company Majid Nejatian Tarbiat Modares University (TMU), Tehran, Iran Mohammad Hossein Zarei Politecnico di Milano, Milan, Italy and Universidad Politécnica de Madrid, Madrid, Spain Mehran Nejati Edith Cowan University, Joondalup, Australia, and Seyed Mahmood Zanjirchi Yazd University, Yazd, Iran Abstract Purpose – In today’s intense global competition, agility is advocated as a fundamental characteristic for business survival and competitiveness. The purpose of this paper is to propose a practical methodology to achieve and enhance organizational agility based on strategic objectives. Design/methodology/approach – In the first step, a set of key performance indicators (KPIs) of the organization being studied are recognized and classified under the perspectives of balanced scorecard (BSC). Critical success factors are then identified by ranking the KPIs according to their importance in achieving organizational strategic objectives using the Technique for Order of Preference by Similarity to Ideal Solution (TOPSIS). In the second step, three houses of quality (HOQs) are constructed sequentially to identify and rank the main agile attributes, agile enablers, and improvement paths. In addition, in order to translate linguistics judgments of practitioners into numerical values in building HOQs, fuzzy logic is employed. Findings – The capability of the proposed methodology is demonstrated by applying it to a case of a multi-national food company in Iran. Through the application, the company could find the most suitable improvement paths to improve its organizational agility. Research limitations/implications – A limited number of KPIs were chosen due to computational and visual constraints related to HOQs. Another limitation, similar to other agility studies, which facilitate decision making among agility metrics, was that the metrics were more industry-specific and less inclusive. Practical implications – A strong practical advantage for the application of the methodology over directly choosing agility metrics without linking them is that through the methodology, the right metrics were selected that match organization’s core values and marketing objectives. While metrics may ostensibly seem unrelated or inappropriate, they actually contributed to the right areas where there were gaps between the current and desired level of agility. It would otherwise be impossible to choose the right metrics without a structured methodology. Originality/value – This paper proposes a novel methodology for achieving organizational agility. By utilizing and linking several tools such as BSC, fuzzy TOPSIS, and quality function deployment (QFD), the proposed approach enables organizations to identify the most appropriate agile attributes, agile enablers, and subsequently agile improvement paths. Keywords Quality function deployment, Balanced scorecard, House of quality, Organizational agility, Enterprise agility, Agile organization Paper type Research paper 1. Introduction Uncertainty and change have always been significant issues in the rapidly changing business environment (Zhang and Sharifi, 2000). The beginning of the twenty-first century was coincided with increasing customers’ dynamic demands and deterioration of economic circumstance in many countries which has changed the marketplace into “battlefield” (Yusuf et al., 1999). Since then, “business turbulence” and “change” have been recognized as the main causes of failure in many industries (Small and Downey, 1996), even among Benchmarking: An International Journal Vol. 25 No. 1, 2018 pp. 201-234 © Emerald Publishing Limited 1463-5771 DOI 10.1108/BIJ-09-2016-0147 Received 28 September 2016 Revised 22 November 2016 Accepted 2 December 2016 The current issue and full text archive of this journal is available on Emerald Insight at: www.emeraldinsight.com/1463-5771.htm 201 Organizational agility
  • 2. giant organizations. This fact has forced enterprises to efficiently respond to the market changes in a quicker and more flexible way. In the beginning of the 1990s, a new solution for managing dynamic and constantly changing environments emerged by the experts of Iacocca Institute of Lehigh University (USA), called agility (Sherehiy et al., 2007). Ever since its inception, agility has become a prevailing topic and received increasing attention from both industry and academia. Various definitions of agility have been presented by different scholars; all of which share the same trait: “the ability of an enterprise to survive and prosper in a competitive and unpredictable environment by responding quickly and effectively to any kind of change – anticipated or unpredicted – in proper ways and due time” (Gunasekaran, 1999; Brown and Bessant, 2003; Sharifi and Zhang, 2001). It aims at satisfying customers’ various demands in terms of price, quality, quantity, specification, and delivery (Prince and Kay, 2003). Although in the beginning, it solely referred to the manufacturing context, today the paradigm of agility is expanded to different types of organizations in various industries (Christopher, 2000). Different terms are used in the literature to refer to agility at organizational level: enterprise agility (Yang and Liu, 2012), business agility (Morgan, 2004), and organizational agility (Nejatian and Zarei, 2013). Despite some minor differences, they can be interchangeably used. Throughout this paper, the term “organizational agility” is used. Previous literature has shown that organizational agility is tightly linked with the success of organizations. It empowers organizations to produce and deliver innovative products and services in a cost-efficient way (Swafford et al., 2006), increases customer satisfaction and competitiveness, eliminates non-value added activities, decreases manufacturing costs (Lin et al., 2006), leading to enhanced organizational excellence (Nafei, 2016b) and organizational performance (Kuleelung and Ussahawanitchakit, 2015; Nafei, 2016a). However, agility is not a solid goal to be gained and then forgotten; rather, it is the means to maintain competitiveness in unpredictable, dynamic, and constantly changing markets (Jackson and Johansson, 2003) and deliver the right products at the right time to the customers (Agarwal et al., 2007; Lin et al., 2006; Yusuf et al., 1999). Hence, there is need for methodologies that continuously measure the gap between current and desired levels of organizational agility along with the changes in the organizational environment. However, the literature of agility scants such studies. This paper tries to fill the void by proposing a systematic methodology and its application for improving organizational agility. The methodology considers organization’s strategy and core competencies and highlights the specific areas of focus that results in higher organizational agility. As such, the main objective of this study is to propose a structured methodology that improves organizational agility. The methodology is aimed to select the right agility metrics (i.e. key performance indicators (KPIs), agile attributes, agile enablers, and improvement paths) that are in line with organizational strategic goals and lead to increased market competitiveness. Moreover, since previous methodological studies in the area of organizational agility scant practical applications, another objective of this research is to show a full empirical implementation of the proposed methodology in a competitive market. The remainder of the paper is organized as the following. In Section 2, a review of the prior studies on agility is provided, with a specific concentration on agile attributes, agile enablers, and methodologies to achieve agility. Section 3 explains the proposed methodology of the current study. Next, an empirical investigation is conducted to demonstrate the application of the proposed methodology and the findings in Section 4. Discussions of the findings, limitations, and some future research directions are provided in Section 5. Finally, Section 6 rounds up and concludes the paper. 2. Literature review This section reviews the literature of organizational agility with the focus on methodological studies. Since most of these studies, as well as our paper, use specific agility metrics such as 202 BIJ 25,1
  • 3. agile attributes and agile enablers, we first elucidate these metrics and briefly review the literature around them. Then, we review and compare the main methodological papers about organizational agility. 2.1 Agile attributes Agile organizations are characterized by “agile attributes,” also known as “agility capabilities,” which provide enterprises the potency to promptly respond to the market changes (Ren et al., 2003; Bottani, 2010; Tallon and Pinsonneault, 2011). Agile attributes are essential capabilities that a company has to develop within its structure in order to effectively cope with the changes or pressures from the business environment that drive companies to embrace the agile paradigm (called agility drivers) (Sharifi and Zhang, 2001). During the past years, researchers have found that the core concept of agile attributes, which had been solely referred to manufacturing, has to be extended to the entire supply chain as it is impossible to achieve agile manufacturing while the rest of the supply chain operate on a normal speed (Christopher, 2000; Van Hoek et al., 2001; Ren et al., 2001; Sherehiy et al., 2007; Nejatian and Zarei, 2013). This calls for engaging all the organizations within the supply chain, either manufacturing or not, to move toward organizational agility. Various agile attributes have been presented in the literature. Kidd (1994) suggested that agility can be achieved through the following capabilities: “integration of organization, highly skilled and knowledgeable people, and advanced technologies.” In a similar view, Goldman et al. (1995) and Gunasekaran (1998) have introduced four main dimensions of agility as “enriching the customer, co-operation, organizing to master change and uncertainty, and leveraging the impact of people and information.” Ren et al. (2001) and Christopher and Towill (2001) expressed that agile attributes encompass the integration of information systems or technologies, people, business processes, and facilities. Dove (1996) and Swafford et al. (2006) proposed the term “flexibility” as one of the main foundations of agility. Yusuf et al. (1999) stated that the development of a strategic architecture, which presents a corporate wide map of core skills, enables organization to make rapid changes and afford reconfiguration of the business when an opportunity emerges. Mohanty and Deshmukh (2001) proposed various attributes of agility ranging from rapid response to enquiry and customer service to image and quality. Yusuf et al. (1999) proposed a comprehensive taxonomy of agile attributes based on their review of literature comprising 32 attributes characterizing an agile enterprise classified under 10 decision domains. We adopt their taxonomy in our methodology due to its completeness and inclusion of decision domains. The taxonomy is shown in Table I. It has been suggested by Ren et al. (2003) that different agile attributes would steer to different levels of competitive bases, also referred to as competitive or competing priorities. According to Yusuf et al. (1999), competitive bases, which companies typically compete along, include responsiveness, new product introduction, delivery, flexibility, quality, concern for the environment, and international competitiveness. The relative importance of each competitive base in achieving competitive advantage depends on the specific market field (Bottani, 2009a). Moreover, due to trade-offs between competitive bases, it has been ascertained that companies cannot excel in all of them simultaneously (Burgess et al., 1998). Therefore, agile attributes may alter depending on the competitive bases the enterprises are aspiring to surpass in (Ren et al., 2003). 2.2 Agile enablers In order to best achieve agile attributes, companies should utilize appropriate leverages, referred to as “agile enablers” (Lin et al., 2006; Bottani, 2009a, 2010). Gehani (1995) identified six key actions necessary to implement an agile strategy, namely, “cross-functional team 203 Organizational agility
  • 4. sharing, empowerment for front-line decision making, modular integration of available technologies, delayed design specification, product succession planning, and enterprise-wide integration of learning.” The adoption of cross-functional teams and concurrent engineering practices as the substantial means for achieving time compression was also supported by Kumar and Motwani (1995). Later, seminal studies of Gunasekaran (1998, 1999) comprehensively defined and identified main agile enablers in the agile manufacturing context, namely, “virtual enterprise formation tools/metrics, physically distributed teams and manufacturing, rapid partnership formation tools/metrics, concurrent engineering, integrated product/production/business information system, rapid prototyping tools, and electronic commerce.” The taxonomy was extracted from the work of earlier researchers (e.g. Cho et al., 1996; Gehani, 1995; Burgess, 1994). It is still being used as the basis for many current agility studies due to its comprehensiveness and validity. 2.3 Agility methodologies One of the first integrated proposed frameworks to achieve agility has been offered by Gunasekaran (1998) which illustrates how the main capabilities of agile manufacturing such as “co-operation,” “value-based pricing strategies,” “investments in people and information,” Decision domain Related agile attributes Integration 1. Concurrent execution of activities 2. Enterprise integration 3. Information accessible to employees Competence 4. Multi-venturing capabilities 5. Developed business practice difficult to copy Team building 6. Empowered individuals working in teams 7. Cross-functional teams 8. Teams across company borders 9. Decentralized decision making Technology 10. Technology awareness 11. Leadership in the use of current technology 12. Skill and knowledge enhancing technologies 13. Flexible production technology Quality 14. Quality over product life 15. Products with substantial value-addition 16. First-time right design 17. Short development cycle times Change 18. Continuous improvement 19. Culture of change Partnership 20. Rapid partnership formation 21. Strategic relationship with customers 22. Close relationship with suppliers 23. Trust-based relationship with customers/suppliers Market 24. New product introduction 25. Customer-driven innovations 26. Customer satisfaction 27. Response to changing market requirements Education 28. Learning organization 29. Multi-skilled and flexible people 30. Workforce skill upgrade 31. Continuous training and development Welfare 32. Employees’ satisfaction Source: Yusuf et al. (1999) Table I. List of agile attributes and in decision domains 204 BIJ 25,1
  • 5. and “organizational changes” should be supported and integrated with appropriate agile enablers to develop an adaptable organization. Gunasekaran’s (1998) study illustrates the impact of agile enablers on agile attributes and how it can contribute to organizational agility. Yet, the model was mainly conceptual and could not fully provide a practical basis for companies to achieve agility. Later, two other seminal studies of Zhang and Sharifi (2000) and Sharifi et al. (2001) contributed to the evolution of agility literature. They developed a three-step approach to implement agility in manufacturing organizations which links “agility drivers” to four overriding agile capabilities (also known as agile attributes). In the final step, a set of viable tools, labeled as “agile providers,” are described which guarantees the achievement of capabilities. Some methodological studies in the context of agility investigate the impact of agility on organizational performance. Jackson and Johansson (2003) proposed a three-step model for analyzing the agility of production systems. Their methodology started by assessing the degree of market turbulence to determine the relevance of agility in a specific context. Then, by concentrating on the potentials to enhance flexibility and change, the strategic view of the company was examined in order to achieve competitive advantage. Finally, the agile attributes required for future were identified. The aim of their model was to evaluate organizational performance against four main agile attributes: “product-related change capabilities,” “change competency,” “co-operation,” and “people” to identify the required improvements. The studies of Dowlatshahi and Cao (2005, 2006) explored the impact of alignment between two agile enablers, namely, virtual enterprise and information technology (IT) on the business performance of agile manufacturing in different industries. In the same vein, Vázquez-Bustelo et al. (2007) provided empirical support for the linkage between agility and business performance and showed that agility can become a critical success factor (CSF) in different industrial fields in Spain. Furthermore, some other methodological studies propose agility measurement models and then test it through in-field applications or case studies (e.g. Lin et al., 2006; Ren et al., 2009; Bottani, 2009a). Another stream of agility literature is devoted to deductive approaches and methodologies based on empirics. Zhang and Sharifi (2007) provided a taxonomy of agility strategies based on an empirical study in the UK. They categorized the companies into three clusters, namely, quick, responsive, and proactive players, and investigated the main characteristics of each cluster based on the typical agility drivers and attributes. Another in-field analysis of agility was performed by Bottani (2009b) who studied two cases related to agile manufacturing and assessed the current agility level of the studied companies. Later, she conducted another empirical study (Bottani, 2010) to investigate the profile of agile companies and the enablers practically adopted by them for achieving agility. The findings offered a detailed description of the agile paradigm and suggested new taxonomies for agile attributes and enablers. More recently, a stream of literature has expanded agility to supply chain field (e.g. Gligor et al., 2015; Fayezi et al., 2015; Kisperska-Moron and Swierczek, 2009). For example, in a relevant study to ours, Kisperska-Moron and Swierczek (2009) explored the main agile attributes of supply chain in Polish companies. Table II summarizes main agility methodologies and conceptual studies in the pertinent literature. One of the recent seminal agility methodologies has been proposed by Bottani (2009a). According to the review of literature by that study, most of the previous methodological studies about agility share a general structure: (1) recognizing competitive bases by which organizations can develop competitive advantage considering the specifications of the marketplace; (2) identifying agile attributes boosting the recognized competitive bases; and (3) applying agile enablers to achieve the essential agile attributes. 205 Organizational agility
  • 6. Objective Applicabilityof themethodologyMethodsandtechniquesMainidentifiedagilitymetrics Findingsfromtheapplication (ifany) Gunasekaran (1998) Proposingaconceptual frameworkforagile manufacturinganddefiningkey agileenablers ManufacturingBusinessprocessredesign,legal issues,concurrentengineering, computerintegrated manufacturing,cost management,totalquality management,andinformation technology Keyagileenablers,namely, virtualenterprise,formation tools/metrics,physically distributedmanufacturing architectureandteams,rapid partnershipformationtools/ metrics,concurrentengineering, integratedproduct/production/ businessinformationsystem, rapidprototypingtools,and electroniccommerce Conceptualpaper–no application Zhangand Sharifi(2000) Proposingamethodologyfor enhancingagilitybasedona conceptualagilitymodel ManufacturingDatadrivenAsetofagilitycapabilities categorizedunderresponsiveness, competency,flexibility,andspeed aswellasagilityprovidersand agilitydrivers Validationoftheproposed methodologybyindustrial questionnairesurveysand casestudies Linetal. (2006) Proposinganagilitymodelfor measuringandenhancing supplychainagility SupplychainFuzzylogicandmultiple- criteriadecisionmaking (MCDM) Supplychainagilityattributes categorizedundercollaborative relationships,process integration,information integration,andcustomer/ marketingsensitivity Validationoftheproposed model,providingaholistic pictureofsupplychainagility, identifyingsupplychain weaknesses,facilitatingquality improvementinthesupplychain Sherehiyetal. (2007) Conceptualreviewofagile manufacturingandagile workforcetoextendto organizationalagility Organizational levelatall domains ExtensiveliteraturereviewKeyorganizationalagile attributesnamelyflexibility, responsiveness,speed,cultureof change,integrationandlow complexity,high-qualityand customizedproducts,and mobilizationofcore competencies Conceptualreview–no application (continued) Table II. Main conceptual and methodological studies in the agility literature 206 BIJ 25,1
  • 7. Objective Applicabilityof themethodologyMethodsandtechniquesMainidentifiedagilitymetrics Findingsfromtheapplication (ifany) Bottani (2009a) Proposingapracticalintegrated methodologyforenhancing agilitywhichlinkscompetitive bases,agileattributes,and agileenablers Organizational levelatall domains QFD,HOQ,andfuzzylogicCompetitivebases,agile attributes,andagileenablers Norealapplicationisprovided. Anillustrativeexampleusing thedatafromtheliteratureis giventoshowtheapplicability ofthemethodology CurrentpaperProposingandapplyinga practicalintegrated methodologyforenhancing agilitywhichlinkscompetitive bases,agileattributes,agile enablers,andimprovement paths Organizational levelatall domains QFD,HOQ,fuzzylogic, TOPSIS,andBSC Competitivebases,agile attributes,agileenablers,and improvementpaths Fullapplicationoftheproposed methodologytoamulti- nationalcompanyina competitivefoodmarket Table II. 207 Organizational agility
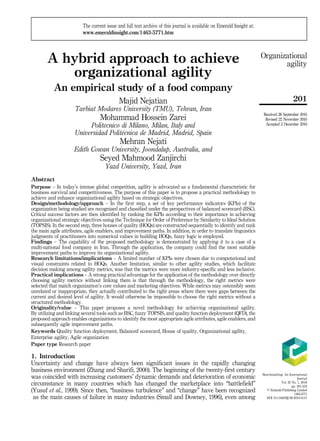
  • 8. Her study developed an integrated methodology for implementing agility. The procedure was grounded in linking competitive bases, agile attributes, and agile enablers to identify, depending on the competitive priorities of the market field, appropriate agile enablers each company should exploit to achieve the required agile attributes. To this end, the author applied house of quality (HOQ) which is the main component of quality function deployment (QFD) methodology. The approach could be easily adopted by companies that are willing to implement agile strategies. The current study attempts to develop Bottani’s (2009a) methodology and shows its applications by addressing its shortcomings and following the future research directions introduced in that paper. Hence, this paper makes several contributions to the work of Bottani (2009a) in specific and to the literature of agility in general. First, the study of Bottani (2009a) leaves a void regarding the application of the methodology. Bottani’s methodology consisted of two consecutive HOQs which ends up with providing agile enablers resulting from the second HOQ. Identifying agile enablers leaves the practitioners with the question of “how these agile enablers can practically lead to enhancing agility?” Our methodology answers this concern by adding a third HOQ which identifies a set of pivotal “improvement paths” that satisfy the identified agile enablers. Second, in the study of Bottani (2009a), there was no systematic procedure to recognize and categorize CSFs of the organization. To tackle this shortcoming, we have used a balanced scorecard (BSC) to clearly classify KPIs under financial and non-financial organizational measures and prioritize them accordingly in order to diagnose which are the most important ones for organization’s success. Third, by a successful application of the methodology in the competitive food industry, this research transforms the methodology from purely theoretical to an empirically tested one, as suggested in the future research directions of Bottani (2009a). Generally, the field of organizational agility suffers from scarcity of empirical studies (Sherehiy et al., 2007). Our empirical work contributes to the body of literature in the field of agility by showing the applicability of the methodology in a highly competitive market. Fourth, our implementation reveals the correlations between agile attributes, as well as agile enablers, and improvement paths calculated in the roof of the HOQs. The literature scants research that investigates the interrelation between agility metrics in a practical domain (Bottani, 2009a). Our empirical results indicate that the correlations among agile attributes, enablers, and improvement paths have significant impacts on the final scores of the HOQs. This finding provides valuable insights for further analysis. 3. The proposed approach The proposed approach in this study is grounded on the earlier study by Bottani (2009a). The general procedure of the proposed methodology is described in the following. The stages of the methodology and the methods used at each step are presented in Figure 1. The methodology starts with defining the appropriate indicators for evaluating the organizational performance. These indicators will be selected by means of comparing and analyzing information obtained from first, mission, vision, and values (MVV), strategies, and overall objectives of the company; and second, from a pool of indicators, which is extracted from the existing literature of organizational performance assessment. The company’s MVV, strategies, and overall objectives provide the criteria for short listing and selecting the KPIs under four major perspectives inspired by BSC: financial, customer, internal processes, and learning and growth. Then, the importance of each KPI and the performance gap between the existing performance level and the desired one will be measured based on the opinions of experts in the company by means of questionnaire within a two-stage process. Criteria are prioritized not only based on the gap analysis, but also their importance in order to ensure that both KPI’s performance gap and importance are 208 BIJ 25,1
  • 9. taken into account. To this end, we have deployed fuzzy Technique for Order of Preference by Similarity to Ideal Solution (TOPSIS), which is a well-known method in multiple-criteria decision-making (MCDM), to rank all the indicators based on the “importance of the indicator” and “level of performance gap.” As a rule of thumb, the upper quartile (the highest 25 percent of KPIs) is chosen as the CSFs of the company for achieving its strategic objectives, since they all have high importance and yet large gaps in between their current and desired performance levels. Nonetheless, the percentage of CSFs to be chosen out of KPIs is relative to several issues such as top managers’ dedication and willingness, and assigned budget, resources, and time. Our methodology uses a sequence of HOQs, the main component of QFD. QFD has shown to be a useful tool to facilitate strategic decision making especially when combined with fuzzy logic to address uncertain, vague, or volatile environments. Fuzzy QFD has been used for different purposes such as new product planning and design (Chen and Ko, 2009; Liu, 2009), supplier selection (Lima-Junior and Carpinetti, 2016; Dursun and Karsak, 2013; Bevilacqua et al., 2006), and strategic logistics management (Bottani and Rizzi, 2006). Coming to the context of agility, it ensures that the right agility metrics in line with the marketing objectives are selected which accordingly mitigate the risk of misalignment between the selected agility metrics and organization core values. It also fills the missing link in the literature between the “What” are the appropriate organizational capabilities and “How” they can be used to increase Literature analysis Forming the pool of performance indicators Categorizing the KPIs Designing the questionnaire for KPIs importance Designing the questionnaire for gap measurement Ranking the KPIs Developing the first HOQ to select agile attributes Developing the second HOQ to select agile enablers BSC Fuzzy-Likert scale Fuzzy TOPSIS Fuzzy QFD Fuzzy-Likert scale Stages Methods Stage 1: identifying main KPIs Stage 2: KPIs ranking Stage 3: opting improvement paths Developing the third HOQ to select improvement paths Fuzzy QFD Fuzzy QFD Figure 1. The structure of the proposed approach 209 Organizational agility
  • 10. competitiveness and efficiency (Koskinen, 2014). In our first HOQ, CSFs are satisfied using relevant agile attributes. In the second HOQ, the most important agile attributes resulted from the first HOQ are linked with agile enablers. Finally, in the third HOQ, agile enablers are achieved through a set of improvement paths (Figure 2). Since one of our contributions is adding a new HOQ to identify improvement paths, the processes of the third HOQ are explained in more detail. For an elaborate reading on the processes of the first two HOQs, readers are directed to Bottani (2009a). As shown in Figure 2, the proposed approach requires building three HOQs. The structure of these houses is shown in Figure 3. The third HOQ has a structure similar to the first two HOQs and aims to identify the most critical improvement paths to achieve agile enablers swiftly. Agile enablers are placed in the “Whats” column (AEk, k ¼ 1, …, p), while improvement paths are located in the “Hows” row (IPd, d ¼ 1, …, g). Then, by considering the relationship between agile enablers (AEk) and improvement paths (IPd) denoted by (Rkd). As well as the correlation between the dth and the d0 th improvement path denoted by (Tdd0), the relative importance (RId) and the final score of each improvement path (scored) can be calculated according to the following equations: RId ¼ Xp k¼1 Wk  Rkd d ¼ 1; . . .; g (1) scored ¼ RId þ X d0 ad Tdd0  RId0 d ¼ 1; . . .; g (2) Finally, using the following equation, the fuzzy scores of the improvement paths are converted into non-fuzzy figures and used for prioritizing the improvement paths: crisp value ¼ l þ2mþu 4 (3) Therefore, the output of the current method is a collection of the most pivotal improvement paths, ranked based on their relative priority and importance in budget allocation and implementation. These improvement paths are developed in line with the four perspectives of BSC to achieve CSFs. Using the proposed methodology enhances the agility of an Identifying agile enablers to achieve agile attributes Identifying agile attributes enhancing CSFs Identifying and selecting CSFs Determining improvement paths to achieve agile enablers Third HOQ “Whats”: agile enablers “Hows”: improvement paths Second HOQ “Whats”: agile attributes “Hows”: agile enablers First HOQ “Whats”: CSFs “Hows”: agile attributes Figure 2. The four-step methodological approach for achieving organizational agility 210 BIJ 25,1
  • 11. organization and enables it to identify, understand, and predict changes in the business and market environment to react quickly to these changes creating a competitive advantage for the organization. 4. The empirical investigation 4.1 Description of the case Food industry was selected as the case of this paper due to its highly competitive environment, significant effect on GDP, and its major role on national employment level. The research approach was based on in-field analysis and the selected case was a company called Nutricia MMP, an affiliation of Group DANONE, a globally high-ranked leader in the food industry. The company’s mission is “to bring health through food to the largest number of people possible.” Correlation matrix Tdd’ Relationship matrix (Rkd ) Relative importance of IP (RId) Ranking of IP (scored ) Improvement paths (IPd ) Importanceweight(Wk ) Agileenablers(AEk ) Correlation matrix Tkk’ Relationship matrix (Rjk ) Relative importance of AE (RIk ) Agile enablers (AEk ) (Wj )Importanceweight Agileattributes(AAj ) Ranking of AE (scorek ) Correlation matrix Tjj’ Agile attributes (AAj ) Relationship matrix (Rij ) Relative importance of AA (RIj ) Ranking of AA (scorej ) (Wi )Importanceweight (CSFi ) Figure 3. The structure of HOQs 211 Organizational agility
  • 12. The company is specialized in baby nutrition such as infant milk powders and its factory site is located in the city of Mashhad, Iran. The factory operates to the highest of quality standards and has recently been selected as a benchmark for the province of Khorasan Razavi by the Ministry of Health and the Institute of Standards. 4.2 Questionnaires’ contents and data collection process The required data for this study were collected through two questionnaires: questionnaire (1) for identifying the major performance measurement indicators and their importance, and questionnaire (2) for measuring the gap between actual and desired levels of agility for each indicator. Both questionnaires were returned to the research team after being answered by the experts (100 percent response rate). No missing or incomplete data were observed and all the collected responses were used for the analysis. Moreover, in this study, we have considered two groups as “experts”: first, all top and middle managers of the subject company; and second, academic researchers and university lecturers holding a PhD in management with relevant research experience in organization agility. The purpose of developing questionnaire (1) was to identify the major performance measurement indicators of the company in order to access its strategic goals. Therefore, based on the review of the relevant literature on performance measurement of food producing industries, a number of suitable indicators were extracted to form questionnaire (1). Then the questionnaire was given to the experts for validation. After making necessary amendments, the questionnaire was confirmed. The final performance measurement indicators used in questionnaire (1) are shown in Figure 4. In order to consider the importance of each indicator in questionnaire (1), a five-point Likert scale was applied ranging from “the least important” to “very important.” Totally, there were 45 questions divided into four sections. After collecting the responses from the experts of the company, all the questionnaires were sent to the CEO of the company to score the questionnaires (i.e. from 1 to 10) based on the managers’ experience and expertise in the “CEO Score” section of the questionnaire. The CEO score in fact shows the importance of respondent’s ideas. For instance, the CEO might be willing to outweigh the responses of a department manager over a supervisor. The questionnaires were then submitted to the research team and with the information collected from the questionnaire (1), questionnaire (2) was developed. The ranges of responses for both questionnaires were designed based on the fuzzy numbers introduced by Cheng et al. (1999). The value of these fuzzy numbers and their linguistic expressions are presented in Table III. To enhance the accuracy, at the end of each section in questionnaire (1) there was a section for the experts to list the missing indicators which they think as important for the success of their organization. As such, apart from the existing indicators in the questionnaire, some indicators were proposed by the experts. After eliminating rather-identical indicators, the final indicators were constructed. They are illustrated in Figure 5. The new proposed indicators were included in questionnaire (2) to let the other experts not only rank the importance of the indicators but also identify the gap between the current situation and the optimal situation of the indicators. A five-point Likert scale, similar to questionnaire (1), was applied to questionnaire (2) as depicted in Table III. To identify the level of current performance and the level of optimal performance of each indicator, a range of [0, 4] was applied. To convert each number to its fuzzy equivalent, the range proposed by Cheng et al. (1999) was used which is shown in Table IV. 4.3 Examining the validity and reliability of questionnaires Validity of the questionnaire determines to what extent the instrument can measure the specific concept (Rasouli and Zarei, 2016). In other words, whether an instrument measures the specific concept is determined by testing its validity. Since the previous studies in the literature were considered in developing the questionnaire, and also experts’ opinions were taken into 212 BIJ 25,1
  • 13. consideration to validate the questionnaire, the validity of the research instrument was confirmed by experts. One of the established techniques to assess the reliability is Cronbach’s α obtained from the following equation: a ¼ n nÀ1 1À P S2 i S2 t ! (4) 1. Sales growth rate (Kuo and chen, 2008) 2. Return on Investment (ROI) (Wu et al., 2011) 3. Profit growth rate (Kuo and chen, 2008) 4. Business revenue (Kuo and chen, 2008) 5. Return on assets (Kuo and chen, 2008) 6. Cash flow (Yüksel and Dağdeviren, 2010) 7. Net profit (Wu et al., 2011) 8. Cost control (Wu et al., 2011) 9. Budget control (Wu et al., 2011) 10. Sale profitability (Yüksel and Dağdeviren, 2010) 11. Assets profitability (Yüksel and Dağdeviren, 2010) 12. Equity profitability (Yüksel and Dağdeviren, 2010) 13. New client development cost (Kuo and chen, 2008) 14. Turnover volume (total amount of sales income) (Wu et al., 2011) 15. Productivity (ratio of inputs (total investment) and outputs (total revenue)) (Wu et al., 2011) 16. Volume of Investment compared with the best competitors 1. Customer satisfaction (Wu et al., 2011) 2. Customer retention (Yüksel and Dağdeviren, 2010) 3. Market share (Wu et al., 2011) 4. Product/service quality (Wu et al., 2011) 5. Marketing effectiveness (Kuo and chen, 2008) 6. Flexibility of sale and service system (Wu et al., 2011) 7. Corporate and reputation Image (Wu et al., 2011) 8. Product price competitiveness 1. Product and service development (Yüksel and Dağdeviren, 2010) 2. Manufacturing process (Yüksel and Dağdeviren, 2010) 3. Product delivery (Yüksel and Dağdeviren, 2010) 4. New technologies (Yüksel and Dağdeviren, 2010) 5. On time rate of completing projects (Lee et al., 2008) 6. Goal achievement rate (Kuo and chen, 2008) 7. Standard operating procedures (SOP) (Wu et al., 2011) 8. Increasing administration efficiency (Wu et al., 2011) 9. Effectiveness and efficiency in processes and methods 10. Developing electronic form of processing methods 1. Training and skill (Yüksel and Dağdeviren, 2010) 2. Knowledge sharing (Yüksel and Dağdeviren, 2010) 3. Employees’ productivity (Wu et al., 2011) 4. Employees’ satisfaction (Cebeci, 2009) 5. Employee professionalism (Kuo and chen, 2008) 6. Communication channel (Kuo and chen, 2008) 7. Encouraging methods (Wu et al., 2011) 8. Teamwork and Cross-functional teams 9. Establishment of a learning-oriented organization (Kuo and chen, 2008) 10. Level of staff commitment to the aims of the organization 11. Optimizing human resource planning and maintaining system Financial perspective Customer perspective Key performance indicators (KPIs) of balanced scorecards Internal process perspective Learning and growth perspective Figure 4. Performance measurement indicators applied in questionnaire (1) 213 Organizational agility
  • 14. where St is the overall variance; n the number of questions of the questionnaire; and Si the variance of the ith question. The value of α would range between −1 and 1. The closer the value to 1, the higher reliability the questionnaire has. After collecting the data, SPSS computer software was used to measure the Cronbach’s α for each perspective separately. The results are presented in Table V. The integrated value of Cronbach’s α for the questionnaire was equal to 0.951. Since the value of Cronbach’s α coefficient exceeded the threshold of 0.7, the reliability of the questionnaire was confirmed. 4.4 Agile attributes and enablers used for the case In order to enhance the compatibility of the research with real-life conditions and enhance the methodology efficiency, it is recommended to triangulate from multiple sources for Linguistic expression Fuzzy number Very low (VL) (0.25: 0: 0) Low (L) (0.5: 0.25: 0) Medium (M) (0.75: 0.5: 0.25) High (H) (1: 0.75: 0.5) Very high (VH) (1: 1: 0.75) Source: Cheng et al. (1999) Table III. The value of fuzzy numbers applied in the questionnaire Financial perspective Cash management Export and business development Credibility R&D – innovation Performance-oriented culture Customer perspective KPIs introduced by experts of the firm Internal process perspective Learning and growth perspective Figure 5. Performance measurement indicators proposed by the experts of the respective company Euclidean gap Equivalent fuzzy number 0 (0.25: 0: 0) 1 (0.5: 0.25: 0) 2 (0.75: 0.5: 0.25) 3 (1: 0.75: 0.5) 4 (1: 1: 0.75) Table IV. Euclidean gap of each indicator and its fuzzy number 214 BIJ 25,1
  • 15. identifying organizational agile attributes and enablers. In this research, the first source included past research studies in the field and the second source involved analyzing the existing organizational information, as well as the analysis of market and competitors. Upon discussion with experts, the set of 32 agile attributes proposed by Yusuf et al. (1999) was determined to have comprehensiveness and decided to be used in the current study. To select agile enablers, six items from the set of enablers proposed by Gunasekaran (1998) and Gunasekaran and Yusuf (2002) were used, which comprise of supply chain management, project management, team building, knowledge management, simultaneous engineering, and IT. Besides, in a research by Bottani (2010), 18 items were introduced as agile enablers in food industry, out of which 7 new enablers were selected for the current study based on the expert opinions. Figure 6 depicts the agile enablers used in the current study. 4.5 Findings 4.5.1 KPIs ranking. Upon identifying the importance level of each indicator using questionnaire (1), and gap analysis of each indicator using questionnaire (2), all the indicators were ranked according to their importance as well as the result of gap analysis using fuzzy TOPSIS. The hierarchical structure of the decision-making problem is depicted in Figure 7. Perspectives Number of items Cronbach’s α coefficient Financial 16 0.899 Customer 8 0.780 Internal processes 10 0.795 Learning and growth 11 0.928 Table V. Cronbach’s α coefficient calculated for different BSC perspectives in the questionnaire Enablers introduced by experts of the firm Flexible manufacturing systems (FMS) or flexible assembly systems (FAS) Intranet connection Extranet connections with networked companies Total quality management (TQM) systems Enterprise resource planning (ERP) systems Time-value analysis techniques Management information systems (MIS) Figure 6. Proposed agile enablers 215 Organizational agility
  • 16. By applying TOPSIS, the final ranking of the performance indicators, shown in Table VI, was made based on the closeness coefficient to the ideal solution (CCi). This ranking revealed the CSFs for the studied organization. These factors were regarded as the initial input for the first HOQ which can be achieved through agile attributes. Capabilities with the highest crisp scores were the inputs for the second HOQ where they were empowered and achieved through agility enablers. In a similar vein, enablers with the highest crisp scores were moved to the third HOQ where they were gained through a series of improvement paths. It is for sure favorable to remove the gap of all indicators; however, considering the time and amount of resources assigned for the improvement at the time the study was being conducted, the first quartile of indicators was chosen as CSFs (Figure 8). 4.5.2 The first HOQ. In order to calculate the fuzzy weight for each CSF, shown in Table VII, the importance level of Wi was multiplied by its pertaining gap. It should Importance (of each KPI) Gap (of each KPI) KPIs Ranking Learning and growth perspective Internal process perspective Customer perspective Financial perspective 1. Sales growth rate 2. Return on investment (ROI) 3. Profit growth rate 4. Business revenue 5. Return on assets 6. Cash flow 7. Net profit 8. Cost control 9. Budget control 10. Sale profitability 11. Assets profitability 12. Equity profitability 13. New client development cost 14. Turnover volume 15. Productivity 16. Volume of Investment compared with the best competitors 17. Cash management 1. Customer satisfaction 2. Customer retention 3. Market share 4. Product/service Quality 5. Marketing effectiveness 6. Flexibility of sale and service system 7. Corporate and reputation image 8. Product price competitiveness 9. Credibility 10. Export and business development 1. Product and service development 2. Manufacturing process 3. Product delivery 4. New technologies 5. On time rate of completing projects 6. Goal achievement rate 7. Standard operating procedures (SOP) 8. Increasing administration efficiency 9. Effectiveness and efficiency in processes and methods 10. Developing Electronic form of processing methods 11. R&D – innovation 1. Training and skill 2. Knowledge sharing 3. Employee productivity 4. Employee satisfaction 5. Employee professionalism 6. Communication channel 7. Encouraging methods 8. Teamwork and Cross- functional teams 9. Establishment of a learning-oriented organization 10. Level of staff commitment to the aims of the organization 11. Optimizing human resource planning and maintaining system 12. Performance-oriented culture Figure 7. Hierarchical structure of the decision-making problem using fuzzy TOPSIS 216 BIJ 25,1
  • 17. be noted that both figures are fuzzy and the result of multiplication is accordingly a fuzzy number. The evaluation of the impacts of agile attributes on CSFs in the relationship matrix of the first HOQ required experts’ opinions from academia and industry. The opinions were Rank KPI CCi Perspective Rank KPI CCi Perspective 1 Net profit 0.712 Financial 26 Sales growth rate 0.576 Financial 2 Cash flow 0.708 Financial 27 Budget control 0.573 Financial 3 Market share 0.660 Customer 28 Customer retention 0.571 Customer 4 Profit growth rate 0.657 Financial 29 Return on investment (ROI) 0.562 Financial 5 Employee productivity 0.649 Learning and growth 30 Goal achievement rate 0.559 Internal Process 6 Communication channel 0.634 Learning and Growth 31 Optimizing human resource planning and maintaining system 0.553 Learning and Growth 7 Level of staff commitment to the aims of the organization 0.632 Learning and growth 32 Performance-oriented culture 0.552 Learning and growth 8 Knowledge sharing 0.628 Learning and growth 33 Assets profitability 0.548 Financial 9 Training and skill 0.625 Learning and growth 34 Marketing effectiveness 0.547 Customer 10 Cash management 0.624 Financial 35 Flexibility of sale and service system 0.544 Customer 11 Teamwork and cross-functional teams 0.622 Learning and growth 36 Turnover volume 0.541 Financial 12 Customer satisfaction 0.605 Customer 37 Return on assets 0.540 Financial 13 Business revenue 0.605 Financial 38 Manufacturing process 0.540 Internal process 14 Sale profitability 0.602 Financial 39 Product delivery 0.539 Internal process 15 Credibility 0.600 Customer 40 Product and service development 0.532 Internal process 16 Employee professionalism 0.597 Learning and growth 41 Ontime rate of completing projects 0.527 Internal process 17 Employee’s satisfaction 0.596 Learning and growth 42 Equity profitability 0.520 Financial 18 Establishment of a learning-oriented organization 0.595 Learning and growth 43 Product price competitiveness 0.514 Customer 19 Encouraging methods 0.594 Learning and Growth 44 Standard operating procedures (SOP) 0.511 Internal process 20 Cost control 0.588 Financial 45 Effectiveness and efficiency in processes and methods 0.506 Internal process 21 Export and business development 0.588 Customer 46 Developing electronic form of processing methods 0.495 Internal process 22 R&D – innovation 0.586 Internal process 47 Increasing administration efficiency 0.473 Internal process 23 Productivity 0.584 Financial 48 Volume of Investment compared with the best competitors 0.468 Financial 24 Product/Service quality 0.579 Customer 49 New client development cost 0.456 Financial 25 Corporate and reputation Image 0.576 Customer 50 New technologies 0.441 Internal process Table VI. Final ranking of performance indicators 217 Organizational agility
  • 18. narratively obtained through phone interviews and then were converted into their fuzzy equivalents. In order to enhance the accuracy of HOQs, the opinions were gathered from three key groups, comprising of managers and experts at the case organization, university professors with research experience in organizational agility, and active researchers in the field. Since the set of agile attributes in this study includes 32 components, evaluating their correlations was complicated as it required 496 paired comparisons. In order to tackle the complexity, this step was simplified by categorizing and ranking the agile enablers according to the findings of Yusuf et al. (1999) advocated by Bottani (2009a). In that classification, the studies that indicate correlations between different decision domains were found according to the survey of literature. These studies are shown in Table VIII. 0.54 0.56 0.58 0.6 0.62 0.64 0.66 0.68 0.7 0.72 N etprofit Cash flow M arketshare Profitgrow th rate Em ployeeproductivity Com m unication channel Financial perspective Customer perspective Internal process perspective Learning and growth perspective Levelofstaffcom m itm entto theaim s oftheorganization K now ledgesharingTraining and skill Cash m anagem ent Team w ork and cross-functionalteam s Custom ersatisfaction Businessrevenue Figure 8. The identified CFSs CSFi Wi Net profit 0.25 0.58 0.89 Cash flow 0.24 0.56 0.83 Market share 0.15 0.45 0.70 Profit growth rate 0.17 0.46 0.75 Employee productivity 0.17 0.45 0.75 Communication channel 0.12 0.40 0.67 Level of staff commitment to the aims of the organization 0.12 0.40 0.67 Knowledge sharing 0.14 0.40 0.71 Training and skill 0.15 0.39 0.69 Cash management 0.13 0.40 0.69 Teamwork and cross-functional teams 0.13 0.40 0.69 Customer satisfaction 0.07 0.33 0.59 Business revenue 0.11 0.35 0.64 Table VII. CSFs and their fuzzy weights 218 BIJ 25,1
  • 19. DD1DD2DD3DD4DD5DD6DD7DD8DD9DD10 DD1Prahaladand Hamel(1990) Goldmanetal. (1995) Goldmanand Nagel(1993) Yusufetal.(1999)and Youssef(1992) Goldmanand Nagel(1993) Corbettand Rastrick(2000) DD2Higginsand Maciariello(2004) Yusufetal.(1999), Kidd(1994) Prahaladand Hamel(1990) Jacob (2006) Prahaladand Hamel(1990) Kidd(1994) DD3KathuriaandDavis (1999) Lakemondand Berggren(2006) Higginsand Maciariello(2004) DD4Messeretal.(2006) DD5JungandWang (2006) Corbettand Rastrick(2000) DD6Earleetal.(2006) DD7Drogeetal.(2004) DD8 DD9Kidd (1994) DD10 Notes:DD1:integration;DD2:competence;DD3:teambuilding;DD4:technology;DD5:quality;DD6:change;DD7:partnerships;DD8:market;DD9:education; DD10:welfare Source:Bottani(2009a) Table VIII. Correlations between decision domains resulting from literature analysis 219 Organizational agility
  • 20. Each of the studies shown in Table VIII indicates the correlations between two specific decision domains. They were used as the basis to derive the correlations required for the roof of our HOQs. The table was also used as a guide for the experts such that by presenting the highlights of studies indicated in Table VIII, the nature of correlations between decision domains was clarified for the experts. Then, they were asked to express their own opinions about the strength of correlations between the agile attributes in the roof of the first HOQ. Thus, the roof in the first HOQ was completed as shown in Figure 9. Next, using equations similar to Equations (1) and (2), the relative importance (RIj, j ¼ 1, 2, …, 32) and the score (scorej) of each agile attributes were calculated. Results of these calculations are presented in the last row of Figure 9. Several results can be deducted from Figure 9. First, it shows that the agile enablers under competence (DD2) achieved the highest crisp scores, followed by market (DD8), education (DD9), and integration (DD1) respectively. These results were achieved due to the high correlations between the aforementioned DDs and other DDs. Specifically, there was a high correlation between competence (DD2) and quick response to market (DD8), and also the education of personnel (DD9). Second, competence (DD2) could be empowered and enhanced through integration (DD1) and applying the culture of change (DD6). Finally, team building for product development (DD3) and quality (DD5), which both are involved in developing and manufacturing products to meet customers’ expectations, as well as software and hardware technology (DD4), and partnership with suppliers and customers (DD7) were also recognized as overriding attributes to enhance organizational competence. The ranking of agile attributes was estimated based on their crisp scores shown in Table IX. 4.5.3 The second HOQ. In order to form the second HOQ, either all the agile attributes or the ones with the highest crisp scores can be moved from the first HOQ based on the time and resources assigned for the improvement. In this case study, all agile attributes presented in the first HOQ were listed under the “whats” column in the second HOQ to illustrate a comprehensive implementation of the methodology. For estimating the weight of agile attributes, the respective normalized scores in the penultimate row of the first HOQ were used. Normalization was done by dividing the fuzzy score of each capability (scorej) by the highest score (related to multi-venturing capabilities). Therefore, as shown in Figure 10 (the second HOQ), the agile attributes and their normalized weights are listed in the first and second columns of the second HOQ, respectively. In order to measure the correlations among the agile enablers in the roof of the second HOQ, prior literature was consulted. Since the existing research in this area is limited, merely some of the correlations among the agile enablers were identified. The studies indicating correlations are shown in Table X. Based on the results of the relationship matrix in Figure 10 and experts’ opinions, the roof of the second HOQ was formed. Numerical results extracted from Figure 10 shows that IT (AE6) had the highest crisp score due to frequent and high correlations with other agile enablers as well as strong relations with some agile attributes. Therefore, it had the priority for enhancing organizational agility, followed by management information systems (MISs) (AE13) and supply chain management (AE1). The ranking of agile enablers based on their crisp scores is shown in Table XI. 4.5.4 The third HOQ. Similar to the procedure of previous HOQs, all agile enablers were moved from the second HOQ to the third HOQ and listed under the “whats” column to enhance the process accuracy. Similar to the first HOQ, the estimation of the weights for agile enablers was made by using the normalized scores in the penultimate row of the second HOQ. The normalized score was calculated by dividing the fuzzy score of each enabler (scorek) by the highest score (related to IT). Therefore, as shown in Figure 11 (the third HOQ), the agile enablers and their normalized weights are listed in the first and second columns of the third HOQ, respectively. 220 BIJ 25,1
  • 21. IntegrationCompetenceTeambuildingTechnologyQualityChangePartnershipMarketEducationWelfare CriticalSuccessFactor (CSFi) Weight (Wi) Concurrent execution of activities Enterprise Integration Information accessible to employees Multi-venturing capabilities Developed business practice difficult to copy Empowered individuals working in teams Cross-functional teams Teams across company borders Decentralized decision making Technology awareness Leadership in the use of current technology Skill and knowledge enhancing technologies Flexible production technology Quality over product life Products with substantial value-addition First-time right design Short development cycle times Continuous improvement Culture of change Rapid partnership formation Strategic relationship with customers Close relationship with suppliers Trust-based relationship with customers/suppliers New product introduction Customer-driven innovations Customer satisfaction Response to changing market requirements Learning organization Multi-skilled and flexible people Workforce skill upgrade Continuous training and development Employees satisfaction Netprofit(0.25,0.58,0.89)WWSMWWWSWMMSMMWMMMWMSSMWMWW Cashflow(0.24,0.56,0.83)MWSMWWMWMMSSMMWWWMMSMWW Marketshare(0.15,0.45,0.70)WWSSMWWSSWSSSMWMWSMSSSSSMWWW Profitgrowthrate(0.17,0.46,0.75)WWSSWSSWMMMMMWMMWWMSSWMM Employeeproductivity(0.17,0.45,0.75)WMMSMMMWMMMMSSWMMSSSS Communicationchannel(0.12,0.40,0.67)MMMWMMWWMWWWSSWMWWW Levelofstaffcommitment totheaimsofthe organization (0.12,0.40,0.67)MWSSMWMWMMWSSMMMMMMMWMSS Knowledgesharing(0.14,0.40,0.71)WSWWMMMSMMMWMSWMM Trainingandskill(0.15,0.39,0.69)MWMSSWWWSWSMMSMWWMMSMSS Cashmanagement(0.13,0.40,0.69)SSMMWMMWM Teamworkandcross- functionalteams (0.13,0.40,0.69)SMWWMSSSWMMMMSWMMMWMW Customersatisfaction(0.07,0.33,0.59)WMSMSSMWWMSSMSSSMMWW Businessrevenue(0.11,0.35,0.64)WWSWWSWMMSWSSMWMMMWMSSWWWW RIj (0.28, 1.27, 3.80) (0.17, 0.80, 3.21) (0.23, 1.02, 2.31) (0.74, 2.81, 5.20) (0.51, 2.06, 4.02) (0.47, 2.06, 4.48) (0.17, 0.82, 2.77) (0.22, 1.02, 2.81) (0.16, 0.83, 2.37) (0.33, 1.47, 4.10) (0.64, 2.54, 4.57) (0.35, 1.74, 5.08) (0.39, 1.79, 3.98) (0.67, 2.96, 5.85) (0.63, 2.50, 4.17) (0.49, 2.09, 4.77) (0.28, 1.15, 2.76) (0.56, 2.49, 5.93) (0.44, 1.97, 4.14) (0.17, 0.79, 2.47) (0.31, 1.47, 3.34) (0.32, 1.51, 4.18) (0.42, 2.05, 4.67) (0.20, 0.90, 2.38) (0.50, 2.36, 4.61) (0.77, 3.12, 5.76) (0.80, 3.46, 6.59) (0.47, 2.09, 5.47) (0.27, 1.24, 4.18) (0.37, 1.52, 3.61) (0.47, 2.06, 5.14) (0.20, 0.85, 2.08) Scorej (1.27, 16.94, 58.35) (1.15, 16.47, 57.77) (1.22, 16.69, 56.86) (1.90, 21.49, 72.49) (1.67, 20.74, 71.31) (0.95, 13.94, 48.66) (0.65, 12.70, 46.95) (0.69, 12.90, 46.99) (0.64, 12.71, 46.55) (0.53, 12.12, 42.88) (0.84, 13.18, 43.35) (0.56, 12.38, 43.85) (0.60, 12.43, 42.75) (0.67, 13.98, 47.89) (0.63, 13.51, 46.21) (0.49, 13.11, 46.81) (0.28, 12.16, 44.79) (1.24, 14.97, 48.27) (1.12, 14.45, 46.48) (0.85, 8.59, 26.83) (0.99, 9.27, 27.70) (1.00, 9.31, 28.54) (1.10, 9.85, 29.03) (1.23, 17.77, 63.85) (1.54, 19.23, 66.08) (1.81, 19.99, 67.24) (1.84, 20.33, 68.06) (1.35, 17.85, 60.53) (1.15, 17.00, 59.24) (1.26, 17.29, 58.67) (1.36, 17.83, 60.20) (0.20, 2.92, 11.28) Normalizedvalues (0.02, 0.79, 30.78) (0.02, 0.77, 30.47) (0.02, 0.78, 29.99) (0.03, 1.00, 38.24) (0.02, 0.97, 37.61) (0.01, 0.65, 25.67) (0.01, 0.59, 24.77) (0.01, 0.60, 24.79) (0.01, 0.59, 24.55) (0.01, 0.56, 22.62) (0.01, 0.61, 22.86) (0.01, 0.58, 23.13) (0.01, 0.58, 22.55) (0.01, 0.65, 25.26) (0.01, 0.63, 24.37) (0.01, 0.61, 24.69) (0.00, 0.57, 23.62) (0.02, 0.70, 25.46) (0.02, 0.67, 24.52) (0.01, 0.40, 14.15) (0.01, 0.43, 14.61) (0.01, 0.43, 15.05) (0.02, 0.46, 15.31) (0.02, 0.83, 33.68) (0.02, 0.89, 34.86) (0.02, 0.93, 35.46) (0.03, 0.95, 35.90) (0.02, 0.83, 31.93) (0.02, 0.79, 31.25) (0.02, 0.80, 30.95) (0.02, 0.83, 31.75) (0.00, 0.14, 5.95) Crispvalues23.3722.9622.8629.3428.6119.3718.2518.3718.1516.9117.6417.2917.0519.1318.4718.3817.3519.8619.1311.2111.8112.0412.4625.1626.5227.2627.6424.4023.6023.6324.304.33 SP SP P P P P P P P P P P SP SP P P P P P P P P SP SP SP P P P Notes:S,strong;M,medium;W,weak;SP,strongpositive;P,positive;N,negative;SN,strongnegative Figure 9. The first HOQ 221 Organizational agility
  • 22. In order to identify the most crucial improvement path for achieving agile enablers, opinions from university and industry experts in the fields of production and operation management, IT, and knowledge management were obtained. Each of the improvement paths was then developed and proposed in accordance with the current organizational progress in the pertaining area. The numerical results shown in Figure 11 indicate that “planning for obtaining international business excellence awards” achieved the highest crisp score due to its frequent and high correlations with other improvement paths as well as its strong relations with some of the agile enablers. It is therefore the improvement path with the highest priority, followed by “development and integration of functional applications in main areas of organization” and “provision of enterprise resource planning (ERP) infrastructure.” The ranking of improvement paths based on their crisp scores of the implementation infrastructures is shown in Table XII. The table shows the suggestions by the academic lecturers for improving the organization performance. 5. Discussion and limitations This section discusses the findings from the application of our proposed methodology. Then, we move to the limitations of our work suggesting the future research directions. We start with elucidating the main findings of our study: looking at CSFs (Figure 8), out of 13 CSFs, 6 of them were related to “Learning and Growth” perspective, 5 of them to Rank Agile attributes Decision domain Crisp score 1 Multi-venturing capabilities Competence 29.34 2 Developed business practice difficult to copy Competence 28.61 3 Response to changing market requirements Market 27.64 4 Customer satisfaction Market 27.26 5 Customer-driven innovations Market 26.52 6 New product introduction Market 25.16 7 Learning organization Education 24.40 8 Continuous training and development Education 24.30 9 Workforce skill upgrade Education 23.63 10 Multi-skilled and flexible people Education 23.60 11 Concurrent execution of activities Integration 23.37 12 Enterprise integration Integration 22.96 13 Information accessible to employees Integration 22.86 14 Continuous improvement Change 19.86 15 Empowered individuals working in teams Team building 19.37 16 Quality over product life Quality 19.13 17 Culture of change Change 19.13 18 Products with substantial value-addition Quality 18.47 19 First-time right design Quality 18.38 20 Teams across company borders Team building 18.37 21 Cross-functional teams Team building 18.25 22 Decentralized decision making Team building 18.15 23 Leadership in the use of current technology Technology 17.64 24 Short development cycle times Quality 17.35 25 Skill and knowledge enhancing technologies Technology 17.29 26 Flexible production technology Technology 17.05 27 Technology awareness Technology 16.91 28 Trust-based relationship with customers/suppliers Partnership 12.46 29 Close relationship with suppliers Partnership 12.04 30 Strategic relationship with customers Partnership 11.81 31 Rapid partnership formation Partnership 11.21 32 Employees’ satisfaction Welfare 4.33 Table IX. Ranking of the agile attributes according to crisp scores 222 BIJ 25,1
  • 23. “Financial” perspective, and 2 of them are related to “Customer” perspective. High number of CSFs related to “Learning and Growth” perspective states that human resource management should become the foci of the company. Bringing issues such as employees’ training, knowledge and skills, motivation, and productivity to the center of attention propels the company toward achieving its strategic goals and benefitting from a higher level Agile attributes (AAj) Weight (Wj) Supplychainmanagement Projectmanagement Teambuilding Knowledgemanagement Concurrentengineering Informationtechnology(IT) Flexiblemanufacturingsystems(FMS)or flexibleassemblysystems(FAS) Intranetconnection Extranetconnectionswithnetworked companies Totalqualitymanagement(TQM)systems Enterpriseresourceplanning(ERP) systems Time-valueanalysistechniques Managementinformationsystems(MIS) Concurrent execution of activities (0.02, 0.79, 30.78) W M S S S S M M S Enterprise integration (0.02, 0.77, 30.47) M M M S S S M S W S Information accessible to employees (0.02, 0.78, 29.99) W M W S S S M S Multi-venturing capabilities (0.03, 1.00, 38.24) S S M W M M M M M W W S Developed business practice difficult to copy (0.02, 0.97, 37.61) M W W W M M Empowered individuals working in teams (0.01, 0.65, 25.67) S S Cross-functional teams (0.01, 0.59, 24.77) W M S M M Teams across company borders (0.01, 0.60, 24.79) M W S W W W S W W Decentralized decision making (0.01, 0.59, 24.55) M S M M S S Technology awareness (0.01, 0.56, 22.62) M S W S M Leadership in the use of current technology (0.01, 0.61, 22.86) W S S S S W S M S Skill and knowledge enhancing technologies (0.01, 0.58, 23.13) M W S S M S W S M Flexible production technology (0.01, 0.58, 22.55) M S W S W M M Quality over product life (0.01, 0.65, 25.26) M W M S M S S Products with substantial value-addition (0.01, 0.63, 24.37) S M S W S S S First-time right design (0.01, 0.61, 24.69) S M S M W S S Short development cycle times (0.00, 0.57, 23.62) M M S S S S M S S S S Continuous improvement (0.02, 0.70, 25.46) M S S S W M M M S S W Culture of change (0.02, 0.67, 24.52) M M S M M S M W M Rapid partnership formation (0.01, 0.40, 14.15) S S M M M M S S M Strategic relationship with customers (0.01, 0.43, 14.61) S S M S W S Close relationship with suppliers (0.01, 0.43, 15.05) S W S S S S Trust-based relationship with customers/suppliers (0.02, 0.46, 15.31) S M S S M New product introduction (0.02, 0.83, 33.68) S M W M S S W S W M W S Customer-driven innovations (0.02, 0.89, 34.86) S M S M W S W M W S Customer satisfaction (0.02, 0.93, 35.46) S M S M M M M S Response to changing market requirements (0.03, 0.95, 35.90) S M S W M W M W S Learning organization (0.02, 0.83, 31.93) M M S S M W M M Multi-skilled and flexible people (0.02, 0.79, 31.25) S M S W W W W W M Workforce skill upgrade (0.02, 0.80, 30.95) W S M M S M Continuous training and development (0.02, 0.83, 31.75) M S S S M M Employees satisfaction (0.00, 0.14, 5.95) M M M RIk (0.15, 9.68, 426.89) (0.06, 4.22, 219.41) (0.08, 6.05, 300.90) (0.13, 9.85, 482.12) (0.05, 4.65, 222.94) (0.17, 12.22, 549.78) (0.10, 7.15, 338.52) (0.09, 6.57, 318.87) (0.14, 8.95, 436.01) (0.12, 9.67, 452.82) (0.09, 6.42, 327.43) (0.05, 4.61, 270.23) (0.20, 13.02, 569.35) Scorek (0.35, 37.08, 2,292.26) (0.06, 16.12, 1,155.16) (0.09, 22.41, 896.81) (0.18, 37.12, 1,860.64) (0.12, 15.87, 1,026.94) (0.42, 44.95, 2,849.84) (0.15, 14.64, 858.48) (0.24, 30.36, 2,058.83) (0.31, 32.60, 2,045.93) (0.12, 22.97, 1,567.61) (0.18, 29.56, 2,011.99) (0.09, 16.82, 1,289.02) (0.32, 38.02, 2,435.13) Normalized values (0.00, 0.82, 5,500.30) (0.00, 0.36, 2,771.81) (0.00, 0.50, 2,151.90) (0.00, 0.83, 4,464.62) (0.00, 0.35, 2,464.16) (0.00, 1.00, 6,838.23) (0.00, 0.33, 2,059.94) (0.00, 0.68, 4940.18) (0.00, 0.73, 4,909.23) (0.00, 0.51, 3,761.49) (0.00, 0.66, 4,827.78) (0.00, 0.37, 3,093.02) (0.00, 0.85, 5,843.11) Crisp values 591.69 296.87 235.43 483.77 264.70 735.04 221.98 529.95 527.86 403.42 517.82 330.69 627.87 SP P P P P P P P P P SP SP P P P P P P P P PP SP SP SP SP SP SP SP SP SP SP SP SP P PP Notes: S, strong; M, medium; W, weak; SP, strong positive; P, positive; N, negative; SN, strong negative Figure 10. The second HOQ 223 Organizational agility
  • 24. of agility. On the other hand, none of the identified CSFs belongs to “Internal Processes.” Also, the first 3 indicators of “Internal Processes” among the 50 KPIs are ranked 22nd, 30th, and 38th, considerably far from the CSFs (top 25 percent of KPIs). This implies that the organization is performing well with respect to its internal processes. The main internal processes of the organization concern production of milk nutrition products as mentioned earlier. Given the high expertise and high level of technology used for the production, scoring high for internal processes was not far from expectations. The ranking of agile enablers (Table IX) reveals that the first top two enablers, namely, “Multi-venturing capabilities” and “Developed business practice difficult to copy” belong to the decision domain of “Competence.” The next four agile enablers pertain to “Market” domain, namely, “Response to changing market requirements,” “Customer satisfaction,” “Customer-driven innovations,” and “New product introduction.” Prioritizing “Competence” and “Market” overall the other decision domains by the experts indicates that the food market in Iran is highly competitive and requires high levels of innovation and responsiveness. Basically, the main mechanism for survival in such markets is building unique competencies which are unique, innovative, and difficult to imitate by rivals. This is coherent with the resource-based view (RBV) theory stating that firms need to build and rely on resources Supply chain management Concurrent engineering Project management Information technology Team building Knowledge management Supply chain management Van Hoek (2000) Vonderembse et al. (2006) and Chung and Snyder (2000) Christopher (2000) and Gowen and Tallon (2003) Yusuf et al. (1999), Gowen and Tallon (2003) Concurrent engineering Ainscough et al. (2003) Van Hoek (2000) and Gunasekaran (1999) Jacob (2006) Project management Information technology Gunasekaran (1999) Team building Knowledge management Source: Bottani (2009a) Table X. Correlations among decision domains extracted from the literature Rank Agile enablers Crisp score 1 Information technology (IT) 735 2 Management information systems (MIS) 628 3 Supply chain management 592 4 Intranet connection 530 5 Extranet connections with networked companies 528 6 Enterprise resource planning (ERP)systems 518 7 Knowledge management 484 8 Total quality management (TQM) systems 403 9 Time-value analysis techniques 331 10 Project management 297 11 Concurrent engineering 265 12 Team building 235 13 Flexible manufacturing systems (FMS) or flexible assembly systems (FAS) 222 Table XI. Ranking of agile enablers according to their crisp scores 224 BIJ 25,1
  • 25. AgileEnablers (AEk) Weight (Wk) Development and integration of functional applications in main areas of organization Provision of ERP infrastructure Use of EDI in B2B interactions Development of web-based activities as portal configuration Designing and implementing decision support systems (DSS) Planning for long-term interactions with suppliers Planning for obtain international business excellence awards Forming and developing quality circles Six sigma implementation Preparation of corporate knowledge strategy in knowledge management area Training needs assessment and long-term educational planning with multi-skilled employees approach Technology Management Product development unit start up Strategic Planning Supplychainmanagement(0.00,0.82,5,500.30)MSSSSSMMWMM Projectmanagement(0.00,0.36,2,771.81)WMM Teambuilding(0.00,0.50,2,151.90)MSSMM Knowledgemanagement(0.00,0.83,4,464.62)WMMSMSW Concurrentengineering(0.00,0.35,2,464.16)MWWS Informationtechnology(IT)(0.00,1.00,6,838.23)SSSSSMW Flexiblemanufacturingsystems(FMS)orflexibleassemblysystems(FAS)(0.00,0.33,2,059.94)SWWMSSM Intranetconnection(0.00,0.68,4,940.18)SMWS Extranetconnectionswithnetworkedcompanies(0.00,0.73,4,909.23)WWSM Totalqualitymanagement(TQM)systems(0.00,0.51,3,761.49)SSSSSMS Enterpriseresourceplanning(ERP)systems(0.00,0.66,4,827.78)SSWMMM Time-valueanalysistechniques(0.00,0.37,3,093.02)WWSW Managementinformationsystems(MIS)(0.00,0.85,5,843.11)SSSMSWWW RId (0.00,3.59, 29,943.21) (0.00,4.40, 33,125.49) (0.00,3.40, 26,021.25) (0.00,2.58, 19,808.15) (0.00,3.11, 23,305.01) (0.00,1.88, 14,423.16) (0.00,2.91, 22,700.34) (0.00,1.42, 11,323.76) (0.00,2.14, 16,238.84) (0.00,1.15, 9,597.00) (0.00,1.50, 12,845.12) (0.00,0.33, 3,710.03) (0.00,1.27, 10,453.74) (0.00,1.42, 17,576.89) Scored (0.00,8.37, 82,455.18) (0.00,7.48, 70,536.74) (0.00,6.70, 64,954.77) (0.00,5.71, 56,584.77) (0.00,6.81, 67,545.90) (0.00,5.64, 62,680.72) (0.00,7.73, 86,201.20) (0.00,3.63, 36,205.58) (0.00,4.04, 38,551.64) (0.00,5.61, 66,127.24) (0.00,3.72, 40,241.34) (0.00,1.62, 23,848.64) (0.00,2.14, 21,803.91) (0.00,3.53, 44,711.55) Crispvalues20,61817,63816,24214,14916,890156,7321,5549,0539,64016,53510,0625,9635,45211,180 SP SP SP SP SP SP SP SP SP P PP P P P P P P P P P PP Notes:S,strong;M,medium;W,weak;SP,strongpositive;P,positive;N,negative;SN,strongnegative Figure 11. The third HOQ 225 Organizational agility
  • 26. which are inimitable, rare, valuable, and non-substitutable in order to achieve a sustained competitive advantage in competitive markets (Barney, 1991). All the top 6 agile enablers follow the same characteristic as the ones pointed out by the RBV theory. A practical implication comes from comparing the identified KPIs under different perspectives of BSC. It can be observed that “Customer” perspective has the least number of KPIs identified by the experts (Figure 7). Also, few “Customer”-related KPIs are present in the first quartile of ranking, known as CSFs (Figure 8). While the ultimate goal of organizational agility is to retain customers and responding to their changing needs, it is interesting that less attention is given to “Customer” perspective. We infer that the reason for this is twofold. First, the studied case was located in a developing country where attention to customer as a driver of organizational success is weaker compared to developed countries. It is in line with the findings of previous studies in developing countries. Upadhaya et al. (2014) used BSC to assess organizational effectiveness and its association with performance measurement systems in Nepal. They concluded that customer performance measures in BSC are considered less significant compared to other measures such as financial. The study of Khan et al. (2011) on 60 cross-section Bangladeshi companies also confirmed that use of financial measures on BSC overweighs non-financial ones such as customer measures. Interestingly, they found out that food industry had the lowest use of non-financial measures among other sectors (only 42 percent). Second, we argue that it is not only the “Customer” perspective in BSC that can lead to being agile in fulfilling customers’ demands. Organizational agility as a multifaceted concept is influenced, even though implicitly, by the other three aspects of BSC as well. For example, improving the CSF “Communication Channel” belonging to the “Learning and Growth” perspective, will undoubtedly contribute to the betterment of customer experience. Moreover, we discuss the relatability of CSFs, agile attributes, agile enablers, and improvement paths. As an example, we scrutinize the metrics related to the “Customer” perspective. The first CSF belonging to this perspective is “market share.” Four agile attributes are identified for market share, namely, “New product introduction,” “Customer-driven innovations,” “Customer satisfaction,” and “Response to changing market requirements” fall under the decision domain “Market” (see Table I). These are the agile attributes that can eventually result in the increase of market share. Here, one might question that some of the pertaining agile enablers resulting from these agile attributes might seem irrelevant, e.g. flexible manufacturing system and flexible assembly systems. It can be argued that these enablers can increase the customer-driven innovations, satisfy Rank Improvement projects Crisp score 1 Planning for obtain International business excellence awards 21,554 2 Development and integration of functional applications in main areas of organization 20,618 3 Provision of ERP infrastructure 17,638 4 Designing and implementing decision support systems (DSS) 16,890 5 Preparation of corporate knowledge strategy in knowledge management district 16,535 6 Use of EDI in B2B interactions 16,242 7 Planning for long-term interactions with suppliers 15,673 8 Development of web-based activities as portal configuration 14,149 9 Strategic planning 11,180 10 Training needs assessment and long-term educational planning with multi-skilled employees approach 10,062 11 6 sigma implementation 9,640 12 Forming and developing quality circles 9,053 13 Technology management 5,963 14 Product development unit start up 5,452 Table XII. Ranking of improvement paths according to their crisp scores 226 BIJ 25,1
  • 27. their needs, increase their loyalty, and consequently increase and develop the market share (see Figure 10). Therefore, these factors impact the market share of the company. In fact, one of the strengths of the proposed methodology is that through three consecutive and intertwined HOQs identifies fundamental mechanisms that, even ostensibly unrelated, lead to the enhancement of organizational agility. It would otherwise be impossible to find such mechanisms by conventional methodologies. We also posit that the use of ranking in our methodology should not cause negligence to lower-ranked metrics. For example, the fact that “New Technologies” obtained the last place among the 50 performance measurement indicators (see Table VI) and is the least important indicator shows that the organization is currently using the latest up-to-date technologies in its production system. However, maintaining high level of technology is crucial for the company to survive in the highly competitive food market. This can also be understood from the concerning agile attributes such as “Technology Awareness” which pinpoints the importance of commitment to modern technologies. Therefore, existence of no or little gap to fill does not imply that the company should stop its current efforts of staying tuned with new technologies. Our findings also have some implications regarding the use of internet and information systems. Analysis of Table XI (ranking of agile enablers) shows that IT, MIS, intranet, extranet, ERP, and knowledge management have been, respectively, ranked as number 1-6 of the most important agile enablers in the organizations. Since all of these factors are categorized under the virtual enterprise tools, the organization needs to be more virtually empowered to become more agile. It is essential to equip the organization with better internet and intranet infrastructure, management information software, and data banks. Besides, harmonizing the employees and operational processes with the new improved virtual environment is crucial for the organization. Our findings are coherent with previous studies which showed that the use of virtual enterprise systems enhances organizational agility in developed countries (e.g. New Zealand (Mathrani, 2014), but at odds with the domestic studies of organizational agility in Iran where IT has not shown to have any direct relationship, but it even showed a negative relationship with organizational agility. This can be explained due to the fact that Iran as a developing country suffers from unstable or slow internet connection and limited access to some internet content. Therefore, the studied companies in the literature, which were equipped with IT systems, failed to benefit from their IT advantage for improving their agility. In addition, local Iranian companies studied in the literature were collaborating with partners (e.g. suppliers) that were not IT equipped. Significant differences in IT utilization level isolate the organization with higher IT infrastructure and causes major difficulties in building IT-based communications with partners and moving toward the notion of virtual enterprise. Building upon the empirical observations about the category to which top ranked KPIs belong to, few number of customer-related KPIs, and internet and information systems findings, we put forward some implications for organizations using the methodology. Basically, it is possible for a company to choose a set of agility metrics that are deemed to make the organization more agile based on the idea of managers or experts. However, these metrics, although believed to be appropriate by decision makers, might not be fully in line with organizations’ core values and marketing objective or they might address areas in which there is little gap between the current and desired level of agility. It is because agility metrics, as shown by quantitative calculations in HOQs, are highly interrelated. One cannot directly choose the right metrics based on his/her insight or experience devoid of the risk of wrong or inconsistent judgments. It has been shown that when making multiple-criteria decisions, the level of inconsistency in human’s judgments exponentially increases as the number of criteria and their interdependence increases (Saaty and Shang, 2011). The correlations calculated in each HOQ are beyond the capability of human mind to be considered simultaneously. This is a strong advantage of using a systematic and structured methodology that facilitates the decision-making process by considering various aspects and correlations. 227 Organizational agility
  • 28. A major concern when deriving agile attributes and agile enablers from the literature is that they are industry-specific. They are especially tailored for the manufacturing context which leaves other industries with little or no relevant metrics. This is advocated by the study of Bottani (2009b) where she states that literature-driven metrics used for the food industry result in very low or low results while the company is in fact sufficiently agile. We have tried to tackle this shortcoming by using multiple sources to identify metrics besides the literature. These sources included experts’ ideas both from academia and the industry and also using the studied organization information for defining pertinent metrics. However, defining agility metrics such as KPIs, attributes, enablers, and improvement paths remains to be a limitation to any methodological agility study including ours. Hence, more industry-specific research is needed to explore different companies in a specific market segment and finding mutual agility metrics to be used for that segment. Applications on real-world cases from different industries can contribute to generating valuable knowledge in this area. Also, future literature reviews in the agility arena can compile the previously identified metrics from the literature. Another limitation concerning our application is that we have confined our analysis to the first quartile of performance measurement indicators with higher priority. The reason was that choosing a higher number of indicators increases the amount of calculations significantly and makes the HOQs unusually large. A suggestion to address this limitation is developing QFD computer software capable of handling the calculation and visualization of larger HOQs. Moreover, the accuracy of HOQs can be enhanced through using innovative methods such as analytic hierarchy process (AHP) which measures the consistency of responses for each respondent at the time of building the relationship and correlation matrix. This has not been implemented in the QFD domain hitherto and would be an interesting future research direction. Finally, this study does not explicitly measure the initial need for agility due to the nature of our studied case. The Nutricia MMP Company in collaboration with DANONE Group is the second largest producer of powdered milk in the world and has a close competition with its rival brand, Nestle. Once a company like our studied case could strive to achieve the highest market share in a competitive industry, it can be surmised that it achieved the highest level of agility, regardless of how much its initial need to agility was. However, for future studies, especially when the company is not a market pioneer or when the market is less competitive, it is recommended that first the need to agility to the organization is measured so that it can be used as a basis for determining the improvement paths. Various methods have been proposed for measuring the agility need level (e.g. Zhang and Sharifi (2000), inter alia). 6. Conclusions This study aims at improving organizational agility by integrating some operations management techniques from the domains of decision making, quality engineering, and organizational performance assessment. It proposes a new approach at strategic management level for achieving macro organizational goals in competitive industries. To this end, upon evaluating organizational performance using BSC technique, the importance level and existing gap in each of the performance indicators, extracted from macro and strategic long-term goals of the organization, were identified. Then, using fuzzy TOPSIS from MCDM domain, all indicators were ranked to identify the indicators with highest priorities, called as the organizational CSFs. Later, using QFD technique in fuzzy environments, the following three objectives were simultaneously pursued: (1) reducing/removing the existing gap among CSFs using improvement paths obtained from HOQs; (2) propelling organizations towards achieving their strategic goals; and 228 BIJ 25,1
  • 29. (3) enhancing organizational agility and increasing the capability to feel, perceive, and predict changes in the business environment as well as empowering organizations to show timely reaction to volatility through improving their competitive advantage. The application of our methodology in the highly competitive food industry revealed that it is capable of achieving the aforementioned objectives. The proposed methodology can be used for future agility studies. We recommend recollecting the metrics, i.e. CSFs, agile attributes, agile enablers, and improvement paths to fit the needs of the case and its market and also to develop and expand our knowledge beyond the currently existing metrics. Likewise, the proposed model can be adopted in other environments with high levels of volatility and agility need such as humanitarian context. Humanitarian operations need to be agile not only in the provision of aid, but also in adjusting the intra- organizational pace with the environmental changes (e.g. responding to a disaster). However, humanitarian literature has been more focused on operational agility and organizational agility is rarely addressed (L’Hermitte et al., 2016). Application of the proposed model can be an interesting future research avenue that fills the void of organizational agility in humanitarian organizations. References Ainscough, M., Neailey, K. and Tennant, C. (2003), “A self-assessment tool for implementing concurrent engineering through change management”, International Journal of Project Management, Vol. 21 No. 6, pp. 425-431. Agarwal, A., Shankar, R. and Tiwari, M.K. (2007), “Modeling agility of supply chain”, Industrial Marketing Management, Vol. 36 No. 4, pp. 443-457. Barney, J. (1991), “Firm resources and sustained competitive advantage”, Journal of Management, Vol. 17 No. 1, pp. 99-120. Bevilacqua, M., Ciarapica, F.E. and Giacchetta, G. (2006), “A fuzzy-QFD approach to supplier selection”, Journal of Purchasing & Supply Management, Vol. 12, pp. 14-27. Bottani, E. (2009a), “A fuzzy QFD approach to achieve agility”, International Journal of Production Economics, Vol. 119 No. 2, pp. 380-391. Bottani, E. (2009b), “On the assessment of enterprise agility: issues from two case studies”, International Journal of Logistics: Research and Application, Vol. 12 No. 3, pp. 213-230. Bottani, E. (2010), “Profile and enablers of agile companies: an empirical investigation”, International Journal of Production Economics, Vol. 125 No. 2, pp. 251-261. Bottani, E. and Rizzi, A. (2006), “Strategic management of logistics service: a fuzzy QFD approach”, International Journal of Production Economics, Vol. 103 No. 2, pp. 585-599. Brown, S. and Bessant, J. (2003), “The manufacturing strategy-capabilities links in mass customization and agile manufacturing-an exploratory study”, International Journal of Operations and Production Management, Vol. 23 No. 7, pp. 707-730. Burgess, T.F. (1994), “Making the leap to agility: defining and achieving agile manufacturing through business process redesign and business network redesign”, International Journal of Operations and Production Management, Vol. 23 No. 7, pp. 707-730. Burgess, T.F., Gules, H.K., Gupla, J. and Tekin, M. (1998), “Competitive priorities, process innovations and time-based competition in the manufacturing sectors of industrializing economics: the case study of Turkey”, Benchmarking for Quality Management & Technology, Vol. 5 No. 4, pp. 304-306. Cebeci, U. (2009), “Fuzzy AHP-based decision support system for selecting ERP systems in textile industry by using balanced scorecard”, Expert Systems with Applications, Vol. 36, pp. 8900-8909. 229 Organizational agility
  • 30. Chen, L.-H. and Ko, W.-C. (2009), “Fuzzy approaches to quality function deployment for new product design”, Fuzzy Sets and Systems, Vol. 160 No. 18, pp. 2620-2639. Cheng, C.H., Yang, K.L. and Hwang, C.L. (1999), “Evaluating attack helicopters by AHP based on linguistic variable weight”, European Journal of Operational Research, Vol. 116 No. 2, pp. 423-435. Cho, H., Jung, M.-Y. and Kim, M. (1996), “Enabling technologies of agile manufacturing and its related activities in Korea”, Computers & Industrial Engineering, Vol. 30 No. 3, pp. 323-334. Christopher, M. (2000), “The agile supply chain: competing in volatile markets”, Industrial Marketing Management, Vol. 29 No. 1, pp. 37-44. Christopher, M. and Towill, D. (2001), “An integrated model for the design of agile supply chains”, International Journal of Physical Distribution & Logistics Management, Vol. 31 No. 4, pp. 234-246. Chung, S.H. and Snyder, C.A. (2000), “ERP adoption: a technological evolution approach”, International Journal of Agile Management Systems, Vol. 2 No. 1, pp. 24-32. Corbett, L.M. and Rastrick, K.N. (2000), “Quality performance and organizational culture: a New Zealand study”, International Journal of Quality & Reliability Management, Vol. 17 No. 1, pp. 14-26. Dove, R.K. (1996), “Tools for analysing and constructing agile capabilities”, US Agility Forum, Bethlehem, PA. Dowlatshahi, S. and Cao, Q. (2005), “The impact of alignment between virtual enterprise and information technology on business performance in an agile manufacturing environment”, Journal of Operations Management, Vol. 23 No. 5, pp. 531-550. Dowlatshahi, S. and Cao, Q. (2006), “The relationships among virtual enterprise, information technology, and business performance in agile manufacturing: an industry perspective”, European Journal of Operational Research, Vol. 174 No. 2, pp. 835-860. Droge, C., Jayaram, J. and Vickery, S.K. (2004), “The effects of internal versus external integration practices on time-based performance and overall firm performance”, Journal of Operations Management, Vol. 22 No. 6, pp. 557-573. Dursun, M. and Karsak, E.E. (2013), “A QFD-based fuzzy MCDM approach for supplier selection”, Applied Mathematical Modelling, Vol. 37, pp. 5864-5875. Earle, J.S., Pagano, U. and Lesi, M. (2006), “Information technology, organizational form, and transition to the market”, Journal of Economic Behavior & Organization, Vol. 60 No. 4, pp. 471-489. Fayezi, S., Zutshi, A. and O’Loughlin, A. (2015), “How Australian manufacturing firms perceive and understand the concepts of agility and flexibility in the supply chain”, International Journal of Operations & Production Management, Vol. 35 No. 2, pp. 246-281. Gehani, R.R. (1995), “Time-based management of technology: a taxonomic integration of tactical and strategic roles”, International Journal of Operations and Production Management, Vol. 15 No. 2, pp. 19-35. Gligor, D.M., Esmark, C.L. and Holcomb, M.C. (2015), “Performance outcomes of supply chain agility: when should you be agile?”, Journal of Operations Management, Vols 33-34, January, pp. 71-82. Goldman, S.L. and Nagel, R.N. (1993), “Management, technology and agility: the emergence of a new era in manufacturing”, International Journal of Technology Management, Vol. 8 Nos 1-2, pp. 18-38. Goldman, S.L., Nagel, R.N. and Preiss, K. (1995), Agile Competitors and Virtual Organizations: Strategies for Enriching the Customer, Van Nostrand Reinhold, New York, NY. Gowen, C.R. and Tallon, W.J. (2003), “Enhancing supply chain practices through human resource management”, Journal of Management Development, Vol. 22 No. 1, pp. 32-44. Gunasekaran, A. (1998), “Agile manufacturing: enablers and an implementation framework”, International Journal of Production Research, Vol. 36 No. 5, pp. 1223-1247. 230 BIJ 25,1
  • 31. Gunasekaran, A. (1999), “Agile manufacturing: a framework for research and development”, International Journal of Production Economics, Vol. 62 Nos 1-2, pp. 87-105. Gunasekaran, A. and Yusuf, Y.Y. (2002), “Agile manufacturing: a taxonomy of strategic and technological imperatives”, International Journal of Production Research, Vol. 40 No. 6, pp. 1357-1385. Higgins, K.L. and Maciariello, J.A. (2004), “Leading complex collaboration in network organizations: a multidisciplinary approach”, Complex Collaboration: Building the Capabilities for Working Across Boundaries, Vol. 10, Emerald Group Publishing Limited, pp. 203-241. Jackson, M. and Johansson, C. (2003), “An agility analysis from a production system perspective”, Integrated Manufacturing Systems, Vol. 14 No. 6, pp. 482-488. Jacob, F. (2006), “Preparing industrial suppliers for customer integration”, Industrial Marketing Management, Vol. 35 No. 1, pp. 45-56. Jung, J.Y. and Wang, Y.J. (2006), “Relationship between total quality management (TQM) and continuous improvement of international project management (CIIPM)”, Technovation, Vol. 26 No. 5, pp. 716-722. Kathuria, R. and Davis, E.B. (1999), “Quality and work force management: from manufacturing managers’ perspective”, Journal of Quality Management, Vol. 4 No. 2, pp. 147-166. Khan, M.H.-U.-Z., Halabi, A.K. and Sartorius, K. (2011), “The use of multiple performance measures and the balanced scorecard (BSC) in Bangladeshi firms: an empirical investigation”, Journal of Accounting in Emerging Economies, Vol. 1 No. 2, pp. 160-190. Kidd, P.T. (1994), Agile Manufacturing-Forging New Frontiers, Addison-Wesley, Wokingham. Kisperska-Moron, D. and Swierczek, A. (2009), “The agile capabilities of Polish companies in the supply chain: an empirical study”, International Journal of Production Economics, Vol. 118 No. 1, pp. 217-224. Koskinen, J. (2014), “Modular product design for dynamic capabilities of manufacturing organisations: a case study”, International Journal of Business Innovation and Research, Vol. 8 No. 6, pp. 671-683. Kuleelung, T. and Ussahawanitchakit, P. (2015), “Organizational agility and firm performance: evidence from information and communication technology (ICT) businesses in Thailand”, The Business & Management Review, Vol. 7 No. 1, pp. 206-217. Kumar, A. and Motwani, J. (1995), “A methodology for assessing time-based competitive advantage of manufacturing firms”, International Journal of Operations and Production Management, Vol. 15 No. 2, pp. 36-53. Kuo, Y.-F. and Chen, P.-C. (2008), “Constructing performance appraisal indicators for mobility of the service industries using Fuzzy Delphi Method”, Expert Systems with Applications, Vol. 35 No. 4, pp. 1930-1939. Lakemond, N. and Berggren, C. (2006), “Co-locating NPD? The need for combining project focus and organizational integration”, Technovation, Vol. 26 No. 7, pp. 807-819. Lee, A.H.I., Chen, W.-C. and Chang, C.-J. (2008), “A fuzzy AHP and BSC approach for evaluating performance of IT department in the manufacturing industry in Taiwan”, Expert Systems with Applications, Vol. 34 No. 1, pp. 96-107. L’Hermitte, C., Tatham, P., Brooks, B. and Bowles, M. (2016), “Supply chain agility in humanitarian protracted operations”, Journal of Humanitarian Logistics and Supply Chain Management, Vol. 6 No. 2, pp. 173-201. Lima-Junior, F.R. and Carpinetti, L.C.R. (2016), “A multicriteria approach based on fuzzy QFD for choosing criteria for supplier selection”, Computers & Industrial Engineering, Vol. 101, Supplement C, pp. 269-285. Lin, C.-T., Chiu, H. and Chu, P.-Y. (2006), “Agility index in the supply chain”, International Journal of Production Economics, Vol. 100 No. 2, pp. 285-299. 231 Organizational agility
  • 32. Liu, H.-T. (2009), “The extension of fuzzy QFD: from product planning to part deployment”, Expert Systems with Applications, Vol. 36 No. 8, pp. 11131-11144. Mathrani, S. (2014), “Using enterprise systems to enhance organizational agility”, Journal of Applied Computing and Information Technology, Vol. 18 No. 1. Messer, B., Patrick, C. and Seitz, S. (2006), “Achieving cost savings with innovative welding and examination techniques”, International Journal of Pressure Vessels and Piping, Vol. 83 No. 5, pp. 365-372. Mohanty, R.P. and Deshmukh, S.G. (2001), “Agility: searching for definitions and boundaries”, International Journal of Agile Manufacturing, Vol. 4 No. 2, pp. 43-68. Morgan, R.E. (2004), “Business agility and internal marketing”, European Business Review, Vol. 16 No. 5, pp. 464-472. Nafei, W.A. (2016a), “Organizational agility: the key to improve organizational performance”, International Business Research, Vol. 9 No. 3, pp. 97-111. Nafei, W.A. (2016b), “The role of organizational agility in enhancing organizational excellence: a study on telecommunications sector in Egypt”, International Journal of Business and Management, Vol. 11 No. 4, pp. 121-135. Nejatian, M. and Zarei, M.H. (2013), “Moving towards organizational agility: are we improving in the right direction?”, Global Journal of Flexible Systems Management, Vol. 14 No. 4, pp. 241-253. Prahalad, C. and Hamel, G. (1990), “The core competence of the corporation”, Harvard Business Review, Vol. 68, pp. 79-91. Prince, J. and Kay, J.M. (2003), “Combining lean and agile characteristics: creation of virtual groups by enhanced production flow analysis”, International Journal of Production Economics, Vol. 85 No. 3, pp. 305-318. Rasouli, O. and Zarei, M.H. (2016), “Monitoring and reducing patient dissatisfaction: a case study of an Iranian public hospital”, Total Quality Management & Business Excellence, Vol. 27 Nos 5-6, pp. 531-559. Ren, J., Yusuf, Y.Y. and Burns, D. (2001), “Organizational competitiveness: identifying the critical agile attributes using principal component analysis”, Proceedings of the 16th International Conference on Production Research, Prague, July. Ren, J., Yusuf, Y.Y. and Burns, N.D. (2003), “The effects of agile attributes on competitive priorities: a neural network approach”, Integrated Manufacturing Systems, Vol. 14 No. 6, pp. 489-497. Ren, J., Yusuf, Y.Y. and Burns, D. (2009), “A decision-support framework for agile enterprise partnering”, International Journal of Advanced Manufacturing Technology, Vol. 41 Nos 1-2, pp. 180-192. Saaty, T.L. and Shang, J.S. (2011), “An innovative orders-of-magnitude approach to AHP-based multi- criteria decision making: prioritizing divergent intangible humane acts”, European Journal of Operational Research, Vol. 214 No. 3, pp. 703-715. Sharifi, H. and Zhang, Z. (2001), “Agile manufacturing in practice: application of a methodology”, International Journal of Operations and Production Management, Vol. 21 Nos 5/6, pp. 772-794. Sharifi, H., Colquhoun, G., Barclay, I. and Dann, Z. (2001), “Agile manufacturing: a management and operational framework”, Proceedings of the Institution of Mechanical Engineers, Part B: Journal of Engineering Manufacture, Vol. 215 No. 6, pp. 857-869. Sherehiy, B., Karwowski, W. and Layer, J.K. (2007), “A review of enterprise agility: concepts, frameworks, and attributes”, International Journal of Industrial Ergonomics, Vol. 37 No. 5, pp. 445-460. Small, A.W. and Downey, A.E. (1996), “Orchestrating multiple changes: a framework for managing concurrent changes of varied type and scope”, Proceedings of IEMC Conference on Managing Virtual Enterprises, pp. 627-634. 232 BIJ 25,1