SlideShare a Scribd company logo
1 of 33
The Computational Microscope Images
              Biomolecular Machines and Nanodevices
        shadow is                        Accuracy • Speed-up • Unprecedented Scale
     crystal structure


                protein folding:
                villin headpiece
          3 months on 329 CPUs
                                              Klaus Schulten
                                         Department of Physics and
                             Theoretical and Computational Biophysics Group
                                University of Illinois at Urbana-Champaign
                            Lecture at CPLC Summer School, Urbana, July, 2012
Wednesday, August 1, 2012
Our Microscope is Made of...

Chemistry                                         NAMD Software               100


                                                                     ns/day
                                                                               10


                                                          Virus                 1


                                                                                      128
                                                                                      256
                                                                                      512
                                                                                     1024
                                                                                     2048
                                                                                     4096
                                                                                     8192
                                                                                    16384
                                                                                    32768
                                                      51,000 registered users cores
Physics


Math
                                                      ..and Supercomputers
       (repeat one billion times = microsecond)


Wednesday, August 1, 2012
3
      Outside researchers choose NAMD and succeed
 Corringer, et al., Nature, 2011              2100 external citations since 2007                                   Voth, et al., PNAS, 2010

                             180K-atom 30 ns study of anesthetic binding to bacterial
                             ligand-gated ion channel provided “complementary
                             interpretations…that could not have been deduced from
                             the static structure alone.”

                            Bound Propofol Anesthetic
                                                                     500K-atom 500 ns investigation of effect of
                                                                     actin depolymerization factor/cofilin on
                                                                     mechanical properties and conformational
                                                                     dynamics of actin filament.


                                                                                                                    Bare actin    Cofilactin
     Recent NAMD Simulations in Nature
 • M. Koeksal, et al., Taxadiene synthase structure and evolution of modular architecture in terpene biosynthesis. (2011)
 • C.-C. Su, et al., Crystal structure of the CusBA heavy-metal efflux complex of Escherichia coli. (2011)
 • D. Slade, et al., The structure and catalytic mechanism of a poly(ADP-ribose) glycohydrolase. (2011)
 • F. Rose, et al., Mechanism of copper(II)-induced misfolding of Parkinson’s disease protein. (2011)
 • L. G. Cuello, et al., Structural basis for the coupling between activation and inactivation gates in K(+) channels. (2010)
 • S. Dang, et al.,, Structure of a fucose transporter in an outward-open conformation. (2010)
 • F. Long, et al., Crystal structures of the CusA efflux pump suggest methionine-mediated metal transport. (2010)
 • R. H. P. Law, et al., The structural basis for membrane binding and pore formation by lymphocyte perforin. (2010)
 • P. Dalhaimer and T. D. Pollard, Molecular Dynamics Simulations of Arp2/3 Complex Activation. (2010)
 • J. A. Tainer, et al., Recognition of the Ring-Opened State of Proliferating Cell Nuclear Antigen by Replication Factor C Promotes
   Eukaryotic Clamp-Loading. (2010)
 • D. Krepkiy, et al.,, Structure and hydration of membranes embedded with voltage-sensing domains. (2009)
 • N. Yeung, et al.,, Rational design of a structural and functional nitric oxide reductase. (2009)
 • Z. Xia, et al., Recognition Mechanism of siRNA by Viral p19 Suppressor ofBioinformatics
                                               BTRC for Macromolecular Modeling and RNA Silencing: A Molecular Dynamics Study. (2009) UIUC
                                                                                                                         Beckman Institute,
                                                           http://www.ks.uiuc.edu/

Wednesday, August 1, 2012
Successful folding of largest fast-folding protein:
             λ-repressor / Collaboration Gruebele-Schulten
                                 System:
                                 • 5-helix bundle protein
                                 • Largest fast-folding protein
                                 • Experimental folding time < 20 µs
                                 Recent progress:
                                 • Successful folding in < 5 µs using enhanced sampling
                                 • 100-µs folding trajectory using both NAMD and Anton

                                                                                                  0                15
                                                                                                      RMSD (Å)


 Liu et al, J. Chem. Phys. Lett. (2012)
                                           Alpha helix        Pi-helix       3-10 helix
                                                         Turn        None (coil)
                                            BTRC for Macromolecular Modeling and Bioinformatics         Beckman Institute, UIUC
            Lamda repressor folding, 24.1 µs. Per-residue secondary structure and RMSD.
                                                          http://www.ks.uiuc.edu/

Wednesday, August 1, 2012
Computational Microscope at Work:
 Inspecting the Mechanical Strength of a Blood Clot


                                                                                               A Blood Clot
          20ns SMD Simulation of fibrinogen, 1.06 million atoms, 1.2 ns/day
                                                                                        Red blood cells within a
          with pencil decomposition, 15 days on PSC XT3 Cray (1024
                                                                                        network of fibrin fibers,
          processors)                                                                   composed of polyme-
        B. Lim, E. Lee, M. Sotomayor, and K. Schulten. Molecular basis of fibrin clot   rized fibrinogen mole-
        elasticity. Structure, 16:449-459, 2008.                                        cules.
            12

Wednesday, August 1, 2012
(d)
                                               Design of Tyrosine Kinase Sensor
                                                •Peptides are attached to a gold surface. The end of oligopeptide contains rhodamine.
                                                •Peptides are exposed to ATP and appropriate kinase.
                                                •Electric field is applied; change in conformation depends on phosphorylation state.
                                                •Distance from rhodamine determines magnitude of fluorescence signal.

                                            initial sequence: {1 GLU} {2 GLY} {3 ILE} {4 TYR} {5 GLY} {6 VAL} {7 LEU} {8 PHE} {9 LYS} {10 LYS} {11 LYS} {12 CYS}
        Rhodamine
          (R6g)            Tyrosine residue interacts with kinases                                                         Experiment: Logan Liu and
al image of          sensor: A
                       (a)           by phosphorylation
                                         (b)                 (c)
                                              Fluorescence image
                                                                                                                          (d) Chen, Nano Lab, U. Illinois
                                                                                                                           Yi
yer of 5 nm titanium                          showing peptide probes
                                              were successfully

o activate the sensor (b) immobilized on the
           (a)                                nanochip surface
                                                                                          (e)
 than smooth surface.                                                                     300 nm


ensor. Peptide probes
         kinase

  sensor. Peptides are pattern are created by a by experiments and simulations. A thin layerimage nmsensor: A
                Figure 2: Proposed kinase sensor studied
                5×5 square array                              SEPERISE method (see text).
                                                                                          (a) Optical
                                                                                                       of 5
                                                                                                             of
                                                                                                                 titanium
 representation. Blue of 80 nm gold is depositedwithin theofsurface, so they structures tothan smooth surface.
                followed by a layer
                surface. The nanostructures trap incident light
                                                                   on top       (a)
                                                                          the nanocone
                                                                                        look darker
                                                                                                            (b)
                                                                                                      activate the sensor
                                                                                                             Fluorescence image
                                                                                                             showing peptide probes
                                                                                                                                       (c)                             (d)


ectively. oligopeptide with 12Nanoscopic structures of the activated areas of the kinase sensor. Peptide probes
Au surface, (b) MISSING FIGURE. (c) AA,
                                                                                                             were successfully
                                                                                                             immobilized on the
                      are immobilized on the gold covered surface of nanocones. (c) Atomic model of kinase sensor. Peptides are
                                                                                                             nanochip surface

          bound via sulfide bond
                      colored in green, metallic surface in yellow. A single peptide is highlighted in licorice representation. Blue
                                                                                                                                                            300 nm


              (c)                                         (d)
                      and red arrows point to the rhodamine cap and phosphorylated tyrosine residue, respectively.
                                                                              Figure 2: Proposed kinase sensor studied by experiments and simulations. (a) Optical image of sensor: A
                                                                              5×5 square array pattern are created by a SEPERISE method (see text). A thin layer of 5 nm titanium
                                                                              followed by a layer of 80 nm gold is deposited on top of the nanocone structures to activate the sensor
                                        kin.                                  surface. The nanostructures trap incident light within the surface, so they look darker than smooth surface.
                                                                              (b) MISSING FIGURE. (c) Nanoscopic structures of the activated areas of the kinase sensor. Peptide probes
                                                                              are immobilized on the gold covered surface of nanocones. (c) Atomic model of kinase sensor. Peptides are
                               V                                          V   colored in green, metallic surface in yellow. A single peptide is highlighted in licorice representation. Blue
                                                                              and red arrows point to the rhodamine cap and phosphorylated tyrosine residue, respectively.
                                                                                                       Spectrometer


  Wednesday, August 1, 2012
MD Simulations Revealed Problems in Design
initial sequence: {1 GLU} {2 GLY} {3 ILE} {4 TYR} {5 GLY} {6 VAL} {7 LEU} {8 PHE} {9 LYS} {10 LYS} {11 LYS} {12 CYS}

 Initial sequence did not work due to surface adhesion and rhodamine aggregation


                                                                                         •Improved sequence.
                                                                                         Avoid residues that
                                                                                         strongly bind to gold
                                                                                         surface.


                                                          •Rhodamines
                                                          molecules tend to
                                                          aggregate.
                                                          Aggregation affects
                                                          peptide bending.


     •MD systems include gold surface, water,
     ions and 5x5 peptide grid, ~ 100,000 atoms.
     •Different sequences tested under positive
     and negative volt biases.

Wednesday, August 1, 2012
Current Design Improved
               New sequence: rhodamin removed and measurement replaced by Raman spectroscopy

        Rhodamine removed,
                                                                                                    40
    Fluorescence signal discarded
                                                                                                    35
                                                         MD Simulations                             30


                                                                                dist Tyr-Gold / A
                                                             show that                                                              +60V
                                                                                                    25
                                                          phosphorylated                                                            -60V
                                                        tyrosine bends the                          20                               0V
                                                       peptide depending on                         15
                                                          voltage polarity
                                                                                                    10

                                                                                                     5

                                                                                                     0
                                                                                                      0   1     2       3       4   5      6

                                                                                                                    time / ns


                                                                                                    800

                                                                                                                +1.2V
                                                         Experiments show                           600         -1.2V


                                                                                intensity / AU
                                                         that peptide bends                                      0V
                                                       towards the surface at
                                                                                                    400
                                                          positive voltages,
                                                            increasing the
                                                         intensity of Raman                         200
      Phosphorylated tyrosine                                   shifts.
                                                                                                      0

       Peptide bending is now measured with Raman Spectroscopy.                                           700           1100        1500
        The detection relies on careful comparison of peak points
                                                                                                                Raman shift / cm-1
Wednesday, August 1, 2012
Unphosphorylated                                                      Phosphorylated
                                                                                                  (a)                  4
                                                                                                                        4
                                                                                                                                      rho-EGIYGVLFKKKC-gold                   (i)
                                                                                                 (a)                                 rho-EGIYGVLFKKKC-gold                    (i)


                                                                                                   dist Y-gold / nm
                                EGIYGVLFKKKC-AU                                                                 EGI(pY)GVLFKKKC-AU
                                                                                                                 3

                                                              Simulation


                                                                                                 dist Y-gold / nm
                                                                                                                       3
                                                                                                                        2
                       40                                                                   40                         2
                       35                                                                   35                          1
                                                                                                                       1
                       30                                                                   30
   dist Tyr-Gold / A


                                                                                                                        0


                                                                        dist Tyr-Gold / A
                       25                                                                                              0        1       2      3        4   +60V
                                                                                                                                                             5   6
                                                                                            25
                                                                                                                               1       2      3
                                                                                                                                            time  /    4
                                                                                                                                                       ns   -60V
                                                                                                                                                             5   6
                       20                                                                   20                                              time / ns         0V
                       15                                                                   15                          4
                                                       +60V                                                            4     (b)     rho-EGI(pY)GVLFKKKC-gold                 (ii)
                       10                              -60V                                 10                              (b)     rho-EGI(pY)GVLFKKKC-gold                  (ii)


                                                                                                    dist Y-gold / nm
                                                                                                                        3


                                                                                                 dist Y-gold / nm
                       5                                0V                                  5                          3                                         (i)

                                                                                                              2                                                 (i)
                       0                                                                    0
                        0   1      2       3       4     5      6                            0              12                2         3          4        5             6
                                                                                                                        1
                                       time / ns                                                                                   time / ns                    (ii)
                                                                                                                       1                                        (ii)
                                                                                                                        0
                                                                                                                                1       2      3        4   5         6
                                                                                                                       0
                                                                                                                               1       2    time
                                                                                                                                              3   /    ns
                                                                                                                                                       4    5         6
                                                                                                                                            time / ns
                                                              Figure 4: Peptide phosphorylation revealed by molecular dynamics simulations. Panels
                                                              Figure 4: Peptide phosphorylation revealed by surface for dynamicsvoltage polarities. Er
                                                              the distance from the tyrosine residue to the gold molecular different simulations. Panels
                                                              thestandard deviation. (a) Non-phosphorylated peptide sensor under +60 V (blue), -60 V (
                                                               ± distance from the tyrosine residue to the gold surface for different voltage polarities. Er
                                                              ± standard deviation. (a) Non-phosphorylated peptide sensor under +60 (red) and -60 V (
                                                               biases. (b) Phosphorylated peptide sensor under +60 V (blue), -60 V V (blue), 0 volta
                                                              biases. (b) Phosphorylated peptide peptides after+60 Vfor +60 V (i) and -60 V 0 volta
                                                               (i) and (ii) show snapshots of two sensor under 5 ns (blue), -60 V (red) and (ii) vo
                                                              (i) and (ii) show snapshots gray tubes. Rhodamine and for +60 V (i) and -60 V (ii) vo
                                                               peptides are represented as of two peptides after 5 ns tyrosine residues are shown in bl
                                                              peptides are represented as gray tubes. Rhodamine and tyrosine residues are shown in bl
                                                               respectively.
                                                              respectively.


Wednesday, August 1, 2012
Unphosphorylated                                                           Phosphorylated
                                                                                                       (a)                  4
                                                                                                                             4
                                                                                                                                           rho-EGIYGVLFKKKC-gold                    (i)
                                                                                                      (a)                                 rho-EGIYGVLFKKKC-gold                     (i)


                                                                                                        dist Y-gold / nm
                                 EGIYGVLFKKKC-AU                                                                     EGI(pY)GVLFKKKC-AU
                                                                                                                      3

                                                                 Simulation


                                                                                                      dist Y-gold / nm
                                                                                                                            3
                                                                                                                             2
                       40                                                                        40                         2
                       35                                                                        35                          1
                                                                                                                            1
                       30                                                                        30
   dist Tyr-Gold / A


                                                                                                                             0


                                                                             dist Tyr-Gold / A
                       25                                                                                                   0        1       2      3        4   +60V
                                                                                                                                                                  5   6
                                                                                                 25
                                                                                                                                    1       2      3
                                                                                                                                                 time  /    4
                                                                                                                                                            ns   -60V
                                                                                                                                                                  5   6
                       20                                                                        20                                              time / ns         0V
                       15                                                                        15                          4
                                                          +60V                                                              4     (b)     rho-EGI(pY)GVLFKKKC-gold                  (ii)
                       10                                 -60V                                   10                              (b)     rho-EGI(pY)GVLFKKKC-gold                   (ii)


                                                                                                         dist Y-gold / nm
                                                                                                                             3


                                                                                                      dist Y-gold / nm
                        5                                  0V                                    5                          3                                           (i)

                                                                                                                   2                                                  (i)
                        0                                                                        0
                         0   1        2       3       4     5        6                            0              12                2         3          4        5              6
                                                                                                                             1
                                          time / ns                                                                                     time / ns                       (ii)
                                                                                                                            1                                         (ii)
                                                                                                                             0
                                                                                                                                     1       2      3        4    5         6

                                                                    Experiment
                                                                                                                            0
                                                                                                                                    1       2    time
                                                                                                                                                   3   /    ns
                                                                                                                                                            4     5         6
                                                                                                                                                 time / ns
                       800                                         Figure 4: Peptide phosphorylation revealed by molecular dynamics simulations. Panels
                                                                                  800

                                                  +1.2V            Figure 4: Peptide phosphorylation revealed by surface for dynamicsvoltage polarities. Er
                                                                   the distance from the tyrosine residue to the gold molecular different simulations. Panels
                       600                        -1.2V            thestandard deviation. (a)+1.2V
                                                                    ± distance from the tyrosine residue to the gold surface for different +60 V (blue), -60 V (
                                                                                              Non-phosphorylated peptide sensor under voltage polarities. Er
                                                                   ± standard deviation. (a) -1.2V
                                                                                   600
                                                                    biases. (b) Phosphorylated peptide sensor under +60 sensor under +60 (red) and -60 V (
                                                                                             Non-phosphorylated peptide V (blue), -60 V V (blue), 0 volta
   intensity / AU


                                                                             intensity / AU


                                                   0V
                                                                   biases. (b) Phosphorylated0V two peptides after+60 Vfor +60 V (i) and -60 V 0 volta
                                                                    (i) and (ii) show snapshots peptide sensor under 5 ns (blue), -60 V (red) and (ii) vo
                                                                                                 of
                       400                                         (i) and (ii) show snapshots gray tubes. Rhodamine and for +60 V (i) and -60 V (ii) vo
                                                                    peptides are represented as of two peptides after 5 ns tyrosine residues are shown in bl
                                                                                   400
                                                                   peptides are represented as gray tubes. Rhodamine and tyrosine residues are shown in bl
                                                                    respectively.
                       200                                         respectively. 200


                         0                                                                        0

                             700              1100          1500                                               700                          1100                 1500

                                   Raman shift / cm-1                                                                           Raman shift / cm-1
Wednesday, August 1, 2012
dist
                                   Simulation-Optimized                             1


                                   Sequence       0
                                                     1  2                                                   3     4      5
                                                                                                      time / ns

                   4                                                                4
                       (a)       EGIYGVLAAAAC-gold
                                                                                        (b)
dist Y-gold / nm


                                                                 dist Y-gold / nm
                   3                                                                3


                   2                                                                2             EGI(pY)GVLAAAAC-gold


                   1                                                                1


                   0                                                                0
                             1      2     3      4   5                                        1      2      3     4      5
                                     time / ns                                                        time / ns
  A new sequence is proposed from molecular dynamics simulations. There are dynamics simulations
                                    Figure 5: Optimized sequence. A new sequence is proposed from molecular no
  rhodamine caps, avoiding aggregation. Unnecessary lysineUnnecessary lysine residues (a), whileby alanine residu
     4
                                    is no rhodamine caps; avoiding aggregation.
                                                                                    residueselectric field changed the phosphoryla
                                    non-phosphorylated peptide sensor is still insensitive to an
                                                                                                    are changed to
  alanine residues. The resulting non-phosphorylated peptide sensor is still distinctive raman signat
        (b)                         is responsive to an external electric field (b); therefore it should produce
  insensitive to an electric field, while the and 0 voltage Error bars represent is standard deviation. to an red an green r
                                    opposite voltage polarities.
                                                   phosphorylated one ± responsive Color blue,
t Y-gold / nm


                                    +60 V, -60 V                 biases.
     3
  external electric field; therefore the sensor should produce distinctive Raman
  signatures for opposite voltage polarities. Error bars represent standard deviation.
  Colors blue, red, and green represent +60 V, -60 V and 0 voltage biases.
     2          EGI(pY)GVLAAAAC-gold
Wednesday, August 1, 2012                                                                            16
Imaging Cellular Machines


Wednesday, August 1, 2012
14

                                                                                  Larger machines
                                                                                     enable larger
                                                                                      simulations


                            BTRC for Macromolecular Modeling and Bioinformatics            Beckman Institute, UIUC
                                          http://www.ks.uiuc.edu/

Wednesday, August 1, 2012
Petascale Gateway to the Nation’s Top Computers

                            Petascale computers (e.g., Blue Waters) will create
                            ~100x larger datasets. The BTRC Petascale Gateway
                            provides the necessary storage and analysis facilities
                            all located in the BTRC area.


                                      1-10 Gigabit Network

      External                                                                     Visitor,
  Resources, 90%                                                                 Researcher &
  of our Computer                                                                 Developer
       Power                                                                     Workstations
                                                                                    Beckman Institute, UIUC
                              RecentMacromolecular Modeling and Bioinformatics
                              BTRC for
                                         http://www.ks.uiuc.edu/

Wednesday, August 1, 2012
How NAMD Runs Efficiently on Large Parallel Computers
      Before Load Balancing: Much Idle CPU Time!
                              23,000 atoms on BlueGene/P 4K processor cores
                                                  WHITE =                                          32 ns/day
                                               IDLE CPU TIME!
                                                                                                 2.75 ms/step
 Percentage CPU Utilization


                                                                    Time


                                           BTRC for Macromolecular Modeling and Bioinformatics      Beckman Institute, UIUC
                                                         http://www.ks.uiuc.edu/

Wednesday, August 1, 2012
After Load Balancing: Efficient Computing!
                              23,000 atoms on BlueGene/P 4K processor cores
                                           IDLE TIME REDUCED ~ 40%                                 63 ns/day
                                                                                                 1.38 ms/step
 Percentage CPU Utilization


                                                                    Time


                                           BTRC for Macromolecular Modeling and Bioinformatics      Beckman Institute, UIUC
                                                         http://www.ks.uiuc.edu/

Wednesday, August 1, 2012
18
         Computational Microscope on New Supercomputers
                   100M-atom performance on Jaguar and Blue Waters
                              Jaguar
                              BlueWaters                                                                           Cray
                                                                                                  Jaguar XT5 (ORNL)
           4.000
                                                                                                  224,000 cores
ns/day


           3.000
           2.000                                                                                  BlueWaters XE6 (UIUC)
           1.000                                                                                  380,000 cores, 3000 GPUs

                  0
                       0              75000              150000             225000             300000

                   Number of Cores
                                                             1.50           CPU 12 cores
                                                                            CPU 12 cores + 1 GPU
                                                              1.13          CPU 12 cores + 2 GPU
                 Tsubame                                                    CPU 12 cores + 3 GPU
                                                               0.75
                                              ns/day


     Tokyo Institute of Tech.
     4224 GPUs                                                 0.38

                                                                     0
   50,000 registered users                                                  64              128              256   512         700
                                                       BTRC for Macromolecular Modeling and Bioinformatics                   Beckman Institute, UIUC
                                                                     http://www.ks.uiuc.edu/
                                                                                                   Number of Nodes
  Wednesday, August 1, 2012
19

            1M Atom VirusGPU and CPU performanceGPU
                  1M-atom stmv on TitanDev

                            GPU
                            CPU
                  5
                             Single STMV
                            PME every 4 steps
   ns/day


                  1


               0.2


                       1          2   4          8             16            32           64   128   256        512
                                                       number of nodes
                                      BTRC for Macromolecular Modeling and Bioinformatics
                                                    http://www.ks.uiuc.edu/
                                                                                                      Beckman Institute, UIUC


Wednesday, August 1, 2012
20

                            100M Atoms on TitanDev


                                 BTRC for Macromolecular Modeling and Bioinformatics   Beckman Institute, UIUC
                                               http://www.ks.uiuc.edu/

Wednesday, August 1, 2012
Advanced Computer Facilities
                                                 and the
                             Computational Microscope
                                                                                 Illinois Petascale
                                                                               Computing Facility


                                  BTRC for Macromolecular Modeling and Bioinformatics           Beckman Institute, UIUC
                                                http://www.ks.uiuc.edu/

Wednesday, August 1, 2012
2
   Molecular Dynamics Flexible Fitting (MDFF) Method
    Electron microscopy                                                                                      X-ray crystallography


                                              MDFF
                                                                                                     APS at Argonne

                    FEI microscope


                                                                                                                    Acetyl – CoA Synthase

                                     L. Trabuco, E. Villa, K. Mitra, J. Frank, and K. Schulten. Flexible fitting of atomic structures into electron
                                     microscopy maps using molecular dynamics. Structure, 16:673-683, 2008.

Wednesday, August 1, 2012
4
      MDFF is young (2008), yet already successful
Over 30 reports of MDFF applications:
• By Group Researchers:
   Villa et al. PNAS (2009): EF-Tu ribosome complex
   Seidelt et al. Science (2009): TnaC ribosome translation stalling
   Becker et al. Science (2009): Sec61 ribosome complex
   Frauenfeld et al. Nat. Struct. Mol. Biol. (2011): SecYE ribosome complex
 
 Agirrezabala et al. PNAS (2012): Ribosome translocation intermediates

• By Outside Researchers:
    Lorenz et al. PNAS (2010): actin-myosin interface
    Bhushan et al. Nat. Struct. Mol. Biol. (2010): α-helical nascent chains
    Armache et al. PNAS (2011): Eukaryotic ribosomal proteins
    Armache et al. PNAS (2011): Translating eukaryotic ribosome
    Guo et al. PNAS (2011): RsgA GTPase on ribosomal subunit
    Becker et al. Nat. Struct. Mol. Biol. (2011) Dom34–Hbs1 stalled ribosome
    complex
    Wollmann et al. Nature (2011): Mot1–TBP complex
    Strunk et al. Science (2011): Ribosome assembly factors
    Lasker et al. PNAS (2012): Proteasome
    Becker et al. Nature (2012): Ribosome recycling complex
                                                                               MDFF derived ribosome structure
                                                                                  Villa et al. PNAS 2009

                    Tightly integrated into NAMD and VMD
                        • Capable of quickly fitting very large structures
                        • Adaptable to a wide range of applications

Wednesday, August 1, 2012
Computation and Experiment in Virology                           10

                            Collaboration with A. Gronenborn et al, U. Pittsburgh
 Molecular Dynamics Flexible Fitting of Tubular HIV Capsid:
   In the tubular geometry the capsid contains only hexameric subunits.

      EM                                                                       fitted
     density                                                                 structure


                                        view of hexameric
                                      subunit during MDFF
                                     final cross-correlation 0.96
                                  Relaxation of capsid segment requires
                                   13 million atom MD simulation on
                                       Blue Waters, 50 ns ns done
Wednesday, August 1, 2012
ed within a cone-shaped capsid assembled from ≈1500 copies of the viral capsid protein (CA)
                      From Cylinder to HIV Capsid
ous attempts have been made to model the HIV capsid as a fullerene cone composed of ≈250
examers and 12 CA-pentamers, either by self-assembling of coarse-grained models [28] or
                       Replace hexameric units by pentameric units
 o-atomic models [29]; however, these models lack the atomic-level interactions that hold the
d together.
                             Collaboration with A. Gronenborn et al, U. Pittsburgh


     hexamers               pentamer              whole capsid made of
e 3: million atoms of the hexameric form of thehexamers found in cylindrical assemblies
10 (A) All-atom model          unit             CA protein as and 12 pentamers
V capsids in vitro. The model accurately captures the curvature of the tube. (B) CA pentame
                                                               60 million atoms
 nded by five CA hexamers. (C) Schlegel diagram for a fullerene end apex connected to a cylindrica
of hexagonally linked carbon atoms.

 Wednesday, August 1, 2012
Recent MDFF application: Intra-ring cooperation in group II chaperonins
Collaboration with Fei Sun (Chinese Academy of Sciences)
            Zhang et al. Submitted. Mar 2012    Symmetry-restrained
                                                                MDFF applied to 12 EM maps
                                         revealed role of electrostatic interaction in chaperonin
                                                       hetero-oligomer formation


                                 EM Maps of Various Chaperonin Conformations


                                                                                               5

Wednesday, August 1, 2012
Our Grand Ribosome Collaboration


Joachim Frank               Roland Beckmann Taekjip Ha               Kurt Fredrick       Ruben Gonzalez
(Columbia U.)               (U. Munich)     (UIUC)                   (Ohio State U.)     (Columbia U.)

Cryo-EM                     Cryo-EM              Single-molecule     Mutagenesis         Single-molecule
                                                 FRET                experiments         FRET

Structure (2008),           Science (2009) x2,   J. Mol. Bio. (2010), New collaborator   New collaborator
PNAS (2009),                Nature Struct.       1 submitted
Proteins (2011),            Mol. Bio (2011),
EMBO J. (2011),             1 submitted
PNAS (2012)


Wednesday, August 1, 2012
Science 3: How Proteins AreMade from Genetic Blueprint
Low-resolution data                                                High-resolution structure


                            Close-up of nascent protein
                                  Frauenfeld, Gumbart et al. Nat. Struct. Mol. Bio. 18, 614-621, 2011.
Wednesday, August 1, 2012
Molecular Dynamics Flexible Fitting (MDFF)
     Study of the Localization of Nascent Proteins                               9


            Ribosome expressing
             membrane protein


                                                                 James Gumbart


2.7 million atom simulation


           Ribosome-SecY-complex
Frauenfeld, Gumbart et al. Nat. Struct. Mol. Bio. 18, 614-621, 2011.
Wednesday, August 1, 2012
Molecular Dynamics Flexible Fitting (MDFF)
     Study of the Localization of Nascent Proteins                                                    9


            Ribosome expressing                                               Ribosome expressing a
             membrane protein                                                    cytosolic protein


                                   QM description of
                                   cation-π interaction
                                 between nascent chain
                                     and exit tunnel
                                  L.Trabuco, C. Harrison, E. Schreiner, and
                                  K. Schulten. Recognition of the
                                  regulatory nascent chain TnaC by the
2.7 million atom simulation       ribosome. Structure, 18:627-637, 2010.


                                                                               Ribosome-Trigger Factor-
           Ribosome-SecY-complex                                                      complex
Frauenfeld, Gumbart et al. Nat. Struct. Mol. Bio. 18, 614-621, 2011.
Wednesday, August 1, 2012
Structural characterization of mRNA-tRNA translocation intermediates


                            X. Agirrezabala, H. Liao, E.
                            Schreiner, J. Fu, R. Ortiz-
                            Meoz, K. Schulten, R. Green,
                            and J. Frank. PNAS
                            109:6094-6099, 2012.


Wednesday, August 1, 2012
Lots to be done!


                             BTRC for Macromolecular Modeling and Bioinformatics   Beckman Institute, UIUC
                                           http://www.ks.uiuc.edu/

Wednesday, August 1, 2012
17


                  Achievements Built on People
  5 faculty members (2 physics, 1 chemistry, 1 biochemistry, 1 computer science);
  8 developers; 1 system admin.; 16 post docs; 24 graduate students; 3 administrative staff

  L. Kale, J. Phillips: NAMD       J. Frank, Columbia U.: MDFF, ribosome
  J. Stone, K. Vandivort: VMD R. Beckmann, U. Munich: ribosome
  I. Solov’yov, D. Chandler, M. W. Baumeister, MPI: whole cell imaging
  Sener, J. Strumpfer, J. Perilla, L. Liu, Greg Timp, UIUC, H. Gaub, U.
  Y. Liu, J. Gumbart, Y. Chan, X. Munich: biosensors; N. Hunter, Sheffield:
  Zou, E. Cruz-Chu: Science Proj.photosynthesis;.


                               BTRC for Macromolecular Modeling and Bioinformatics   Beckman Institute, UIUC
                                             http://www.ks.uiuc.edu/

Wednesday, August 1, 2012

More Related Content

What's hot

FTIR Studies and Dielectric Properties of Cu Substituted Nano Crystalline Nic...
FTIR Studies and Dielectric Properties of Cu Substituted Nano Crystalline Nic...FTIR Studies and Dielectric Properties of Cu Substituted Nano Crystalline Nic...
FTIR Studies and Dielectric Properties of Cu Substituted Nano Crystalline Nic...IOSR Journals
 
Microstructural and Magnetic Properties of Cobalt Ferrite Nanoparticles Synth...
Microstructural and Magnetic Properties of Cobalt Ferrite Nanoparticles Synth...Microstructural and Magnetic Properties of Cobalt Ferrite Nanoparticles Synth...
Microstructural and Magnetic Properties of Cobalt Ferrite Nanoparticles Synth...ijtsrd
 
University of Toronto Chemistry Librarians Workshop June 2012
University of Toronto Chemistry Librarians Workshop June 2012University of Toronto Chemistry Librarians Workshop June 2012
University of Toronto Chemistry Librarians Workshop June 2012Brock University
 
Structural and Dielectric Studies of Cerium Substituted Nickel Ferrite Nano P...
Structural and Dielectric Studies of Cerium Substituted Nickel Ferrite Nano P...Structural and Dielectric Studies of Cerium Substituted Nickel Ferrite Nano P...
Structural and Dielectric Studies of Cerium Substituted Nickel Ferrite Nano P...theijes
 
Physica b 08
Physica b 08Physica b 08
Physica b 08aman2395
 
Electrocatalytic Evaluation in Methanol Oxidation Process of PtCo Nanoparticl...
Electrocatalytic Evaluation in Methanol Oxidation Process of PtCo Nanoparticl...Electrocatalytic Evaluation in Methanol Oxidation Process of PtCo Nanoparticl...
Electrocatalytic Evaluation in Methanol Oxidation Process of PtCo Nanoparticl...David Macias Ferrer
 
Kacaretal Adv Mater2009
Kacaretal Adv Mater2009Kacaretal Adv Mater2009
Kacaretal Adv Mater2009labkit
 
G03504047053
G03504047053G03504047053
G03504047053theijes
 
Chitosan capped Silver nanoparticles used as Pressure sensors
Chitosan capped Silver nanoparticles used as Pressure sensorsChitosan capped Silver nanoparticles used as Pressure sensors
Chitosan capped Silver nanoparticles used as Pressure sensorsIOSR Journals
 
Ivan Yordanov highlights
Ivan Yordanov highlightsIvan Yordanov highlights
Ivan Yordanov highlightsIvan Yordanov
 
Nano Tailoring of MnO2 Doped Multiwalled Carbon Nanotubes as Electrode Materi...
Nano Tailoring of MnO2 Doped Multiwalled Carbon Nanotubes as Electrode Materi...Nano Tailoring of MnO2 Doped Multiwalled Carbon Nanotubes as Electrode Materi...
Nano Tailoring of MnO2 Doped Multiwalled Carbon Nanotubes as Electrode Materi...IRJET Journal
 
Le Van Hai- Resume
Le Van Hai- ResumeLe Van Hai- Resume
Le Van Hai- ResumeLe Hai
 
IRJET - Electrophoretic Deposition of Calcium phosphate Ceramics over Dup...
IRJET -  	  Electrophoretic Deposition of Calcium phosphate Ceramics over Dup...IRJET -  	  Electrophoretic Deposition of Calcium phosphate Ceramics over Dup...
IRJET - Electrophoretic Deposition of Calcium phosphate Ceramics over Dup...IRJET Journal
 
Capturing Effective Permeabilities of Field Compaction bands
Capturing Effective Permeabilities of Field Compaction bandsCapturing Effective Permeabilities of Field Compaction bands
Capturing Effective Permeabilities of Field Compaction bandsstvsun
 
Optimization for the fabrication of ternary halide perovskite solar cells via...
Optimization for the fabrication of ternary halide perovskite solar cells via...Optimization for the fabrication of ternary halide perovskite solar cells via...
Optimization for the fabrication of ternary halide perovskite solar cells via...CHUN-HAO KUNG
 

What's hot (20)

Webinar Geosciences 2012
Webinar Geosciences 2012Webinar Geosciences 2012
Webinar Geosciences 2012
 
FTIR Studies and Dielectric Properties of Cu Substituted Nano Crystalline Nic...
FTIR Studies and Dielectric Properties of Cu Substituted Nano Crystalline Nic...FTIR Studies and Dielectric Properties of Cu Substituted Nano Crystalline Nic...
FTIR Studies and Dielectric Properties of Cu Substituted Nano Crystalline Nic...
 
11.m. kamruzzaman 117 124
11.m. kamruzzaman  117 12411.m. kamruzzaman  117 124
11.m. kamruzzaman 117 124
 
Microstructural and Magnetic Properties of Cobalt Ferrite Nanoparticles Synth...
Microstructural and Magnetic Properties of Cobalt Ferrite Nanoparticles Synth...Microstructural and Magnetic Properties of Cobalt Ferrite Nanoparticles Synth...
Microstructural and Magnetic Properties of Cobalt Ferrite Nanoparticles Synth...
 
University of Toronto Chemistry Librarians Workshop June 2012
University of Toronto Chemistry Librarians Workshop June 2012University of Toronto Chemistry Librarians Workshop June 2012
University of Toronto Chemistry Librarians Workshop June 2012
 
Structural and Dielectric Studies of Cerium Substituted Nickel Ferrite Nano P...
Structural and Dielectric Studies of Cerium Substituted Nickel Ferrite Nano P...Structural and Dielectric Studies of Cerium Substituted Nickel Ferrite Nano P...
Structural and Dielectric Studies of Cerium Substituted Nickel Ferrite Nano P...
 
Vamsi
VamsiVamsi
Vamsi
 
Physica b 08
Physica b 08Physica b 08
Physica b 08
 
Electrocatalytic Evaluation in Methanol Oxidation Process of PtCo Nanoparticl...
Electrocatalytic Evaluation in Methanol Oxidation Process of PtCo Nanoparticl...Electrocatalytic Evaluation in Methanol Oxidation Process of PtCo Nanoparticl...
Electrocatalytic Evaluation in Methanol Oxidation Process of PtCo Nanoparticl...
 
Kacaretal Adv Mater2009
Kacaretal Adv Mater2009Kacaretal Adv Mater2009
Kacaretal Adv Mater2009
 
G03504047053
G03504047053G03504047053
G03504047053
 
Chitosan capped Silver nanoparticles used as Pressure sensors
Chitosan capped Silver nanoparticles used as Pressure sensorsChitosan capped Silver nanoparticles used as Pressure sensors
Chitosan capped Silver nanoparticles used as Pressure sensors
 
Ivan Yordanov highlights
Ivan Yordanov highlightsIvan Yordanov highlights
Ivan Yordanov highlights
 
H41025565
H41025565H41025565
H41025565
 
Nano Tailoring of MnO2 Doped Multiwalled Carbon Nanotubes as Electrode Materi...
Nano Tailoring of MnO2 Doped Multiwalled Carbon Nanotubes as Electrode Materi...Nano Tailoring of MnO2 Doped Multiwalled Carbon Nanotubes as Electrode Materi...
Nano Tailoring of MnO2 Doped Multiwalled Carbon Nanotubes as Electrode Materi...
 
Le Van Hai- Resume
Le Van Hai- ResumeLe Van Hai- Resume
Le Van Hai- Resume
 
IRJET - Electrophoretic Deposition of Calcium phosphate Ceramics over Dup...
IRJET -  	  Electrophoretic Deposition of Calcium phosphate Ceramics over Dup...IRJET -  	  Electrophoretic Deposition of Calcium phosphate Ceramics over Dup...
IRJET - Electrophoretic Deposition of Calcium phosphate Ceramics over Dup...
 
Capturing Effective Permeabilities of Field Compaction bands
Capturing Effective Permeabilities of Field Compaction bandsCapturing Effective Permeabilities of Field Compaction bands
Capturing Effective Permeabilities of Field Compaction bands
 
Polymer
PolymerPolymer
Polymer
 
Optimization for the fabrication of ternary halide perovskite solar cells via...
Optimization for the fabrication of ternary halide perovskite solar cells via...Optimization for the fabrication of ternary halide perovskite solar cells via...
Optimization for the fabrication of ternary halide perovskite solar cells via...
 

Similar to The Computational Microscope Images Biomolecular Machines and Nanodevices - Klaus Schulten

PhD_10_2011_Abhijeet_Paul
PhD_10_2011_Abhijeet_PaulPhD_10_2011_Abhijeet_Paul
PhD_10_2011_Abhijeet_PaulAbhijeet Paul
 
Using Photonics to Prototype the Research Campus Infrastructure of the Future...
Using Photonics to Prototype the Research Campus Infrastructure of the Future...Using Photonics to Prototype the Research Campus Infrastructure of the Future...
Using Photonics to Prototype the Research Campus Infrastructure of the Future...Larry Smarr
 
Presentation on Perovskite Solar Cell.
Presentation on Perovskite Solar Cell. Presentation on Perovskite Solar Cell.
Presentation on Perovskite Solar Cell. Fazlul K. Palash
 
Maria Burka - Chemical Engineering in the 21st Century
Maria Burka - Chemical Engineering in the 21st CenturyMaria Burka - Chemical Engineering in the 21st Century
Maria Burka - Chemical Engineering in the 21st Centuryponenciasexpoquim11
 
Opal and inverse opal structures for optical device applications
Opal and inverse opal structures for optical device applicationsOpal and inverse opal structures for optical device applications
Opal and inverse opal structures for optical device applicationsM. Faisal Halim
 
Viii. molecular electronics and nanoscience
Viii. molecular electronics and nanoscienceViii. molecular electronics and nanoscience
Viii. molecular electronics and nanoscienceAllenHermann
 
Additive Micromanufacturing for Engineered Materials by LLNL engineer, Christ...
Additive Micromanufacturing for Engineered Materials by LLNL engineer, Christ...Additive Micromanufacturing for Engineered Materials by LLNL engineer, Christ...
Additive Micromanufacturing for Engineered Materials by LLNL engineer, Christ...Industrial Partnerships Office
 
Lattice Energy LLC-Nickel-seed LENR Networks-April 20 2011
Lattice Energy LLC-Nickel-seed LENR Networks-April 20 2011Lattice Energy LLC-Nickel-seed LENR Networks-April 20 2011
Lattice Energy LLC-Nickel-seed LENR Networks-April 20 2011Lewis Larsen
 
Nanotechnology Presentation For Electronic Industry
Nanotechnology Presentation For Electronic IndustryNanotechnology Presentation For Electronic Industry
Nanotechnology Presentation For Electronic Industrytabirsir
 
beta gallium oxide based optoelectronic synaptic devices.pptx
beta gallium oxide based optoelectronic synaptic devices.pptxbeta gallium oxide based optoelectronic synaptic devices.pptx
beta gallium oxide based optoelectronic synaptic devices.pptxbishallaskarm22
 
DEVELOPING CRYO-ELECTRON MICROSCOPY OF BIOMOLECULES IN WATER
DEVELOPING  CRYO-ELECTRON MICROSCOPY OF BIOMOLECULES IN WATERDEVELOPING  CRYO-ELECTRON MICROSCOPY OF BIOMOLECULES IN WATER
DEVELOPING CRYO-ELECTRON MICROSCOPY OF BIOMOLECULES IN WATERGuttiPavan
 
Optofluidic Devices
Optofluidic DevicesOptofluidic Devices
Optofluidic Devicesprathul Nath
 
Transversely Isotropic Elastic Properties of Vacancy Defected Boron Nitride N...
Transversely Isotropic Elastic Properties of Vacancy Defected Boron Nitride N...Transversely Isotropic Elastic Properties of Vacancy Defected Boron Nitride N...
Transversely Isotropic Elastic Properties of Vacancy Defected Boron Nitride N...Vijay Choyal
 

Similar to The Computational Microscope Images Biomolecular Machines and Nanodevices - Klaus Schulten (20)

Advanced medical micro devices
Advanced medical micro devicesAdvanced medical micro devices
Advanced medical micro devices
 
PhD_10_2011_Abhijeet_Paul
PhD_10_2011_Abhijeet_PaulPhD_10_2011_Abhijeet_Paul
PhD_10_2011_Abhijeet_Paul
 
Final Poster
Final PosterFinal Poster
Final Poster
 
Quantum dots
Quantum dots Quantum dots
Quantum dots
 
Using Photonics to Prototype the Research Campus Infrastructure of the Future...
Using Photonics to Prototype the Research Campus Infrastructure of the Future...Using Photonics to Prototype the Research Campus Infrastructure of the Future...
Using Photonics to Prototype the Research Campus Infrastructure of the Future...
 
Presentation on Perovskite Solar Cell.
Presentation on Perovskite Solar Cell. Presentation on Perovskite Solar Cell.
Presentation on Perovskite Solar Cell.
 
Pomrenke - Optoelectronic Information Processing - Spring Review 2012
Pomrenke - Optoelectronic Information Processing - Spring Review 2012Pomrenke - Optoelectronic Information Processing - Spring Review 2012
Pomrenke - Optoelectronic Information Processing - Spring Review 2012
 
Maria Burka - Chemical Engineering in the 21st Century
Maria Burka - Chemical Engineering in the 21st CenturyMaria Burka - Chemical Engineering in the 21st Century
Maria Burka - Chemical Engineering in the 21st Century
 
Opal and inverse opal structures for optical device applications
Opal and inverse opal structures for optical device applicationsOpal and inverse opal structures for optical device applications
Opal and inverse opal structures for optical device applications
 
PhD_Projects_Portfolio
PhD_Projects_PortfolioPhD_Projects_Portfolio
PhD_Projects_Portfolio
 
Viii. molecular electronics and nanoscience
Viii. molecular electronics and nanoscienceViii. molecular electronics and nanoscience
Viii. molecular electronics and nanoscience
 
Additive Micromanufacturing for Engineered Materials by LLNL engineer, Christ...
Additive Micromanufacturing for Engineered Materials by LLNL engineer, Christ...Additive Micromanufacturing for Engineered Materials by LLNL engineer, Christ...
Additive Micromanufacturing for Engineered Materials by LLNL engineer, Christ...
 
Nanomedicine 2005
Nanomedicine 2005Nanomedicine 2005
Nanomedicine 2005
 
Lattice Energy LLC-Nickel-seed LENR Networks-April 20 2011
Lattice Energy LLC-Nickel-seed LENR Networks-April 20 2011Lattice Energy LLC-Nickel-seed LENR Networks-April 20 2011
Lattice Energy LLC-Nickel-seed LENR Networks-April 20 2011
 
Nanotechnology Presentation For Electronic Industry
Nanotechnology Presentation For Electronic IndustryNanotechnology Presentation For Electronic Industry
Nanotechnology Presentation For Electronic Industry
 
beta gallium oxide based optoelectronic synaptic devices.pptx
beta gallium oxide based optoelectronic synaptic devices.pptxbeta gallium oxide based optoelectronic synaptic devices.pptx
beta gallium oxide based optoelectronic synaptic devices.pptx
 
DEVELOPING CRYO-ELECTRON MICROSCOPY OF BIOMOLECULES IN WATER
DEVELOPING  CRYO-ELECTRON MICROSCOPY OF BIOMOLECULES IN WATERDEVELOPING  CRYO-ELECTRON MICROSCOPY OF BIOMOLECULES IN WATER
DEVELOPING CRYO-ELECTRON MICROSCOPY OF BIOMOLECULES IN WATER
 
Optofluidic Devices
Optofluidic DevicesOptofluidic Devices
Optofluidic Devices
 
Nanocomputers
NanocomputersNanocomputers
Nanocomputers
 
Transversely Isotropic Elastic Properties of Vacancy Defected Boron Nitride N...
Transversely Isotropic Elastic Properties of Vacancy Defected Boron Nitride N...Transversely Isotropic Elastic Properties of Vacancy Defected Boron Nitride N...
Transversely Isotropic Elastic Properties of Vacancy Defected Boron Nitride N...
 

Recently uploaded

Activity 01 - Artificial Culture (1).pdf
Activity 01 - Artificial Culture (1).pdfActivity 01 - Artificial Culture (1).pdf
Activity 01 - Artificial Culture (1).pdfciinovamais
 
Nutritional Needs Presentation - HLTH 104
Nutritional Needs Presentation - HLTH 104Nutritional Needs Presentation - HLTH 104
Nutritional Needs Presentation - HLTH 104misteraugie
 
Mixin Classes in Odoo 17 How to Extend Models Using Mixin Classes
Mixin Classes in Odoo 17  How to Extend Models Using Mixin ClassesMixin Classes in Odoo 17  How to Extend Models Using Mixin Classes
Mixin Classes in Odoo 17 How to Extend Models Using Mixin ClassesCeline George
 
Gardella_PRCampaignConclusion Pitch Letter
Gardella_PRCampaignConclusion Pitch LetterGardella_PRCampaignConclusion Pitch Letter
Gardella_PRCampaignConclusion Pitch LetterMateoGardella
 
SECOND SEMESTER TOPIC COVERAGE SY 2023-2024 Trends, Networks, and Critical Th...
SECOND SEMESTER TOPIC COVERAGE SY 2023-2024 Trends, Networks, and Critical Th...SECOND SEMESTER TOPIC COVERAGE SY 2023-2024 Trends, Networks, and Critical Th...
SECOND SEMESTER TOPIC COVERAGE SY 2023-2024 Trends, Networks, and Critical Th...KokoStevan
 
Grant Readiness 101 TechSoup and Remy Consulting
Grant Readiness 101 TechSoup and Remy ConsultingGrant Readiness 101 TechSoup and Remy Consulting
Grant Readiness 101 TechSoup and Remy ConsultingTechSoup
 
Measures of Central Tendency: Mean, Median and Mode
Measures of Central Tendency: Mean, Median and ModeMeasures of Central Tendency: Mean, Median and Mode
Measures of Central Tendency: Mean, Median and ModeThiyagu K
 
An Overview of Mutual Funds Bcom Project.pdf
An Overview of Mutual Funds Bcom Project.pdfAn Overview of Mutual Funds Bcom Project.pdf
An Overview of Mutual Funds Bcom Project.pdfSanaAli374401
 
This PowerPoint helps students to consider the concept of infinity.
This PowerPoint helps students to consider the concept of infinity.This PowerPoint helps students to consider the concept of infinity.
This PowerPoint helps students to consider the concept of infinity.christianmathematics
 
Gardella_Mateo_IntellectualProperty.pdf.
Gardella_Mateo_IntellectualProperty.pdf.Gardella_Mateo_IntellectualProperty.pdf.
Gardella_Mateo_IntellectualProperty.pdf.MateoGardella
 
How to Give a Domain for a Field in Odoo 17
How to Give a Domain for a Field in Odoo 17How to Give a Domain for a Field in Odoo 17
How to Give a Domain for a Field in Odoo 17Celine George
 
Presentation by Andreas Schleicher Tackling the School Absenteeism Crisis 30 ...
Presentation by Andreas Schleicher Tackling the School Absenteeism Crisis 30 ...Presentation by Andreas Schleicher Tackling the School Absenteeism Crisis 30 ...
Presentation by Andreas Schleicher Tackling the School Absenteeism Crisis 30 ...EduSkills OECD
 
Z Score,T Score, Percential Rank and Box Plot Graph
Z Score,T Score, Percential Rank and Box Plot GraphZ Score,T Score, Percential Rank and Box Plot Graph
Z Score,T Score, Percential Rank and Box Plot GraphThiyagu K
 
The basics of sentences session 2pptx copy.pptx
The basics of sentences session 2pptx copy.pptxThe basics of sentences session 2pptx copy.pptx
The basics of sentences session 2pptx copy.pptxheathfieldcps1
 
1029-Danh muc Sach Giao Khoa khoi 6.pdf
1029-Danh muc Sach Giao Khoa khoi  6.pdf1029-Danh muc Sach Giao Khoa khoi  6.pdf
1029-Danh muc Sach Giao Khoa khoi 6.pdfQucHHunhnh
 
Explore beautiful and ugly buildings. Mathematics helps us create beautiful d...
Explore beautiful and ugly buildings. Mathematics helps us create beautiful d...Explore beautiful and ugly buildings. Mathematics helps us create beautiful d...
Explore beautiful and ugly buildings. Mathematics helps us create beautiful d...christianmathematics
 
ICT Role in 21st Century Education & its Challenges.pptx
ICT Role in 21st Century Education & its Challenges.pptxICT Role in 21st Century Education & its Challenges.pptx
ICT Role in 21st Century Education & its Challenges.pptxAreebaZafar22
 
Unit-IV- Pharma. Marketing Channels.pptx
Unit-IV- Pharma. Marketing Channels.pptxUnit-IV- Pharma. Marketing Channels.pptx
Unit-IV- Pharma. Marketing Channels.pptxVishalSingh1417
 

Recently uploaded (20)

Activity 01 - Artificial Culture (1).pdf
Activity 01 - Artificial Culture (1).pdfActivity 01 - Artificial Culture (1).pdf
Activity 01 - Artificial Culture (1).pdf
 
Nutritional Needs Presentation - HLTH 104
Nutritional Needs Presentation - HLTH 104Nutritional Needs Presentation - HLTH 104
Nutritional Needs Presentation - HLTH 104
 
Mixin Classes in Odoo 17 How to Extend Models Using Mixin Classes
Mixin Classes in Odoo 17  How to Extend Models Using Mixin ClassesMixin Classes in Odoo 17  How to Extend Models Using Mixin Classes
Mixin Classes in Odoo 17 How to Extend Models Using Mixin Classes
 
Mehran University Newsletter Vol-X, Issue-I, 2024
Mehran University Newsletter Vol-X, Issue-I, 2024Mehran University Newsletter Vol-X, Issue-I, 2024
Mehran University Newsletter Vol-X, Issue-I, 2024
 
Gardella_PRCampaignConclusion Pitch Letter
Gardella_PRCampaignConclusion Pitch LetterGardella_PRCampaignConclusion Pitch Letter
Gardella_PRCampaignConclusion Pitch Letter
 
SECOND SEMESTER TOPIC COVERAGE SY 2023-2024 Trends, Networks, and Critical Th...
SECOND SEMESTER TOPIC COVERAGE SY 2023-2024 Trends, Networks, and Critical Th...SECOND SEMESTER TOPIC COVERAGE SY 2023-2024 Trends, Networks, and Critical Th...
SECOND SEMESTER TOPIC COVERAGE SY 2023-2024 Trends, Networks, and Critical Th...
 
Grant Readiness 101 TechSoup and Remy Consulting
Grant Readiness 101 TechSoup and Remy ConsultingGrant Readiness 101 TechSoup and Remy Consulting
Grant Readiness 101 TechSoup and Remy Consulting
 
Measures of Central Tendency: Mean, Median and Mode
Measures of Central Tendency: Mean, Median and ModeMeasures of Central Tendency: Mean, Median and Mode
Measures of Central Tendency: Mean, Median and Mode
 
An Overview of Mutual Funds Bcom Project.pdf
An Overview of Mutual Funds Bcom Project.pdfAn Overview of Mutual Funds Bcom Project.pdf
An Overview of Mutual Funds Bcom Project.pdf
 
Código Creativo y Arte de Software | Unidad 1
Código Creativo y Arte de Software | Unidad 1Código Creativo y Arte de Software | Unidad 1
Código Creativo y Arte de Software | Unidad 1
 
This PowerPoint helps students to consider the concept of infinity.
This PowerPoint helps students to consider the concept of infinity.This PowerPoint helps students to consider the concept of infinity.
This PowerPoint helps students to consider the concept of infinity.
 
Gardella_Mateo_IntellectualProperty.pdf.
Gardella_Mateo_IntellectualProperty.pdf.Gardella_Mateo_IntellectualProperty.pdf.
Gardella_Mateo_IntellectualProperty.pdf.
 
How to Give a Domain for a Field in Odoo 17
How to Give a Domain for a Field in Odoo 17How to Give a Domain for a Field in Odoo 17
How to Give a Domain for a Field in Odoo 17
 
Presentation by Andreas Schleicher Tackling the School Absenteeism Crisis 30 ...
Presentation by Andreas Schleicher Tackling the School Absenteeism Crisis 30 ...Presentation by Andreas Schleicher Tackling the School Absenteeism Crisis 30 ...
Presentation by Andreas Schleicher Tackling the School Absenteeism Crisis 30 ...
 
Z Score,T Score, Percential Rank and Box Plot Graph
Z Score,T Score, Percential Rank and Box Plot GraphZ Score,T Score, Percential Rank and Box Plot Graph
Z Score,T Score, Percential Rank and Box Plot Graph
 
The basics of sentences session 2pptx copy.pptx
The basics of sentences session 2pptx copy.pptxThe basics of sentences session 2pptx copy.pptx
The basics of sentences session 2pptx copy.pptx
 
1029-Danh muc Sach Giao Khoa khoi 6.pdf
1029-Danh muc Sach Giao Khoa khoi  6.pdf1029-Danh muc Sach Giao Khoa khoi  6.pdf
1029-Danh muc Sach Giao Khoa khoi 6.pdf
 
Explore beautiful and ugly buildings. Mathematics helps us create beautiful d...
Explore beautiful and ugly buildings. Mathematics helps us create beautiful d...Explore beautiful and ugly buildings. Mathematics helps us create beautiful d...
Explore beautiful and ugly buildings. Mathematics helps us create beautiful d...
 
ICT Role in 21st Century Education & its Challenges.pptx
ICT Role in 21st Century Education & its Challenges.pptxICT Role in 21st Century Education & its Challenges.pptx
ICT Role in 21st Century Education & its Challenges.pptx
 
Unit-IV- Pharma. Marketing Channels.pptx
Unit-IV- Pharma. Marketing Channels.pptxUnit-IV- Pharma. Marketing Channels.pptx
Unit-IV- Pharma. Marketing Channels.pptx
 

The Computational Microscope Images Biomolecular Machines and Nanodevices - Klaus Schulten

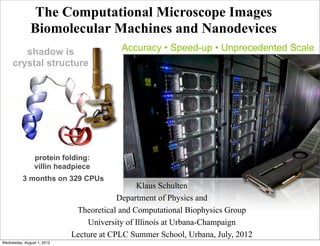
  • 1. The Computational Microscope Images Biomolecular Machines and Nanodevices shadow is Accuracy • Speed-up • Unprecedented Scale crystal structure protein folding: villin headpiece 3 months on 329 CPUs Klaus Schulten Department of Physics and Theoretical and Computational Biophysics Group University of Illinois at Urbana-Champaign Lecture at CPLC Summer School, Urbana, July, 2012 Wednesday, August 1, 2012
  • 2. Our Microscope is Made of... Chemistry NAMD Software 100 ns/day 10 Virus 1 128 256 512 1024 2048 4096 8192 16384 32768 51,000 registered users cores Physics Math ..and Supercomputers (repeat one billion times = microsecond) Wednesday, August 1, 2012
  • 3. 3 Outside researchers choose NAMD and succeed Corringer, et al., Nature, 2011 2100 external citations since 2007 Voth, et al., PNAS, 2010 180K-atom 30 ns study of anesthetic binding to bacterial ligand-gated ion channel provided “complementary interpretations…that could not have been deduced from the static structure alone.” Bound Propofol Anesthetic 500K-atom 500 ns investigation of effect of actin depolymerization factor/cofilin on mechanical properties and conformational dynamics of actin filament. Bare actin Cofilactin Recent NAMD Simulations in Nature • M. Koeksal, et al., Taxadiene synthase structure and evolution of modular architecture in terpene biosynthesis. (2011) • C.-C. Su, et al., Crystal structure of the CusBA heavy-metal efflux complex of Escherichia coli. (2011) • D. Slade, et al., The structure and catalytic mechanism of a poly(ADP-ribose) glycohydrolase. (2011) • F. Rose, et al., Mechanism of copper(II)-induced misfolding of Parkinson’s disease protein. (2011) • L. G. Cuello, et al., Structural basis for the coupling between activation and inactivation gates in K(+) channels. (2010) • S. Dang, et al.,, Structure of a fucose transporter in an outward-open conformation. (2010) • F. Long, et al., Crystal structures of the CusA efflux pump suggest methionine-mediated metal transport. (2010) • R. H. P. Law, et al., The structural basis for membrane binding and pore formation by lymphocyte perforin. (2010) • P. Dalhaimer and T. D. Pollard, Molecular Dynamics Simulations of Arp2/3 Complex Activation. (2010) • J. A. Tainer, et al., Recognition of the Ring-Opened State of Proliferating Cell Nuclear Antigen by Replication Factor C Promotes Eukaryotic Clamp-Loading. (2010) • D. Krepkiy, et al.,, Structure and hydration of membranes embedded with voltage-sensing domains. (2009) • N. Yeung, et al.,, Rational design of a structural and functional nitric oxide reductase. (2009) • Z. Xia, et al., Recognition Mechanism of siRNA by Viral p19 Suppressor ofBioinformatics BTRC for Macromolecular Modeling and RNA Silencing: A Molecular Dynamics Study. (2009) UIUC Beckman Institute, http://www.ks.uiuc.edu/ Wednesday, August 1, 2012
  • 4. Successful folding of largest fast-folding protein: λ-repressor / Collaboration Gruebele-Schulten System: • 5-helix bundle protein • Largest fast-folding protein • Experimental folding time < 20 µs Recent progress: • Successful folding in < 5 µs using enhanced sampling • 100-µs folding trajectory using both NAMD and Anton 0 15 RMSD (Å) Liu et al, J. Chem. Phys. Lett. (2012) Alpha helix Pi-helix 3-10 helix Turn None (coil) BTRC for Macromolecular Modeling and Bioinformatics Beckman Institute, UIUC Lamda repressor folding, 24.1 µs. Per-residue secondary structure and RMSD. http://www.ks.uiuc.edu/ Wednesday, August 1, 2012
  • 5. Computational Microscope at Work: Inspecting the Mechanical Strength of a Blood Clot A Blood Clot 20ns SMD Simulation of fibrinogen, 1.06 million atoms, 1.2 ns/day Red blood cells within a with pencil decomposition, 15 days on PSC XT3 Cray (1024 network of fibrin fibers, processors) composed of polyme- B. Lim, E. Lee, M. Sotomayor, and K. Schulten. Molecular basis of fibrin clot rized fibrinogen mole- elasticity. Structure, 16:449-459, 2008. cules. 12 Wednesday, August 1, 2012
  • 6. Computational Microscope at Work: Inspecting the Mechanical Strength of a Blood Clot A Blood Clot 20ns SMD Simulation of fibrinogen, 1.06 million atoms, 1.2 ns/day Red blood cells within a with pencil decomposition, 15 days on PSC XT3 Cray (1024 network of fibrin fibers, processors) composed of polyme- B. Lim, E. Lee, M. Sotomayor, and K. Schulten. Molecular basis of fibrin clot rized fibrinogen mole- elasticity. Structure, 16:449-459, 2008. cules. 12 Wednesday, August 1, 2012
  • 7. (d) Design of Tyrosine Kinase Sensor •Peptides are attached to a gold surface. The end of oligopeptide contains rhodamine. •Peptides are exposed to ATP and appropriate kinase. •Electric field is applied; change in conformation depends on phosphorylation state. •Distance from rhodamine determines magnitude of fluorescence signal. initial sequence: {1 GLU} {2 GLY} {3 ILE} {4 TYR} {5 GLY} {6 VAL} {7 LEU} {8 PHE} {9 LYS} {10 LYS} {11 LYS} {12 CYS} Rhodamine (R6g) Tyrosine residue interacts with kinases Experiment: Logan Liu and al image of sensor: A (a) by phosphorylation (b) (c) Fluorescence image (d) Chen, Nano Lab, U. Illinois Yi yer of 5 nm titanium showing peptide probes were successfully o activate the sensor (b) immobilized on the (a) nanochip surface (e) than smooth surface. 300 nm ensor. Peptide probes kinase sensor. Peptides are pattern are created by a by experiments and simulations. A thin layerimage nmsensor: A Figure 2: Proposed kinase sensor studied 5×5 square array SEPERISE method (see text). (a) Optical of 5 of titanium representation. Blue of 80 nm gold is depositedwithin theofsurface, so they structures tothan smooth surface. followed by a layer surface. The nanostructures trap incident light on top (a) the nanocone look darker (b) activate the sensor Fluorescence image showing peptide probes (c) (d) ectively. oligopeptide with 12Nanoscopic structures of the activated areas of the kinase sensor. Peptide probes Au surface, (b) MISSING FIGURE. (c) AA, were successfully immobilized on the are immobilized on the gold covered surface of nanocones. (c) Atomic model of kinase sensor. Peptides are nanochip surface bound via sulfide bond colored in green, metallic surface in yellow. A single peptide is highlighted in licorice representation. Blue 300 nm (c) (d) and red arrows point to the rhodamine cap and phosphorylated tyrosine residue, respectively. Figure 2: Proposed kinase sensor studied by experiments and simulations. (a) Optical image of sensor: A 5×5 square array pattern are created by a SEPERISE method (see text). A thin layer of 5 nm titanium followed by a layer of 80 nm gold is deposited on top of the nanocone structures to activate the sensor kin. surface. The nanostructures trap incident light within the surface, so they look darker than smooth surface. (b) MISSING FIGURE. (c) Nanoscopic structures of the activated areas of the kinase sensor. Peptide probes are immobilized on the gold covered surface of nanocones. (c) Atomic model of kinase sensor. Peptides are V V colored in green, metallic surface in yellow. A single peptide is highlighted in licorice representation. Blue and red arrows point to the rhodamine cap and phosphorylated tyrosine residue, respectively. Spectrometer Wednesday, August 1, 2012
  • 8. MD Simulations Revealed Problems in Design initial sequence: {1 GLU} {2 GLY} {3 ILE} {4 TYR} {5 GLY} {6 VAL} {7 LEU} {8 PHE} {9 LYS} {10 LYS} {11 LYS} {12 CYS} Initial sequence did not work due to surface adhesion and rhodamine aggregation •Improved sequence. Avoid residues that strongly bind to gold surface. •Rhodamines molecules tend to aggregate. Aggregation affects peptide bending. •MD systems include gold surface, water, ions and 5x5 peptide grid, ~ 100,000 atoms. •Different sequences tested under positive and negative volt biases. Wednesday, August 1, 2012
  • 9. Current Design Improved New sequence: rhodamin removed and measurement replaced by Raman spectroscopy Rhodamine removed, 40 Fluorescence signal discarded 35 MD Simulations 30 dist Tyr-Gold / A show that +60V 25 phosphorylated -60V tyrosine bends the 20 0V peptide depending on 15 voltage polarity 10 5 0 0 1 2 3 4 5 6 time / ns 800 +1.2V Experiments show 600 -1.2V intensity / AU that peptide bends 0V towards the surface at 400 positive voltages, increasing the intensity of Raman 200 Phosphorylated tyrosine shifts. 0 Peptide bending is now measured with Raman Spectroscopy. 700 1100 1500 The detection relies on careful comparison of peak points Raman shift / cm-1 Wednesday, August 1, 2012
  • 10. Unphosphorylated Phosphorylated (a) 4 4 rho-EGIYGVLFKKKC-gold (i) (a) rho-EGIYGVLFKKKC-gold (i) dist Y-gold / nm EGIYGVLFKKKC-AU EGI(pY)GVLFKKKC-AU 3 Simulation dist Y-gold / nm 3 2 40 40 2 35 35 1 1 30 30 dist Tyr-Gold / A 0 dist Tyr-Gold / A 25 0 1 2 3 4 +60V 5 6 25 1 2 3 time / 4 ns -60V 5 6 20 20 time / ns 0V 15 15 4 +60V 4 (b) rho-EGI(pY)GVLFKKKC-gold (ii) 10 -60V 10 (b) rho-EGI(pY)GVLFKKKC-gold (ii) dist Y-gold / nm 3 dist Y-gold / nm 5 0V 5 3 (i) 2 (i) 0 0 0 1 2 3 4 5 6 0 12 2 3 4 5 6 1 time / ns time / ns (ii) 1 (ii) 0 1 2 3 4 5 6 0 1 2 time 3 / ns 4 5 6 time / ns Figure 4: Peptide phosphorylation revealed by molecular dynamics simulations. Panels Figure 4: Peptide phosphorylation revealed by surface for dynamicsvoltage polarities. Er the distance from the tyrosine residue to the gold molecular different simulations. Panels thestandard deviation. (a) Non-phosphorylated peptide sensor under +60 V (blue), -60 V ( ± distance from the tyrosine residue to the gold surface for different voltage polarities. Er ± standard deviation. (a) Non-phosphorylated peptide sensor under +60 (red) and -60 V ( biases. (b) Phosphorylated peptide sensor under +60 V (blue), -60 V V (blue), 0 volta biases. (b) Phosphorylated peptide peptides after+60 Vfor +60 V (i) and -60 V 0 volta (i) and (ii) show snapshots of two sensor under 5 ns (blue), -60 V (red) and (ii) vo (i) and (ii) show snapshots gray tubes. Rhodamine and for +60 V (i) and -60 V (ii) vo peptides are represented as of two peptides after 5 ns tyrosine residues are shown in bl peptides are represented as gray tubes. Rhodamine and tyrosine residues are shown in bl respectively. respectively. Wednesday, August 1, 2012
  • 11. Unphosphorylated Phosphorylated (a) 4 4 rho-EGIYGVLFKKKC-gold (i) (a) rho-EGIYGVLFKKKC-gold (i) dist Y-gold / nm EGIYGVLFKKKC-AU EGI(pY)GVLFKKKC-AU 3 Simulation dist Y-gold / nm 3 2 40 40 2 35 35 1 1 30 30 dist Tyr-Gold / A 0 dist Tyr-Gold / A 25 0 1 2 3 4 +60V 5 6 25 1 2 3 time / 4 ns -60V 5 6 20 20 time / ns 0V 15 15 4 +60V 4 (b) rho-EGI(pY)GVLFKKKC-gold (ii) 10 -60V 10 (b) rho-EGI(pY)GVLFKKKC-gold (ii) dist Y-gold / nm 3 dist Y-gold / nm 5 0V 5 3 (i) 2 (i) 0 0 0 1 2 3 4 5 6 0 12 2 3 4 5 6 1 time / ns time / ns (ii) 1 (ii) 0 1 2 3 4 5 6 Experiment 0 1 2 time 3 / ns 4 5 6 time / ns 800 Figure 4: Peptide phosphorylation revealed by molecular dynamics simulations. Panels 800 +1.2V Figure 4: Peptide phosphorylation revealed by surface for dynamicsvoltage polarities. Er the distance from the tyrosine residue to the gold molecular different simulations. Panels 600 -1.2V thestandard deviation. (a)+1.2V ± distance from the tyrosine residue to the gold surface for different +60 V (blue), -60 V ( Non-phosphorylated peptide sensor under voltage polarities. Er ± standard deviation. (a) -1.2V 600 biases. (b) Phosphorylated peptide sensor under +60 sensor under +60 (red) and -60 V ( Non-phosphorylated peptide V (blue), -60 V V (blue), 0 volta intensity / AU intensity / AU 0V biases. (b) Phosphorylated0V two peptides after+60 Vfor +60 V (i) and -60 V 0 volta (i) and (ii) show snapshots peptide sensor under 5 ns (blue), -60 V (red) and (ii) vo of 400 (i) and (ii) show snapshots gray tubes. Rhodamine and for +60 V (i) and -60 V (ii) vo peptides are represented as of two peptides after 5 ns tyrosine residues are shown in bl 400 peptides are represented as gray tubes. Rhodamine and tyrosine residues are shown in bl respectively. 200 respectively. 200 0 0 700 1100 1500 700 1100 1500 Raman shift / cm-1 Raman shift / cm-1 Wednesday, August 1, 2012
  • 12. dist Simulation-Optimized 1 Sequence 0 1 2 3 4 5 time / ns 4 4 (a) EGIYGVLAAAAC-gold (b) dist Y-gold / nm dist Y-gold / nm 3 3 2 2 EGI(pY)GVLAAAAC-gold 1 1 0 0 1 2 3 4 5 1 2 3 4 5 time / ns time / ns A new sequence is proposed from molecular dynamics simulations. There are dynamics simulations Figure 5: Optimized sequence. A new sequence is proposed from molecular no rhodamine caps, avoiding aggregation. Unnecessary lysineUnnecessary lysine residues (a), whileby alanine residu 4 is no rhodamine caps; avoiding aggregation. residueselectric field changed the phosphoryla non-phosphorylated peptide sensor is still insensitive to an are changed to alanine residues. The resulting non-phosphorylated peptide sensor is still distinctive raman signat (b) is responsive to an external electric field (b); therefore it should produce insensitive to an electric field, while the and 0 voltage Error bars represent is standard deviation. to an red an green r opposite voltage polarities. phosphorylated one ± responsive Color blue, t Y-gold / nm +60 V, -60 V biases. 3 external electric field; therefore the sensor should produce distinctive Raman signatures for opposite voltage polarities. Error bars represent standard deviation. Colors blue, red, and green represent +60 V, -60 V and 0 voltage biases. 2 EGI(pY)GVLAAAAC-gold Wednesday, August 1, 2012 16
  • 14. 14 Larger machines enable larger simulations BTRC for Macromolecular Modeling and Bioinformatics Beckman Institute, UIUC http://www.ks.uiuc.edu/ Wednesday, August 1, 2012
  • 15. Petascale Gateway to the Nation’s Top Computers Petascale computers (e.g., Blue Waters) will create ~100x larger datasets. The BTRC Petascale Gateway provides the necessary storage and analysis facilities all located in the BTRC area. 1-10 Gigabit Network External Visitor, Resources, 90% Researcher & of our Computer Developer Power Workstations Beckman Institute, UIUC RecentMacromolecular Modeling and Bioinformatics BTRC for http://www.ks.uiuc.edu/ Wednesday, August 1, 2012
  • 16. How NAMD Runs Efficiently on Large Parallel Computers Before Load Balancing: Much Idle CPU Time! 23,000 atoms on BlueGene/P 4K processor cores WHITE = 32 ns/day IDLE CPU TIME! 2.75 ms/step Percentage CPU Utilization Time BTRC for Macromolecular Modeling and Bioinformatics Beckman Institute, UIUC http://www.ks.uiuc.edu/ Wednesday, August 1, 2012
  • 17. After Load Balancing: Efficient Computing! 23,000 atoms on BlueGene/P 4K processor cores IDLE TIME REDUCED ~ 40% 63 ns/day 1.38 ms/step Percentage CPU Utilization Time BTRC for Macromolecular Modeling and Bioinformatics Beckman Institute, UIUC http://www.ks.uiuc.edu/ Wednesday, August 1, 2012
  • 18. 18 Computational Microscope on New Supercomputers 100M-atom performance on Jaguar and Blue Waters Jaguar BlueWaters Cray Jaguar XT5 (ORNL) 4.000 224,000 cores ns/day 3.000 2.000 BlueWaters XE6 (UIUC) 1.000 380,000 cores, 3000 GPUs 0 0 75000 150000 225000 300000 Number of Cores 1.50 CPU 12 cores CPU 12 cores + 1 GPU 1.13 CPU 12 cores + 2 GPU Tsubame CPU 12 cores + 3 GPU 0.75 ns/day Tokyo Institute of Tech. 4224 GPUs 0.38 0 50,000 registered users 64 128 256 512 700 BTRC for Macromolecular Modeling and Bioinformatics Beckman Institute, UIUC http://www.ks.uiuc.edu/ Number of Nodes Wednesday, August 1, 2012
  • 19. 19 1M Atom VirusGPU and CPU performanceGPU 1M-atom stmv on TitanDev GPU CPU 5 Single STMV PME every 4 steps ns/day 1 0.2 1 2 4 8 16 32 64 128 256 512 number of nodes BTRC for Macromolecular Modeling and Bioinformatics http://www.ks.uiuc.edu/ Beckman Institute, UIUC Wednesday, August 1, 2012
  • 20. 20 100M Atoms on TitanDev BTRC for Macromolecular Modeling and Bioinformatics Beckman Institute, UIUC http://www.ks.uiuc.edu/ Wednesday, August 1, 2012
  • 21. Advanced Computer Facilities and the Computational Microscope Illinois Petascale Computing Facility BTRC for Macromolecular Modeling and Bioinformatics Beckman Institute, UIUC http://www.ks.uiuc.edu/ Wednesday, August 1, 2012
  • 22. 2 Molecular Dynamics Flexible Fitting (MDFF) Method Electron microscopy X-ray crystallography MDFF APS at Argonne FEI microscope Acetyl – CoA Synthase L. Trabuco, E. Villa, K. Mitra, J. Frank, and K. Schulten. Flexible fitting of atomic structures into electron microscopy maps using molecular dynamics. Structure, 16:673-683, 2008. Wednesday, August 1, 2012
  • 23. 4 MDFF is young (2008), yet already successful Over 30 reports of MDFF applications: • By Group Researchers: Villa et al. PNAS (2009): EF-Tu ribosome complex Seidelt et al. Science (2009): TnaC ribosome translation stalling Becker et al. Science (2009): Sec61 ribosome complex Frauenfeld et al. Nat. Struct. Mol. Biol. (2011): SecYE ribosome complex   Agirrezabala et al. PNAS (2012): Ribosome translocation intermediates • By Outside Researchers: Lorenz et al. PNAS (2010): actin-myosin interface Bhushan et al. Nat. Struct. Mol. Biol. (2010): α-helical nascent chains Armache et al. PNAS (2011): Eukaryotic ribosomal proteins Armache et al. PNAS (2011): Translating eukaryotic ribosome Guo et al. PNAS (2011): RsgA GTPase on ribosomal subunit Becker et al. Nat. Struct. Mol. Biol. (2011) Dom34–Hbs1 stalled ribosome complex Wollmann et al. Nature (2011): Mot1–TBP complex Strunk et al. Science (2011): Ribosome assembly factors Lasker et al. PNAS (2012): Proteasome Becker et al. Nature (2012): Ribosome recycling complex MDFF derived ribosome structure Villa et al. PNAS 2009 Tightly integrated into NAMD and VMD • Capable of quickly fitting very large structures • Adaptable to a wide range of applications Wednesday, August 1, 2012
  • 24. Computation and Experiment in Virology 10 Collaboration with A. Gronenborn et al, U. Pittsburgh Molecular Dynamics Flexible Fitting of Tubular HIV Capsid: In the tubular geometry the capsid contains only hexameric subunits. EM fitted density structure view of hexameric subunit during MDFF final cross-correlation 0.96 Relaxation of capsid segment requires 13 million atom MD simulation on Blue Waters, 50 ns ns done Wednesday, August 1, 2012
  • 25. ed within a cone-shaped capsid assembled from ≈1500 copies of the viral capsid protein (CA) From Cylinder to HIV Capsid ous attempts have been made to model the HIV capsid as a fullerene cone composed of ≈250 examers and 12 CA-pentamers, either by self-assembling of coarse-grained models [28] or Replace hexameric units by pentameric units o-atomic models [29]; however, these models lack the atomic-level interactions that hold the d together. Collaboration with A. Gronenborn et al, U. Pittsburgh hexamers pentamer whole capsid made of e 3: million atoms of the hexameric form of thehexamers found in cylindrical assemblies 10 (A) All-atom model unit CA protein as and 12 pentamers V capsids in vitro. The model accurately captures the curvature of the tube. (B) CA pentame 60 million atoms nded by five CA hexamers. (C) Schlegel diagram for a fullerene end apex connected to a cylindrica of hexagonally linked carbon atoms. Wednesday, August 1, 2012
  • 26. Recent MDFF application: Intra-ring cooperation in group II chaperonins Collaboration with Fei Sun (Chinese Academy of Sciences) Zhang et al. Submitted. Mar 2012 Symmetry-restrained MDFF applied to 12 EM maps revealed role of electrostatic interaction in chaperonin hetero-oligomer formation EM Maps of Various Chaperonin Conformations 5 Wednesday, August 1, 2012
  • 27. Our Grand Ribosome Collaboration Joachim Frank Roland Beckmann Taekjip Ha Kurt Fredrick Ruben Gonzalez (Columbia U.) (U. Munich) (UIUC) (Ohio State U.) (Columbia U.) Cryo-EM Cryo-EM Single-molecule Mutagenesis Single-molecule FRET experiments FRET Structure (2008), Science (2009) x2, J. Mol. Bio. (2010), New collaborator New collaborator PNAS (2009), Nature Struct. 1 submitted Proteins (2011), Mol. Bio (2011), EMBO J. (2011), 1 submitted PNAS (2012) Wednesday, August 1, 2012
  • 28. Science 3: How Proteins AreMade from Genetic Blueprint Low-resolution data High-resolution structure Close-up of nascent protein Frauenfeld, Gumbart et al. Nat. Struct. Mol. Bio. 18, 614-621, 2011. Wednesday, August 1, 2012
  • 29. Molecular Dynamics Flexible Fitting (MDFF) Study of the Localization of Nascent Proteins 9 Ribosome expressing membrane protein James Gumbart 2.7 million atom simulation Ribosome-SecY-complex Frauenfeld, Gumbart et al. Nat. Struct. Mol. Bio. 18, 614-621, 2011. Wednesday, August 1, 2012
  • 30. Molecular Dynamics Flexible Fitting (MDFF) Study of the Localization of Nascent Proteins 9 Ribosome expressing Ribosome expressing a membrane protein cytosolic protein QM description of cation-π interaction between nascent chain and exit tunnel L.Trabuco, C. Harrison, E. Schreiner, and K. Schulten. Recognition of the regulatory nascent chain TnaC by the 2.7 million atom simulation ribosome. Structure, 18:627-637, 2010. Ribosome-Trigger Factor- Ribosome-SecY-complex complex Frauenfeld, Gumbart et al. Nat. Struct. Mol. Bio. 18, 614-621, 2011. Wednesday, August 1, 2012
  • 31. Structural characterization of mRNA-tRNA translocation intermediates X. Agirrezabala, H. Liao, E. Schreiner, J. Fu, R. Ortiz- Meoz, K. Schulten, R. Green, and J. Frank. PNAS 109:6094-6099, 2012. Wednesday, August 1, 2012
  • 32. Lots to be done! BTRC for Macromolecular Modeling and Bioinformatics Beckman Institute, UIUC http://www.ks.uiuc.edu/ Wednesday, August 1, 2012
  • 33. 17 Achievements Built on People 5 faculty members (2 physics, 1 chemistry, 1 biochemistry, 1 computer science); 8 developers; 1 system admin.; 16 post docs; 24 graduate students; 3 administrative staff L. Kale, J. Phillips: NAMD J. Frank, Columbia U.: MDFF, ribosome J. Stone, K. Vandivort: VMD R. Beckmann, U. Munich: ribosome I. Solov’yov, D. Chandler, M. W. Baumeister, MPI: whole cell imaging Sener, J. Strumpfer, J. Perilla, L. Liu, Greg Timp, UIUC, H. Gaub, U. Y. Liu, J. Gumbart, Y. Chan, X. Munich: biosensors; N. Hunter, Sheffield: Zou, E. Cruz-Chu: Science Proj.photosynthesis;. BTRC for Macromolecular Modeling and Bioinformatics Beckman Institute, UIUC http://www.ks.uiuc.edu/ Wednesday, August 1, 2012