SlideShare una empresa de Scribd logo
1 de 20
Blake Taylor                                                                                                                                                                         Austin Board of REALTORS
                                                                             Median Sold Price by Month
                                                                   Dec-08 vs. Dec-10: The median sold price is down 2%


                                                                                  Dec-08 vs. Dec-10
                   Dec-08                                           Dec-10                                         Change                                              %
                   287,000                                          280,250                                         -6,750                                            -2%


MLS: ACTRIS        Period:   2 years (monthly)           Price:   All                        Construction Type:    All            Bedrooms:    All             Bathrooms:      All         Lot Size: All
Property Types:    Residential: (House, Condo, Townhouse, Manufactured, Half Duplex, Mobile Home, Loft, Residential - Unknown)                                                             Sq Ft:    All
MLS Areas:         4


Clarus MarketMetrics®                                                                                     1 of 2                                                                                           01/18/2011
                                                 Information not guaranteed. © 2009-2010 Terradatum and its suppliers and licensors (www.terradatum.com/about/licensors.td).


                  www.TaylorRealEstateAustin.com | www.EarlyBirdAustin.com | Direct: 512.796.4447 | Fax: 512.628.7720 | 1701 Spyglass Dr. Ste. 8 Austin, TX 78746
                                                                                                         1 of 20
Blake Taylor                                                                                                                                                         Austin Board of REALTORS
                                                                   Median Sold Price by Month
                                                          Dec-08 vs. Dec-10: The median sold price is down 2%


Time Period             Median Price            # Units       Average DOM
Dec-10                      280,250                  20                    89
Nov-10                      375,000                  18                   118
Oct-10                      366,250                  16                    60
Sep-10                      292,350                  21                   109
Aug-10                      269,750                  28                    63
Jul-10                      298,250                  22                    67
Jun-10                      282,000                  41                    74
May-10                      322,000                  32                   103
Apr-10                      287,000                  30                    46
Mar-10                      325,402                  23                    94
Feb-10                      299,000                  13                    79
Jan-10                      342,500                   7                   101
Dec-09                      250,100                  20                   109
Nov-09                      258,500                  26                    55
Oct-09                      280,500                  24                    74
Sep-09                      322,500                  37                    80
Aug-09                      362,000                  17                    84
Jul-09                      300,500                  44                    76
Jun-09                      297,500                  38                    68
May-09                      320,000                  23                    77
Apr-09                      279,000                  30                    62
Mar-09                      317,000                  18                    89
Feb-09                      280,000                  19                    92
Jan-09                      339,000                   7                    55
Dec-08                      287,000                  17                    84


Clarus MarketMetrics®                                                                           2 of 2                                                                                01/18/2011
                                       Information not guaranteed. © 2009-2010 Terradatum and its suppliers and licensors (www.terradatum.com/about/licensors.td).


              www.TaylorRealEstateAustin.com | www.EarlyBirdAustin.com | Direct: 512.796.4447 | Fax: 512.628.7720 | 1701 Spyglass Dr. Ste. 8 Austin, TX 78746
                                                                                                     2 of 20
Blake Taylor                                                                                                                                                                          Austin Board of REALTORS
                                                                          Median For Sale vs. Median Sold
         Dec-08 vs. Dec-10: The median price of for sale properties is down 16% and the median price of sold properties is down 2%


                             Dec-08 vs. Dec-10                                                                                                                       Dec-08 vs. Dec-10
    Dec-08              Dec-10                Change                       %                                                                    Dec-08             Dec-10                Change              %
    345,000             289,000               -56,000                    -16%                                                                   287,000            280,250                -6,750            -2%


MLS: ACTRIS        Period:    2 years (monthly)           Price:   All                        Construction Type:    All             Bedrooms:    All            Bathrooms:      All         Lot Size: All
Property Types:    Residential: (House, Condo, Townhouse, Manufactured, Half Duplex, Mobile Home, Loft, Residential - Unknown)                                                              Sq Ft:    All
MLS Areas:         4


Clarus MarketMetrics®                                                                                      1 of 2                                                                                            01/18/2011
                                                  Information not guaranteed. © 2009-2010 Terradatum and its suppliers and licensors (www.terradatum.com/about/licensors.td).


                  www.TaylorRealEstateAustin.com | www.EarlyBirdAustin.com | Direct: 512.796.4447 | Fax: 512.628.7720 | 1701 Spyglass Dr. Ste. 8 Austin, TX 78746
                                                                                                         3 of 20
Blake Taylor                                                                                                                                                          Austin Board of REALTORS
                                                              Median For Sale vs. Median Sold
         Dec-08 vs. Dec-10: The median price of for sale properties is down 16% and the median price of sold properties is down 2%

                             For Sale                # Properties                         Sold                 # Properties                        Price
Time Period                   Median                     For Sale                       Median                        Sold                    Difference
Dec-10                       289,000                            190                    280,250                            20                       -8,750
Nov-10                       299,000                            229                    375,000                            18                      76,000
Oct-10                       295,000                            253                    366,250                            16                      71,250
Sep-10                       299,814                            263                    292,350                            21                       -7,464
Aug-10                       299,000                            294                    269,750                            28                     -29,250
Jul-10                       299,000                            300                    298,250                            22                         -750
Jun-10                       298,700                            309                    282,000                            41                     -16,700
May-10                       315,000                            299                    322,000                            32                       7,000
Apr-10                       315,000                            286                    287,000                            30                     -28,000
Mar-10                       315,000                            268                    325,402                            23                      10,402
Feb-10                       327,000                            224                    299,000                            13                     -28,000
Jan-10                       329,450                            194                    342,500                              7                     13,050
Dec-09                       326,250                            190                    250,100                            20                     -76,150
Nov-09                       324,950                            210                    258,500                            26                     -66,450
Oct-09                       327,500                            221                    280,500                            24                     -47,000
Sep-09                       345,000                            247                    322,500                            37                     -22,500
Aug-09                       319,950                            290                    362,000                            17                      42,050
Jul-09                       310,450                            278                    300,500                            44                       -9,950
Jun-09                       329,900                            281                    297,500                            38                     -32,400
May-09                       344,950                            268                    320,000                            23                     -24,950
Apr-09                       345,000                            271                    279,000                            30                     -66,000
Mar-09                       349,700                            254                    317,000                            18                     -32,700
Feb-09                       350,000                            207                    280,000                            19                     -70,000
Jan-09                       349,900                            222                    339,000                              7                    -10,900
Dec-08                       345,000                            229                    287,000                            17                     -58,000


Clarus MarketMetrics®                                                                            2 of 2                                                                                01/18/2011
                                        Information not guaranteed. © 2009-2010 Terradatum and its suppliers and licensors (www.terradatum.com/about/licensors.td).


              www.TaylorRealEstateAustin.com | www.EarlyBirdAustin.com | Direct: 512.796.4447 | Fax: 512.628.7720 | 1701 Spyglass Dr. Ste. 8 Austin, TX 78746
                                                                                                     4 of 20
Blake Taylor                                                                                                                                                                         Austin Board of REALTORS
                                                                                 Sold Properties by Month
                                                             Dec-08 vs. Dec-10: The number of Sold properties is up 18%


                                                                                  Dec-08 vs. Dec-10
                   Dec-08                                               Dec-10                                     Change                                             %
                     17                                                   20                                         3                                               +18%


MLS: ACTRIS        Period:   2 years (monthly)           Price:   All                        Construction Type:    All             Bedrooms:    All            Bathrooms:      All         Lot Size: All
Property Types:    Residential: (House, Condo, Townhouse, Manufactured, Half Duplex, Mobile Home, Loft, Residential - Unknown)                                                             Sq Ft:    All
MLS Areas:         4


Clarus MarketMetrics®                                                                                     1 of 2                                                                                           01/18/2011
                                                 Information not guaranteed. © 2009-2010 Terradatum and its suppliers and licensors (www.terradatum.com/about/licensors.td).


                  www.TaylorRealEstateAustin.com | www.EarlyBirdAustin.com | Direct: 512.796.4447 | Fax: 512.628.7720 | 1701 Spyglass Dr. Ste. 8 Austin, TX 78746
                                                                                                         5 of 20
Blake Taylor                                                                                                                                                          Austin Board of REALTORS
                                                                       Sold Properties by Month
                                                    Dec-08 vs. Dec-10: The number of Sold properties is up 18%


                                       Full Market                                                Bank Properties                                            Non-Bank Properties
Time Period             # Properties      Median Price         Average DOM              # Properties         % Bank            Median Price           # Properties    % Non-Bank   Median Price
Dec-10                           20             280,250                     89                      3            15.0               195,000                      17         85.0       287,000
Nov-10                           18             375,000                    118                      1             5.6               476,000                      17         94.4       365,000
Oct-10                           16             366,250                     60                      0                                                            16        100.0       366,250
Sep-10                           21             292,350                    109                      0                                                            21        100.0       292,350
Aug-10                           28             269,750                     63                      0                                                            28        100.0       269,750
Jul-10                           22             298,250                     67                      1             4.5               280,000                      21         95.5       301,500
Jun-10                           41             282,000                     74                      1             2.4               233,200                      40         97.6       288,350
May-10                           32             322,000                    103                      0                                                            32        100.0       322,000
Apr-10                           30             287,000                     46                      1             3.3               204,900                      29         96.7       299,000
Mar-10                           23             325,402                     94                      2             8.7               285,000                      21         91.3       325,402
Feb-10                           13             299,000                     79                      2            15.4               243,000                      11         84.6       299,000
Jan-10                            7             342,500                    101                      0                                                             7        100.0       342,500
Dec-09                           20             250,100                    109                      0                                                            20        100.0       250,100
Nov-09                           26             258,500                     55                      0                                                            26        100.0       258,500
Oct-09                           24             280,500                     74                      0                                                            24        100.0       280,500
Sep-09                           37             322,500                     80                      0                                                            37        100.0       322,500
Aug-09                           17             362,000                     84                      0                                                            17        100.0       362,000
Jul-09                           44             300,500                     76                      0                                                            44        100.0       300,500
Jun-09                           38             297,500                     68                      3             7.9               205,000                      35         92.1       302,000
May-09                           23             320,000                     77                      1             4.3               290,000                      22         95.7       321,000
Apr-09                           30             279,000                     62                      0                                                            30        100.0       279,000
Mar-09                           18             317,000                     89                      1             5.6               194,000                      17         94.4       319,000
Feb-09                           19             280,000                     92                      0                                                            19        100.0       280,000
Jan-09                            7             339,000                     55                      0                                                             7        100.0       339,000
Dec-08                           17             287,000                     84                      0                                                            17        100.0       287,000


Clarus MarketMetrics®                                                                            2 of 2                                                                                  01/18/2011
                                        Information not guaranteed. © 2009-2010 Terradatum and its suppliers and licensors (www.terradatum.com/about/licensors.td).


              www.TaylorRealEstateAustin.com | www.EarlyBirdAustin.com | Direct: 512.796.4447 | Fax: 512.628.7720 | 1701 Spyglass Dr. Ste. 8 Austin, TX 78746
                                                                                                     6 of 20
Blake Taylor                                                                                                                                                                         Austin Board of REALTORS
                                                                    Under Contract Properties by Month
                                                    Dec-08 vs. Dec-10: The number of Under Contract properties is up 200%


                                                                                  Dec-08 vs. Dec-10
                   Dec-08                                               Dec-10                                     Change                                             %
                     6                                                    18                                         12                                             +200%


MLS: ACTRIS        Period:   2 years (monthly)           Price:   All                        Construction Type:    All             Bedrooms:    All            Bathrooms:      All         Lot Size: All
Property Types:    Residential: (House, Condo, Townhouse, Manufactured, Half Duplex, Mobile Home, Loft, Residential - Unknown)                                                             Sq Ft:    All
MLS Areas:         4


Clarus MarketMetrics®                                                                                     1 of 2                                                                                           01/18/2011
                                                 Information not guaranteed. © 2009-2010 Terradatum and its suppliers and licensors (www.terradatum.com/about/licensors.td).


                  www.TaylorRealEstateAustin.com | www.EarlyBirdAustin.com | Direct: 512.796.4447 | Fax: 512.628.7720 | 1701 Spyglass Dr. Ste. 8 Austin, TX 78746
                                                                                                         7 of 20
Blake Taylor                                                                                                                                                          Austin Board of REALTORS
                                                          Under Contract Properties by Month
                                          Dec-08 vs. Dec-10: The number of Under Contract properties is up 200%


                                       Full Market                                                Bank Properties                                            Non-Bank Properties
Time Period             # Properties      Median Price         Average DOM              # Properties         % Bank            Median Price           # Properties    % Non-Bank   Median Price
Dec-10                           18             271,450                     68                      1             5.6               220,900                      17         94.4       274,900
Nov-10                           20             341,000                     78                      3            15.0               425,900                      17         85.0       339,000
Oct-10                           21             360,000                    107                      2             9.5               272,500                      19         90.5       369,500
Sep-10                           11             375,000                     63                      0                                                            11        100.0       375,000
Aug-10                           25             298,000                     97                      0                                                            25        100.0       298,000
Jul-10                           18             299,000                     60                      0                                                            18        100.0       299,000
Jun-10                           29             307,900                     70                      1             3.5               298,700                      28         96.5       308,950
May-10                           24             297,260                     56                      0                                                            24        100.0       297,260
Apr-10                           41             325,000                     96                      0                                                            41        100.0       325,000
Mar-10                           40             279,700                     56                      2             5.0               189,900                      38         95.0       304,900
Feb-10                           20             339,450                     77                      2            10.0               340,000                      18         90.0       339,450
Jan-10                           14             304,000                     77                      1             7.1               149,900                      13         92.9       309,000
Dec-09                           10             338,500                    167                      1            10.0               355,000                       9         90.0       327,500
Nov-09                           19             274,500                    114                      0                                                            19        100.0       274,500
Oct-09                           24             264,800                     53                      0                                                            24        100.0       264,800
Sep-09                           25             300,000                     83                      0                                                            25        100.0       300,000
Aug-09                           38             335,000                     65                      0                                                            38        100.0       335,000
Jul-09                           23             349,500                     75                      0                                                            23        100.0       349,500
Jun-09                           29             299,900                     72                      0                                                            29        100.0       299,900
May-09                           39             295,000                     75                      2             5.1               219,950                      37         94.9       309,000
Apr-09                           34             299,700                     77                      1             2.9               489,000                      33         97.1       299,500
Mar-09                           28             358,700                     73                      0                                                            28        100.0       358,700
Feb-09                           15             307,500                     79                      2            13.3               242,250                      13         86.7       324,675
Jan-09                           21             289,900                     90                      0                                                            21        100.0       289,900
Dec-08                            6             272,500                     46                      0                                                             6        100.0       272,500


Clarus MarketMetrics®                                                                            2 of 2                                                                                  01/18/2011
                                        Information not guaranteed. © 2009-2010 Terradatum and its suppliers and licensors (www.terradatum.com/about/licensors.td).


              www.TaylorRealEstateAustin.com | www.EarlyBirdAustin.com | Direct: 512.796.4447 | Fax: 512.628.7720 | 1701 Spyglass Dr. Ste. 8 Austin, TX 78746
                                                                                                     8 of 20
Blake Taylor                                                                                                                                                                         Austin Board of REALTORS
                                                                                 New Properties by Month
                                                           Dec-08 vs. Dec-10: The number of New properties is down 44%


                                                                                  Dec-08 vs. Dec-10
                   Dec-08                                               Dec-10                                     Change                                               %
                     32                                                   18                                         -14                                              -44%


MLS: ACTRIS        Period:   2 years (monthly)           Price:   All                        Construction Type:    All             Bedrooms:    All            Bathrooms:      All         Lot Size: All
Property Types:    Residential: (House, Condo, Townhouse, Manufactured, Half Duplex, Mobile Home, Loft, Residential - Unknown)                                                             Sq Ft:    All
MLS Areas:         4


Clarus MarketMetrics®                                                                                     1 of 2                                                                                           01/18/2011
                                                 Information not guaranteed. © 2009-2010 Terradatum and its suppliers and licensors (www.terradatum.com/about/licensors.td).


                  www.TaylorRealEstateAustin.com | www.EarlyBirdAustin.com | Direct: 512.796.4447 | Fax: 512.628.7720 | 1701 Spyglass Dr. Ste. 8 Austin, TX 78746
                                                                                                         9 of 20
Blake Taylor                                                                                                                                                         Austin Board of REALTORS
                                                                      New Properties by Month
                                                 Dec-08 vs. Dec-10: The number of New properties is down 44%


                            Full Market                                   Bank Properties                                             Non-Bank Properties
Time Period             # Properties     Median Price            # Properties         % Bank              Median Price         # Properties       % Non-Bank          Median Price
Dec-10                           18            283,650                       2            11.1                188,950                     16               88.9           296,150
Nov-10                           39            285,000                       1             2.6                197,900                     38               97.4           285,000
Oct-10                           42            232,900                       0                                                            42             100.0            232,900
Sep-10                           48            302,500                       5            10.4                360,000                     43               89.6           295,000
Aug-10                           55            290,000                       0                                                            55             100.0            290,000
Jul-10                           50            314,450                       1             2.0                275,000                     49               98.0           319,000
Jun-10                           61            260,000                       4             6.6                209,900                     57               93.4           274,500
May-10                           71            339,900                       4             5.6                339,900                     67               94.4           340,000
Apr-10                           78            289,900                       0                                                            78             100.0            289,900
Mar-10                           82            312,500                       1             1.2                175,000                     81               98.8           315,000
Feb-10                           65            274,900                       1             1.5                204,900                     64               98.5           276,950
Jan-10                           50            331,950                       1             2.0                420,000                     49               98.0           329,900
Dec-09                           27            349,000                       3            11.1                229,000                     24               88.9           349,450
Nov-09                           37            274,900                       1             2.7                149,900                     36               97.3           284,950
Oct-09                           33            325,000                       2             6.1                247,500                     31               93.9           329,900
Sep-09                           46            354,450                       0                                                            46             100.0            354,450
Aug-09                           66            359,950                       0                                                            66             100.0            359,950
Jul-09                           58            275,450                       0                                                            58             100.0            275,450
Jun-09                           84            303,357                       0                                                            84             100.0            303,357
May-09                           58            299,735                       2             3.5                244,950                     56               96.5           304,450
Apr-09                           72            311,525                       1             1.4                355,000                     71               98.6           299,500
Mar-09                           78            338,250                       0                                                            78             100.0            338,250
Feb-09                           44            327,288                       1             2.3                489,000                     43               97.7           324,675
Jan-09                           45            335,000                       2             4.4                252,500                     43               95.6           335,900
Dec-08                           32            334,950                       1             3.1                455,555                     31               96.9           324,900


Clarus MarketMetrics®                                                                            2 of 2                                                                               01/18/2011
                                       Information not guaranteed. © 2009-2010 Terradatum and its suppliers and licensors (www.terradatum.com/about/licensors.td).


              www.TaylorRealEstateAustin.com | www.EarlyBirdAustin.com | Direct: 512.796.4447 | Fax: 512.628.7720 | 1701 Spyglass Dr. Ste. 8 Austin, TX 78746
                                                                                                     10 of 20
Blake Taylor                                                                                                                                                                         Austin Board of REALTORS
                                                                            For Sale Properties by Month
                                                        Dec-08 vs. Dec-10: The number of For Sale properties is down 17%


                                                                                  Dec-08 vs. Dec-10
                   Dec-08                                               Dec-10                                     Change                                               %
                    229                                                  190                                         -39                                              -17%


MLS: ACTRIS        Period:   2 years (monthly)           Price:   All                        Construction Type:    All             Bedrooms:    All            Bathrooms:      All         Lot Size: All
Property Types:    Residential: (House, Condo, Townhouse, Manufactured, Half Duplex, Mobile Home, Loft, Residential - Unknown)                                                             Sq Ft:    All
MLS Areas:         4


Clarus MarketMetrics®                                                                                     1 of 2                                                                                           01/18/2011
                                                 Information not guaranteed. © 2009-2010 Terradatum and its suppliers and licensors (www.terradatum.com/about/licensors.td).


                  www.TaylorRealEstateAustin.com | www.EarlyBirdAustin.com | Direct: 512.796.4447 | Fax: 512.628.7720 | 1701 Spyglass Dr. Ste. 8 Austin, TX 78746
                                                                                                         11 of 20
Blake Taylor                                                                                                                                                          Austin Board of REALTORS
                                                                  For Sale Properties by Month
                                               Dec-08 vs. Dec-10: The number of For Sale properties is down 17%


                                       Full Market                                                Bank Properties                                            Non-Bank Properties
Time Period             # Properties      Median Price         Average DOM              # Properties         % Bank            Median Price           # Properties    % Non-Bank   Median Price
Dec-10                          190             289,000                    141                      7             3.7               220,900                     183         96.3       290,000
Nov-10                          229             299,000                    142                      9             3.9               324,900                     220         96.1       297,000
Oct-10                          253             295,000                    149                     11             4.3               339,900                     242         95.7       290,000
Sep-10                          263             299,814                    156                     12             4.6               332,400                     251         95.4       299,000
Aug-10                          294             299,000                    157                      9             3.1               275,000                     285         96.9       299,000
Jul-10                          300             299,000                    155                      9             3.0               275,000                     291         97.0       299,000
Jun-10                          309             298,700                    153                     10             3.2               263,850                     299         96.8       299,000
May-10                          299             315,000                    156                      7             2.3               339,900                     292         97.7       312,500
Apr-10                          286             315,000                    157                      3             1.1               229,000                     283         99.0       315,000
Mar-10                          268             315,000                    159                      6             2.2               216,950                     262         97.8       318,388
Feb-10                          224             327,000                    175                      8             3.6               247,500                     216         96.4       329,900
Jan-10                          194             329,450                    187                      8             4.1               247,500                     186         95.9       329,900
Dec-09                          190             326,250                    188                      8             4.2               247,500                     182         95.8       329,900
Nov-09                          210             324,950                    184                      5             2.4               260,000                     205         97.6       325,000
Oct-09                          221             327,500                    177                      4             1.8               260,000                     217         98.2       329,900
Sep-09                          247             345,000                    173                      2             0.8               307,500                     245         99.2       345,000
Aug-09                          290             319,950                    156                      2             0.7               307,500                     288         99.3       319,950
Jul-09                          278             310,450                    154                      2             0.7               307,500                     276         99.3       310,450
Jun-09                          281             329,900                    152                      2             0.7               307,500                     279         99.3       329,900
May-09                          268             344,950                    153                      4             1.5               244,950                     264         98.5       345,000
Apr-09                          271             345,000                    159                      4             1.5               405,278                     267         98.5       345,000
Mar-09                          254             349,700                    159                      3             1.2               455,555                     251         98.8       349,500
Feb-09                          207             350,000                    175                      5             2.4               295,000                     202         97.6       352,500
Jan-09                          222             349,900                    178                      5             2.2               295,000                     217         97.8       350,000
Dec-08                          229             345,000                    180                      3             1.3               339,000                     226         98.7       347,250


Clarus MarketMetrics®                                                                            2 of 2                                                                                  01/18/2011
                                        Information not guaranteed. © 2009-2010 Terradatum and its suppliers and licensors (www.terradatum.com/about/licensors.td).


              www.TaylorRealEstateAustin.com | www.EarlyBirdAustin.com | Direct: 512.796.4447 | Fax: 512.628.7720 | 1701 Spyglass Dr. Ste. 8 Austin, TX 78746
                                                                                                     12 of 20
Blake Taylor                                                                                                                                                                         Austin Board of REALTORS
                                                                            Expired Properties by Month
                                                        Dec-08 vs. Dec-10: The number of Expired properties is down 13%


                                                                                  Dec-08 vs. Dec-10
                   Dec-08                                               Dec-10                                     Change                                               %
                     46                                                   40                                         -6                                               -13%


MLS: ACTRIS        Period:   2 years (monthly)           Price:   All                        Construction Type:    All             Bedrooms:    All            Bathrooms:      All         Lot Size: All
Property Types:    Residential: (House, Condo, Townhouse, Manufactured, Half Duplex, Mobile Home, Loft, Residential - Unknown)                                                             Sq Ft:    All
MLS Areas:         4


Clarus MarketMetrics®                                                                                     1 of 2                                                                                           01/18/2011
                                                 Information not guaranteed. © 2009-2010 Terradatum and its suppliers and licensors (www.terradatum.com/about/licensors.td).


                  www.TaylorRealEstateAustin.com | www.EarlyBirdAustin.com | Direct: 512.796.4447 | Fax: 512.628.7720 | 1701 Spyglass Dr. Ste. 8 Austin, TX 78746
                                                                                                         13 of 20
Blake Taylor                                                                                                                                                          Austin Board of REALTORS
                                                                   Expired Properties by Month
                                               Dec-08 vs. Dec-10: The number of Expired properties is down 13%


                                       Full Market                                                Bank Properties                                            Non-Bank Properties
Time Period             # Properties      Median Price         Average DOM             # Properties          % Bank           Median Price           # Properties     % Non-Bank   Median Price
Dec-10                           40             289,500                    134                      2             5.0               307,450                      38         95.0       289,500
Nov-10                           37             319,000                    129                      1             2.7               339,900                      36         97.3       309,000
Oct-10                           42             245,000                    117                      1             2.4               339,900                      41         97.6       240,000
Sep-10                           41             289,100                    134                      1             2.4               219,900                      40         97.6       294,050
Aug-10                           54             298,000                    117                      2             3.7               214,450                      52         96.3       304,500
Jul-10                           43             259,000                    104                      0                                                            43        100.0       259,000
Jun-10                           30             324,000                    127                      1             3.3               175,000                      29         96.7       349,000
May-10                           27             399,000                    136                      1             3.7               500,000                      26         96.3       387,000
Apr-10                           17             389,000                     96                      0                                                            17        100.0       389,000
Mar-10                           20             267,450                    137                      1             5.0               260,000                      19         95.0       274,900
Feb-10                           18             320,000                    170                      1             5.6               235,000                      17         94.4       345,000
Jan-10                           21             290,000                    150                      0                                                            21        100.0       290,000
Dec-09                           36             332,488                     88                      0                                                            36        100.0       332,488
Nov-09                           28             328,400                    149                      0                                                            28        100.0       328,400
Oct-09                           24             382,500                    146                      0                                                            24        100.0       382,500
Sep-09                           34             398,500                    146                      0                                                            34        100.0       398,500
Aug-09                           51             270,000                    101                      0                                                            51        100.0       270,000
Jul-09                           31             289,000                    105                      0                                                            31        100.0       289,000
Jun-09                           32             349,000                     87                      0                                                            32        100.0       349,000
May-09                           32             347,000                    100                      0                                                            32        100.0       347,000
Apr-09                           27             369,000                    143                      1             3.7               455,555                      26         96.3       352,450
Mar-09                           27             335,000                    113                      0                                                            27        100.0       335,000
Feb-09                           16             332,400                     72                      0                                                            16        100.0       332,400
Jan-09                           38             379,425                    134                      1             2.6               339,000                      37         97.4       399,850
Dec-08                           46             332,450                    129                      0                                                            46        100.0       332,450


Clarus MarketMetrics®                                                                            2 of 2                                                                                   01/18/2011
                                        Information not guaranteed. © 2009-2010 Terradatum and its suppliers and licensors (www.terradatum.com/about/licensors.td).


              www.TaylorRealEstateAustin.com | www.EarlyBirdAustin.com | Direct: 512.796.4447 | Fax: 512.628.7720 | 1701 Spyglass Dr. Ste. 8 Austin, TX 78746
                                                                                                     14 of 20
Blake Taylor                                                                                                                                                                          Austin Board of REALTORS
                                                                                Supply & Demand by Month
                   Dec-08 vs. Dec-10: The number of for sale properties is down 17% and the number of sold properties is up 18%


                             Dec-08 vs. Dec-10                                                                                                                       Dec-08 vs. Dec-10
     Dec-08             Dec-10                Change                       %                                                                    Dec-08              Dec-10               Change              %
      229                190                    -39                      -17%                                                                     17                  20                   3                +18%


MLS: ACTRIS        Period:    2 years (monthly)           Price:   All                        Construction Type:    All             Bedrooms:    All            Bathrooms:      All         Lot Size: All
Property Types:    Residential: (House, Condo, Townhouse, Manufactured, Half Duplex, Mobile Home, Loft, Residential - Unknown)                                                              Sq Ft:    All
MLS Areas:         4


Clarus MarketMetrics®                                                                                      1 of 2                                                                                            01/18/2011
                                                  Information not guaranteed. © 2009-2010 Terradatum and its suppliers and licensors (www.terradatum.com/about/licensors.td).


                  www.TaylorRealEstateAustin.com | www.EarlyBirdAustin.com | Direct: 512.796.4447 | Fax: 512.628.7720 | 1701 Spyglass Dr. Ste. 8 Austin, TX 78746
                                                                                                         15 of 20
Blake Taylor                                                                                                                                                           Austin Board of REALTORS
                                                                     Supply & Demand by Month
                Dec-08 vs. Dec-10: The number of for sale properties is down 17% and the number of sold properties is up 18%

                          # Properties              Average DOM                    # Properties               Average DOM
Time Period                   For Sale                   For Sale                         Sold                        Sold
Dec-10                            190                            141                           20                          89
Nov-10                            229                            142                           18                         118
Oct-10                            253                            149                           16                          60
Sep-10                            263                            156                           21                         109
Aug-10                            294                            157                           28                          63
Jul-10                            300                            155                           22                          67
Jun-10                            309                            153                           41                          74
May-10                            299                            156                           32                         103
Apr-10                            286                            157                           30                          46
Mar-10                            268                            159                           23                          94
Feb-10                            224                            175                           13                          79
Jan-10                            194                            187                            7                         101
Dec-09                            190                            188                           20                         109
Nov-09                            210                            184                           26                          55
Oct-09                            221                            177                           24                          74
Sep-09                            247                            173                           37                          80
Aug-09                            290                            156                           17                          84
Jul-09                            278                            154                           44                          76
Jun-09                            281                            152                           38                          68
May-09                            268                            153                           23                          77
Apr-09                            271                            159                           30                          62
Mar-09                            254                            159                           18                          89
Feb-09                            207                            175                           19                          92
Jan-09                            222                            178                            7                          55
Dec-08                            229                            180                           17                          84


Clarus MarketMetrics®                                                                               2 of 2                                                                              01/18/2011
                                         Information not guaranteed. © 2009-2010 Terradatum and its suppliers and licensors (www.terradatum.com/about/licensors.td).


              www.TaylorRealEstateAustin.com | www.EarlyBirdAustin.com | Direct: 512.796.4447 | Fax: 512.628.7720 | 1701 Spyglass Dr. Ste. 8 Austin, TX 78746
                                                                                                     16 of 20
Blake Taylor                                                                                                                                                                         Austin Board of REALTORS
                                                                  The Average Days on Market by Month
                                                               Dec-08 vs. Dec-10: The average days on market is up 46%


                                                                                  Dec-08 vs. Dec-10
                   Dec-08                                               Dec-10                                     Change                                             %
                     46                                                   68                                         21                                              +46%


MLS: ACTRIS        Period:   2 years (monthly)           Price:   All                        Construction Type:    All             Bedrooms:    All            Bathrooms:      All         Lot Size: All
Property Types:    Residential: (House, Condo, Townhouse, Manufactured, Half Duplex, Mobile Home, Loft, Residential - Unknown)                                                             Sq Ft:    All
MLS Areas:         4


Clarus MarketMetrics®                                                                                     1 of 2                                                                                           01/18/2011
                                                 Information not guaranteed. © 2009-2010 Terradatum and its suppliers and licensors (www.terradatum.com/about/licensors.td).


                  www.TaylorRealEstateAustin.com | www.EarlyBirdAustin.com | Direct: 512.796.4447 | Fax: 512.628.7720 | 1701 Spyglass Dr. Ste. 8 Austin, TX 78746
                                                                                                         17 of 20
Blake Taylor                                                                                                                                                        Austin Board of REALTORS
                                                     The Average Days on Market by Month
                                                    Dec-08 vs. Dec-10: The average days on market is up 46%


Time Period             Average DOM      # UC Units
Dec-10                           68                18
Nov-10                           78                20
Oct-10                          107                21
Sep-10                           63                11
Aug-10                           97                25
Jul-10                           60                18
Jun-10                           70                29
May-10                           56                24
Apr-10                           96                41
Mar-10                           56                40
Feb-10                           77                20
Jan-10                           77                14
Dec-09                          167                10
Nov-09                          114                19
Oct-09                           53                24
Sep-09                           83                25
Aug-09                           65                38
Jul-09                           75                23
Jun-09                           72                29
May-09                           75                39
Apr-09                           77                34
Mar-09                           73                28
Feb-09                           79                15
Jan-09                           90                21
Dec-08                           46                 6


Clarus MarketMetrics®                                                                          2 of 2                                                                                01/18/2011
                                      Information not guaranteed. © 2009-2010 Terradatum and its suppliers and licensors (www.terradatum.com/about/licensors.td).


              www.TaylorRealEstateAustin.com | www.EarlyBirdAustin.com | Direct: 512.796.4447 | Fax: 512.628.7720 | 1701 Spyglass Dr. Ste. 8 Austin, TX 78746
                                                                                                     18 of 20
Blake Taylor                                                                                                                                                                         Austin Board of REALTORS
                                                                             Months Supply of Inventory
                                                  Dec-08 vs. Dec-10: The average months supply of inventory is down 75%


                                                                                  Dec-08 vs. Dec-10
                   Dec-08                                               Dec-10                                     Change                                              %
                    29.5                                                 7.3                                        -22.2                                            -75%


MLS: ACTRIS        Period:   2 years (monthly)           Price:   All                        Construction Type:    All            Bedrooms:    All             Bathrooms:      All         Lot Size: All
Property Types:    Residential: (House, Condo, Townhouse, Manufactured, Half Duplex, Mobile Home, Loft, Residential - Unknown)                                                             Sq Ft:    All
MLS Areas:         4


Clarus MarketMetrics®                                                                                     1 of 2                                                                                           01/18/2011
                                                 Information not guaranteed. © 2009-2010 Terradatum and its suppliers and licensors (www.terradatum.com/about/licensors.td).


                  www.TaylorRealEstateAustin.com | www.EarlyBirdAustin.com | Direct: 512.796.4447 | Fax: 512.628.7720 | 1701 Spyglass Dr. Ste. 8 Austin, TX 78746
                                                                                                         19 of 20
Blake Taylor                                                                                                                                                               Austin Board of REALTORS
                                                                         Months Supply of Inventory
                                              Dec-08 vs. Dec-10: The average months supply of inventory is down 75%

                          # Units For Sale          # UC Units                                   UC Average
Time Period             Last Day of Month         During Month                      MSI                DOM
Dec-10                      132                                 18                   7.3                       68
Nov-10                      172                                 20                   8.6                       78
Oct-10                      190                                 21                   9.0                   107
Sep-10                      211                                 11                  19.2                       63
Aug-10                      215                                 25                   8.6                       97
Jul-10                      239                                 18                  13.3                       60
Jun-10                      250                                 29                   8.6                       70
May-10                      248                                 24                  10.3                       56
Apr-10                      228                                 41                   5.6                       96
Mar-10                      208                                 40                   5.2                       56
Feb-10                      186                                 20                   9.3                       77
Jan-10                      159                                 14                  11.4                       77
Dec-09                      144                                 10                  14.4                   167
Nov-09                      163                                 19                   8.6                   114
Oct-09                      173                                 24                   7.2                       53
Sep-09                      188                                 25                   7.5                       83
Aug-09                      201                                 38                   5.3                       65
Jul-09                      224                                 23                   9.7                       75
Jun-09                      220                                 29                   7.6                       72
May-09                      197                                 39                   5.1                       75
Apr-09                      210                                 34                   6.2                       77
Mar-09                      199                                 28                   7.1                       73
Feb-09                      176                                 15                  11.7                       79
Jan-09                      163                                 21                   7.8                       90
Dec-08                      177                                  6                  29.5                       46


Clarus MarketMetrics®                                                                                 2 of 2                                                                                01/18/2011
                                             Information not guaranteed. © 2009-2010 Terradatum and its suppliers and licensors (www.terradatum.com/about/licensors.td).


              www.TaylorRealEstateAustin.com | www.EarlyBirdAustin.com | Direct: 512.796.4447 | Fax: 512.628.7720 | 1701 Spyglass Dr. Ste. 8 Austin, TX 78746
                                                                                                     20 of 20

Más contenido relacionado

La actualidad más candente

2 n, scofield farms, gracy farms, quail creek, lamplight village metrics
2 n, scofield farms, gracy farms, quail creek, lamplight village metrics2 n, scofield farms, gracy farms, quail creek, lamplight village metrics
2 n, scofield farms, gracy farms, quail creek, lamplight village metricsTaylor Real Estate
 
Sww, circle c, western oaks, meridian, avana
Sww, circle c, western oaks, meridian, avanaSww, circle c, western oaks, meridian, avana
Sww, circle c, western oaks, meridian, avanaTaylor Real Estate
 
6,7, 78704, travis heights, bouldin creek, barton hills
6,7, 78704, travis heights, bouldin creek, barton hills6,7, 78704, travis heights, bouldin creek, barton hills
6,7, 78704, travis heights, bouldin creek, barton hillsTaylor Real Estate
 
Frisco TX - January 2011 - Housing Market Report
Frisco TX - January 2011 - Housing Market ReportFrisco TX - January 2011 - Housing Market Report
Frisco TX - January 2011 - Housing Market ReportValarie Littles
 
3, windsor park, delwood, mueller
3, windsor park, delwood, mueller3, windsor park, delwood, mueller
3, windsor park, delwood, muellerTaylor Real Estate
 
4, hyde park, rosedale metrics
4, hyde park, rosedale metrics4, hyde park, rosedale metrics
4, hyde park, rosedale metricsTaylor Real Estate
 
2, allandale, crestview, brentwood metrics
2, allandale, crestview, brentwood metrics2, allandale, crestview, brentwood metrics
2, allandale, crestview, brentwood metricsTaylor Real Estate
 
10 n, 10s, south austin metrics
10 n, 10s, south austin metrics10 n, 10s, south austin metrics
10 n, 10s, south austin metricsTaylor Real Estate
 

La actualidad más candente (20)

UT
UTUT
UT
 
Area 8e, 8w westlake
Area 8e, 8w   westlakeArea 8e, 8w   westlake
Area 8e, 8w westlake
 
2 n, scofield farms, gracy farms, quail creek, lamplight village metrics
2 n, scofield farms, gracy farms, quail creek, lamplight village metrics2 n, scofield farms, gracy farms, quail creek, lamplight village metrics
2 n, scofield farms, gracy farms, quail creek, lamplight village metrics
 
Area 5 east austin
Area 5   east austinArea 5   east austin
Area 5 east austin
 
Sww, circle c, western oaks, meridian, avana
Sww, circle c, western oaks, meridian, avanaSww, circle c, western oaks, meridian, avana
Sww, circle c, western oaks, meridian, avana
 
8 e, 8w, westlake metrics
8 e, 8w, westlake metrics8 e, 8w, westlake metrics
8 e, 8w, westlake metrics
 
Condos Only
Condos OnlyCondos Only
Condos Only
 
Ut metrics
Ut metricsUt metrics
Ut metrics
 
Dt, downtown austin metrics
Dt, downtown austin metricsDt, downtown austin metrics
Dt, downtown austin metrics
 
6,7, 78704, travis heights, bouldin creek, barton hills
6,7, 78704, travis heights, bouldin creek, barton hills6,7, 78704, travis heights, bouldin creek, barton hills
6,7, 78704, travis heights, bouldin creek, barton hills
 
5, east austin metrics
5, east austin metrics5, east austin metrics
5, east austin metrics
 
Frisco TX - January 2011 - Housing Market Report
Frisco TX - January 2011 - Housing Market ReportFrisco TX - January 2011 - Housing Market Report
Frisco TX - January 2011 - Housing Market Report
 
3, windsor park, delwood, mueller
3, windsor park, delwood, mueller3, windsor park, delwood, mueller
3, windsor park, delwood, mueller
 
1 n, jester, lakewood metrics
1 n, jester, lakewood metrics1 n, jester, lakewood metrics
1 n, jester, lakewood metrics
 
4, hyde park, rosedale metrics
4, hyde park, rosedale metrics4, hyde park, rosedale metrics
4, hyde park, rosedale metrics
 
W Metrics
W MetricsW Metrics
W Metrics
 
Ls, lakeway, bee cave metrics
Ls, lakeway, bee cave metricsLs, lakeway, bee cave metrics
Ls, lakeway, bee cave metrics
 
2, allandale, crestview, brentwood metrics
2, allandale, crestview, brentwood metrics2, allandale, crestview, brentwood metrics
2, allandale, crestview, brentwood metrics
 
Condos only metrics
Condos only metricsCondos only metrics
Condos only metrics
 
10 n, 10s, south austin metrics
10 n, 10s, south austin metrics10 n, 10s, south austin metrics
10 n, 10s, south austin metrics
 

Similar a Area 4 hyde park, shoal creek, rosedale

Windsor Park, Delwood, Mueller
Windsor Park, Delwood, MuellerWindsor Park, Delwood, Mueller
Windsor Park, Delwood, MuellerTaylor Real Estate
 
NW Hills, Highland Park Metrics
NW Hills, Highland Park MetricsNW Hills, Highland Park Metrics
NW Hills, Highland Park MetricsTaylor Real Estate
 
1 a, nw hills, highland park, cat mountain
1 a, nw hills, highland park, cat mountain1 a, nw hills, highland park, cat mountain
1 a, nw hills, highland park, cat mountainTaylor Real Estate
 
Rn, steiner ranch, river place metrics
Rn, steiner ranch, river place metricsRn, steiner ranch, river place metrics
Rn, steiner ranch, river place metricsTaylor Real Estate
 
Murphy TX - Housing Market Report - August 2010
Murphy TX - Housing Market Report - August 2010Murphy TX - Housing Market Report - August 2010
Murphy TX - Housing Market Report - August 2010Valarie Littles
 
Murphy TX - Housing Market Report - November 2010
Murphy TX - Housing Market Report - November 2010Murphy TX - Housing Market Report - November 2010
Murphy TX - Housing Market Report - November 2010Valarie Littles
 
Frisco TX - Housing Market Report - November 2010
Frisco TX - Housing Market Report - November 2010Frisco TX - Housing Market Report - November 2010
Frisco TX - Housing Market Report - November 2010Valarie Littles
 

Similar a Area 4 hyde park, shoal creek, rosedale (12)

Areas 10N, 10S South Austin
Areas 10N, 10S   South AustinAreas 10N, 10S   South Austin
Areas 10N, 10S South Austin
 
Central Austin Metrics
Central Austin MetricsCentral Austin Metrics
Central Austin Metrics
 
Windsor Park, Delwood, Mueller
Windsor Park, Delwood, MuellerWindsor Park, Delwood, Mueller
Windsor Park, Delwood, Mueller
 
Westlake Metrics
Westlake MetricsWestlake Metrics
Westlake Metrics
 
NW Hills, Highland Park Metrics
NW Hills, Highland Park MetricsNW Hills, Highland Park Metrics
NW Hills, Highland Park Metrics
 
Central austin metrics
Central austin metricsCentral austin metrics
Central austin metrics
 
1 b, old west austin metrics
1 b, old west austin metrics1 b, old west austin metrics
1 b, old west austin metrics
 
1 a, nw hills, highland park, cat mountain
1 a, nw hills, highland park, cat mountain1 a, nw hills, highland park, cat mountain
1 a, nw hills, highland park, cat mountain
 
Rn, steiner ranch, river place metrics
Rn, steiner ranch, river place metricsRn, steiner ranch, river place metrics
Rn, steiner ranch, river place metrics
 
Murphy TX - Housing Market Report - August 2010
Murphy TX - Housing Market Report - August 2010Murphy TX - Housing Market Report - August 2010
Murphy TX - Housing Market Report - August 2010
 
Murphy TX - Housing Market Report - November 2010
Murphy TX - Housing Market Report - November 2010Murphy TX - Housing Market Report - November 2010
Murphy TX - Housing Market Report - November 2010
 
Frisco TX - Housing Market Report - November 2010
Frisco TX - Housing Market Report - November 2010Frisco TX - Housing Market Report - November 2010
Frisco TX - Housing Market Report - November 2010
 

Último

MAHA Global and IPR: Do Actions Speak Louder Than Words?
MAHA Global and IPR: Do Actions Speak Louder Than Words?MAHA Global and IPR: Do Actions Speak Louder Than Words?
MAHA Global and IPR: Do Actions Speak Louder Than Words?Olivia Kresic
 
Pitch Deck Teardown: Geodesic.Life's $500k Pre-seed deck
Pitch Deck Teardown: Geodesic.Life's $500k Pre-seed deckPitch Deck Teardown: Geodesic.Life's $500k Pre-seed deck
Pitch Deck Teardown: Geodesic.Life's $500k Pre-seed deckHajeJanKamps
 
8447779800, Low rate Call girls in Tughlakabad Delhi NCR
8447779800, Low rate Call girls in Tughlakabad Delhi NCR8447779800, Low rate Call girls in Tughlakabad Delhi NCR
8447779800, Low rate Call girls in Tughlakabad Delhi NCRashishs7044
 
Future Of Sample Report 2024 | Redacted Version
Future Of Sample Report 2024 | Redacted VersionFuture Of Sample Report 2024 | Redacted Version
Future Of Sample Report 2024 | Redacted VersionMintel Group
 
Innovation Conference 5th March 2024.pdf
Innovation Conference 5th March 2024.pdfInnovation Conference 5th March 2024.pdf
Innovation Conference 5th March 2024.pdfrichard876048
 
Call US-88OO1O2216 Call Girls In Mahipalpur Female Escort Service
Call US-88OO1O2216 Call Girls In Mahipalpur Female Escort ServiceCall US-88OO1O2216 Call Girls In Mahipalpur Female Escort Service
Call US-88OO1O2216 Call Girls In Mahipalpur Female Escort Servicecallgirls2057
 
Marketplace and Quality Assurance Presentation - Vincent Chirchir
Marketplace and Quality Assurance Presentation - Vincent ChirchirMarketplace and Quality Assurance Presentation - Vincent Chirchir
Marketplace and Quality Assurance Presentation - Vincent Chirchirictsugar
 
Memorándum de Entendimiento (MoU) entre Codelco y SQM
Memorándum de Entendimiento (MoU) entre Codelco y SQMMemorándum de Entendimiento (MoU) entre Codelco y SQM
Memorándum de Entendimiento (MoU) entre Codelco y SQMVoces Mineras
 
Case study on tata clothing brand zudio in detail
Case study on tata clothing brand zudio in detailCase study on tata clothing brand zudio in detail
Case study on tata clothing brand zudio in detailAriel592675
 
Organizational Structure Running A Successful Business
Organizational Structure Running A Successful BusinessOrganizational Structure Running A Successful Business
Organizational Structure Running A Successful BusinessSeta Wicaksana
 
Ten Organizational Design Models to align structure and operations to busines...
Ten Organizational Design Models to align structure and operations to busines...Ten Organizational Design Models to align structure and operations to busines...
Ten Organizational Design Models to align structure and operations to busines...Seta Wicaksana
 
8447779800, Low rate Call girls in Shivaji Enclave Delhi NCR
8447779800, Low rate Call girls in Shivaji Enclave Delhi NCR8447779800, Low rate Call girls in Shivaji Enclave Delhi NCR
8447779800, Low rate Call girls in Shivaji Enclave Delhi NCRashishs7044
 
Intro to BCG's Carbon Emissions Benchmark_vF.pdf
Intro to BCG's Carbon Emissions Benchmark_vF.pdfIntro to BCG's Carbon Emissions Benchmark_vF.pdf
Intro to BCG's Carbon Emissions Benchmark_vF.pdfpollardmorgan
 
IoT Insurance Observatory: summary 2024
IoT Insurance Observatory:  summary 2024IoT Insurance Observatory:  summary 2024
IoT Insurance Observatory: summary 2024Matteo Carbone
 
Market Sizes Sample Report - 2024 Edition
Market Sizes Sample Report - 2024 EditionMarket Sizes Sample Report - 2024 Edition
Market Sizes Sample Report - 2024 EditionMintel Group
 
8447779800, Low rate Call girls in Rohini Delhi NCR
8447779800, Low rate Call girls in Rohini Delhi NCR8447779800, Low rate Call girls in Rohini Delhi NCR
8447779800, Low rate Call girls in Rohini Delhi NCRashishs7044
 
Call Us 📲8800102216📞 Call Girls In DLF City Gurgaon
Call Us 📲8800102216📞 Call Girls In DLF City GurgaonCall Us 📲8800102216📞 Call Girls In DLF City Gurgaon
Call Us 📲8800102216📞 Call Girls In DLF City Gurgaoncallgirls2057
 
Investment in The Coconut Industry by Nancy Cheruiyot
Investment in The Coconut Industry by Nancy CheruiyotInvestment in The Coconut Industry by Nancy Cheruiyot
Investment in The Coconut Industry by Nancy Cheruiyotictsugar
 

Último (20)

MAHA Global and IPR: Do Actions Speak Louder Than Words?
MAHA Global and IPR: Do Actions Speak Louder Than Words?MAHA Global and IPR: Do Actions Speak Louder Than Words?
MAHA Global and IPR: Do Actions Speak Louder Than Words?
 
Pitch Deck Teardown: Geodesic.Life's $500k Pre-seed deck
Pitch Deck Teardown: Geodesic.Life's $500k Pre-seed deckPitch Deck Teardown: Geodesic.Life's $500k Pre-seed deck
Pitch Deck Teardown: Geodesic.Life's $500k Pre-seed deck
 
8447779800, Low rate Call girls in Tughlakabad Delhi NCR
8447779800, Low rate Call girls in Tughlakabad Delhi NCR8447779800, Low rate Call girls in Tughlakabad Delhi NCR
8447779800, Low rate Call girls in Tughlakabad Delhi NCR
 
Future Of Sample Report 2024 | Redacted Version
Future Of Sample Report 2024 | Redacted VersionFuture Of Sample Report 2024 | Redacted Version
Future Of Sample Report 2024 | Redacted Version
 
Innovation Conference 5th March 2024.pdf
Innovation Conference 5th March 2024.pdfInnovation Conference 5th March 2024.pdf
Innovation Conference 5th March 2024.pdf
 
Call US-88OO1O2216 Call Girls In Mahipalpur Female Escort Service
Call US-88OO1O2216 Call Girls In Mahipalpur Female Escort ServiceCall US-88OO1O2216 Call Girls In Mahipalpur Female Escort Service
Call US-88OO1O2216 Call Girls In Mahipalpur Female Escort Service
 
Marketplace and Quality Assurance Presentation - Vincent Chirchir
Marketplace and Quality Assurance Presentation - Vincent ChirchirMarketplace and Quality Assurance Presentation - Vincent Chirchir
Marketplace and Quality Assurance Presentation - Vincent Chirchir
 
Corporate Profile 47Billion Information Technology
Corporate Profile 47Billion Information TechnologyCorporate Profile 47Billion Information Technology
Corporate Profile 47Billion Information Technology
 
Memorándum de Entendimiento (MoU) entre Codelco y SQM
Memorándum de Entendimiento (MoU) entre Codelco y SQMMemorándum de Entendimiento (MoU) entre Codelco y SQM
Memorándum de Entendimiento (MoU) entre Codelco y SQM
 
Case study on tata clothing brand zudio in detail
Case study on tata clothing brand zudio in detailCase study on tata clothing brand zudio in detail
Case study on tata clothing brand zudio in detail
 
Organizational Structure Running A Successful Business
Organizational Structure Running A Successful BusinessOrganizational Structure Running A Successful Business
Organizational Structure Running A Successful Business
 
No-1 Call Girls In Goa 93193 VIP 73153 Escort service In North Goa Panaji, Ca...
No-1 Call Girls In Goa 93193 VIP 73153 Escort service In North Goa Panaji, Ca...No-1 Call Girls In Goa 93193 VIP 73153 Escort service In North Goa Panaji, Ca...
No-1 Call Girls In Goa 93193 VIP 73153 Escort service In North Goa Panaji, Ca...
 
Ten Organizational Design Models to align structure and operations to busines...
Ten Organizational Design Models to align structure and operations to busines...Ten Organizational Design Models to align structure and operations to busines...
Ten Organizational Design Models to align structure and operations to busines...
 
8447779800, Low rate Call girls in Shivaji Enclave Delhi NCR
8447779800, Low rate Call girls in Shivaji Enclave Delhi NCR8447779800, Low rate Call girls in Shivaji Enclave Delhi NCR
8447779800, Low rate Call girls in Shivaji Enclave Delhi NCR
 
Intro to BCG's Carbon Emissions Benchmark_vF.pdf
Intro to BCG's Carbon Emissions Benchmark_vF.pdfIntro to BCG's Carbon Emissions Benchmark_vF.pdf
Intro to BCG's Carbon Emissions Benchmark_vF.pdf
 
IoT Insurance Observatory: summary 2024
IoT Insurance Observatory:  summary 2024IoT Insurance Observatory:  summary 2024
IoT Insurance Observatory: summary 2024
 
Market Sizes Sample Report - 2024 Edition
Market Sizes Sample Report - 2024 EditionMarket Sizes Sample Report - 2024 Edition
Market Sizes Sample Report - 2024 Edition
 
8447779800, Low rate Call girls in Rohini Delhi NCR
8447779800, Low rate Call girls in Rohini Delhi NCR8447779800, Low rate Call girls in Rohini Delhi NCR
8447779800, Low rate Call girls in Rohini Delhi NCR
 
Call Us 📲8800102216📞 Call Girls In DLF City Gurgaon
Call Us 📲8800102216📞 Call Girls In DLF City GurgaonCall Us 📲8800102216📞 Call Girls In DLF City Gurgaon
Call Us 📲8800102216📞 Call Girls In DLF City Gurgaon
 
Investment in The Coconut Industry by Nancy Cheruiyot
Investment in The Coconut Industry by Nancy CheruiyotInvestment in The Coconut Industry by Nancy Cheruiyot
Investment in The Coconut Industry by Nancy Cheruiyot
 

Area 4 hyde park, shoal creek, rosedale

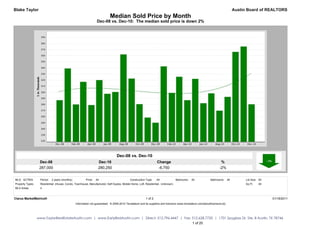
  • 1. Blake Taylor Austin Board of REALTORS Median Sold Price by Month Dec-08 vs. Dec-10: The median sold price is down 2% Dec-08 vs. Dec-10 Dec-08 Dec-10 Change % 287,000 280,250 -6,750 -2% MLS: ACTRIS Period: 2 years (monthly) Price: All Construction Type: All Bedrooms: All Bathrooms: All Lot Size: All Property Types: Residential: (House, Condo, Townhouse, Manufactured, Half Duplex, Mobile Home, Loft, Residential - Unknown) Sq Ft: All MLS Areas: 4 Clarus MarketMetrics® 1 of 2 01/18/2011 Information not guaranteed. © 2009-2010 Terradatum and its suppliers and licensors (www.terradatum.com/about/licensors.td). www.TaylorRealEstateAustin.com | www.EarlyBirdAustin.com | Direct: 512.796.4447 | Fax: 512.628.7720 | 1701 Spyglass Dr. Ste. 8 Austin, TX 78746 1 of 20
  • 2. Blake Taylor Austin Board of REALTORS Median Sold Price by Month Dec-08 vs. Dec-10: The median sold price is down 2% Time Period Median Price # Units Average DOM Dec-10 280,250 20 89 Nov-10 375,000 18 118 Oct-10 366,250 16 60 Sep-10 292,350 21 109 Aug-10 269,750 28 63 Jul-10 298,250 22 67 Jun-10 282,000 41 74 May-10 322,000 32 103 Apr-10 287,000 30 46 Mar-10 325,402 23 94 Feb-10 299,000 13 79 Jan-10 342,500 7 101 Dec-09 250,100 20 109 Nov-09 258,500 26 55 Oct-09 280,500 24 74 Sep-09 322,500 37 80 Aug-09 362,000 17 84 Jul-09 300,500 44 76 Jun-09 297,500 38 68 May-09 320,000 23 77 Apr-09 279,000 30 62 Mar-09 317,000 18 89 Feb-09 280,000 19 92 Jan-09 339,000 7 55 Dec-08 287,000 17 84 Clarus MarketMetrics® 2 of 2 01/18/2011 Information not guaranteed. © 2009-2010 Terradatum and its suppliers and licensors (www.terradatum.com/about/licensors.td). www.TaylorRealEstateAustin.com | www.EarlyBirdAustin.com | Direct: 512.796.4447 | Fax: 512.628.7720 | 1701 Spyglass Dr. Ste. 8 Austin, TX 78746 2 of 20
  • 3. Blake Taylor Austin Board of REALTORS Median For Sale vs. Median Sold Dec-08 vs. Dec-10: The median price of for sale properties is down 16% and the median price of sold properties is down 2% Dec-08 vs. Dec-10 Dec-08 vs. Dec-10 Dec-08 Dec-10 Change % Dec-08 Dec-10 Change % 345,000 289,000 -56,000 -16% 287,000 280,250 -6,750 -2% MLS: ACTRIS Period: 2 years (monthly) Price: All Construction Type: All Bedrooms: All Bathrooms: All Lot Size: All Property Types: Residential: (House, Condo, Townhouse, Manufactured, Half Duplex, Mobile Home, Loft, Residential - Unknown) Sq Ft: All MLS Areas: 4 Clarus MarketMetrics® 1 of 2 01/18/2011 Information not guaranteed. © 2009-2010 Terradatum and its suppliers and licensors (www.terradatum.com/about/licensors.td). www.TaylorRealEstateAustin.com | www.EarlyBirdAustin.com | Direct: 512.796.4447 | Fax: 512.628.7720 | 1701 Spyglass Dr. Ste. 8 Austin, TX 78746 3 of 20
  • 4. Blake Taylor Austin Board of REALTORS Median For Sale vs. Median Sold Dec-08 vs. Dec-10: The median price of for sale properties is down 16% and the median price of sold properties is down 2% For Sale # Properties Sold # Properties Price Time Period Median For Sale Median Sold Difference Dec-10 289,000 190 280,250 20 -8,750 Nov-10 299,000 229 375,000 18 76,000 Oct-10 295,000 253 366,250 16 71,250 Sep-10 299,814 263 292,350 21 -7,464 Aug-10 299,000 294 269,750 28 -29,250 Jul-10 299,000 300 298,250 22 -750 Jun-10 298,700 309 282,000 41 -16,700 May-10 315,000 299 322,000 32 7,000 Apr-10 315,000 286 287,000 30 -28,000 Mar-10 315,000 268 325,402 23 10,402 Feb-10 327,000 224 299,000 13 -28,000 Jan-10 329,450 194 342,500 7 13,050 Dec-09 326,250 190 250,100 20 -76,150 Nov-09 324,950 210 258,500 26 -66,450 Oct-09 327,500 221 280,500 24 -47,000 Sep-09 345,000 247 322,500 37 -22,500 Aug-09 319,950 290 362,000 17 42,050 Jul-09 310,450 278 300,500 44 -9,950 Jun-09 329,900 281 297,500 38 -32,400 May-09 344,950 268 320,000 23 -24,950 Apr-09 345,000 271 279,000 30 -66,000 Mar-09 349,700 254 317,000 18 -32,700 Feb-09 350,000 207 280,000 19 -70,000 Jan-09 349,900 222 339,000 7 -10,900 Dec-08 345,000 229 287,000 17 -58,000 Clarus MarketMetrics® 2 of 2 01/18/2011 Information not guaranteed. © 2009-2010 Terradatum and its suppliers and licensors (www.terradatum.com/about/licensors.td). www.TaylorRealEstateAustin.com | www.EarlyBirdAustin.com | Direct: 512.796.4447 | Fax: 512.628.7720 | 1701 Spyglass Dr. Ste. 8 Austin, TX 78746 4 of 20
  • 5. Blake Taylor Austin Board of REALTORS Sold Properties by Month Dec-08 vs. Dec-10: The number of Sold properties is up 18% Dec-08 vs. Dec-10 Dec-08 Dec-10 Change % 17 20 3 +18% MLS: ACTRIS Period: 2 years (monthly) Price: All Construction Type: All Bedrooms: All Bathrooms: All Lot Size: All Property Types: Residential: (House, Condo, Townhouse, Manufactured, Half Duplex, Mobile Home, Loft, Residential - Unknown) Sq Ft: All MLS Areas: 4 Clarus MarketMetrics® 1 of 2 01/18/2011 Information not guaranteed. © 2009-2010 Terradatum and its suppliers and licensors (www.terradatum.com/about/licensors.td). www.TaylorRealEstateAustin.com | www.EarlyBirdAustin.com | Direct: 512.796.4447 | Fax: 512.628.7720 | 1701 Spyglass Dr. Ste. 8 Austin, TX 78746 5 of 20
  • 6. Blake Taylor Austin Board of REALTORS Sold Properties by Month Dec-08 vs. Dec-10: The number of Sold properties is up 18% Full Market Bank Properties Non-Bank Properties Time Period # Properties Median Price Average DOM # Properties % Bank Median Price # Properties % Non-Bank Median Price Dec-10 20 280,250 89 3 15.0 195,000 17 85.0 287,000 Nov-10 18 375,000 118 1 5.6 476,000 17 94.4 365,000 Oct-10 16 366,250 60 0 16 100.0 366,250 Sep-10 21 292,350 109 0 21 100.0 292,350 Aug-10 28 269,750 63 0 28 100.0 269,750 Jul-10 22 298,250 67 1 4.5 280,000 21 95.5 301,500 Jun-10 41 282,000 74 1 2.4 233,200 40 97.6 288,350 May-10 32 322,000 103 0 32 100.0 322,000 Apr-10 30 287,000 46 1 3.3 204,900 29 96.7 299,000 Mar-10 23 325,402 94 2 8.7 285,000 21 91.3 325,402 Feb-10 13 299,000 79 2 15.4 243,000 11 84.6 299,000 Jan-10 7 342,500 101 0 7 100.0 342,500 Dec-09 20 250,100 109 0 20 100.0 250,100 Nov-09 26 258,500 55 0 26 100.0 258,500 Oct-09 24 280,500 74 0 24 100.0 280,500 Sep-09 37 322,500 80 0 37 100.0 322,500 Aug-09 17 362,000 84 0 17 100.0 362,000 Jul-09 44 300,500 76 0 44 100.0 300,500 Jun-09 38 297,500 68 3 7.9 205,000 35 92.1 302,000 May-09 23 320,000 77 1 4.3 290,000 22 95.7 321,000 Apr-09 30 279,000 62 0 30 100.0 279,000 Mar-09 18 317,000 89 1 5.6 194,000 17 94.4 319,000 Feb-09 19 280,000 92 0 19 100.0 280,000 Jan-09 7 339,000 55 0 7 100.0 339,000 Dec-08 17 287,000 84 0 17 100.0 287,000 Clarus MarketMetrics® 2 of 2 01/18/2011 Information not guaranteed. © 2009-2010 Terradatum and its suppliers and licensors (www.terradatum.com/about/licensors.td). www.TaylorRealEstateAustin.com | www.EarlyBirdAustin.com | Direct: 512.796.4447 | Fax: 512.628.7720 | 1701 Spyglass Dr. Ste. 8 Austin, TX 78746 6 of 20
  • 7. Blake Taylor Austin Board of REALTORS Under Contract Properties by Month Dec-08 vs. Dec-10: The number of Under Contract properties is up 200% Dec-08 vs. Dec-10 Dec-08 Dec-10 Change % 6 18 12 +200% MLS: ACTRIS Period: 2 years (monthly) Price: All Construction Type: All Bedrooms: All Bathrooms: All Lot Size: All Property Types: Residential: (House, Condo, Townhouse, Manufactured, Half Duplex, Mobile Home, Loft, Residential - Unknown) Sq Ft: All MLS Areas: 4 Clarus MarketMetrics® 1 of 2 01/18/2011 Information not guaranteed. © 2009-2010 Terradatum and its suppliers and licensors (www.terradatum.com/about/licensors.td). www.TaylorRealEstateAustin.com | www.EarlyBirdAustin.com | Direct: 512.796.4447 | Fax: 512.628.7720 | 1701 Spyglass Dr. Ste. 8 Austin, TX 78746 7 of 20
  • 8. Blake Taylor Austin Board of REALTORS Under Contract Properties by Month Dec-08 vs. Dec-10: The number of Under Contract properties is up 200% Full Market Bank Properties Non-Bank Properties Time Period # Properties Median Price Average DOM # Properties % Bank Median Price # Properties % Non-Bank Median Price Dec-10 18 271,450 68 1 5.6 220,900 17 94.4 274,900 Nov-10 20 341,000 78 3 15.0 425,900 17 85.0 339,000 Oct-10 21 360,000 107 2 9.5 272,500 19 90.5 369,500 Sep-10 11 375,000 63 0 11 100.0 375,000 Aug-10 25 298,000 97 0 25 100.0 298,000 Jul-10 18 299,000 60 0 18 100.0 299,000 Jun-10 29 307,900 70 1 3.5 298,700 28 96.5 308,950 May-10 24 297,260 56 0 24 100.0 297,260 Apr-10 41 325,000 96 0 41 100.0 325,000 Mar-10 40 279,700 56 2 5.0 189,900 38 95.0 304,900 Feb-10 20 339,450 77 2 10.0 340,000 18 90.0 339,450 Jan-10 14 304,000 77 1 7.1 149,900 13 92.9 309,000 Dec-09 10 338,500 167 1 10.0 355,000 9 90.0 327,500 Nov-09 19 274,500 114 0 19 100.0 274,500 Oct-09 24 264,800 53 0 24 100.0 264,800 Sep-09 25 300,000 83 0 25 100.0 300,000 Aug-09 38 335,000 65 0 38 100.0 335,000 Jul-09 23 349,500 75 0 23 100.0 349,500 Jun-09 29 299,900 72 0 29 100.0 299,900 May-09 39 295,000 75 2 5.1 219,950 37 94.9 309,000 Apr-09 34 299,700 77 1 2.9 489,000 33 97.1 299,500 Mar-09 28 358,700 73 0 28 100.0 358,700 Feb-09 15 307,500 79 2 13.3 242,250 13 86.7 324,675 Jan-09 21 289,900 90 0 21 100.0 289,900 Dec-08 6 272,500 46 0 6 100.0 272,500 Clarus MarketMetrics® 2 of 2 01/18/2011 Information not guaranteed. © 2009-2010 Terradatum and its suppliers and licensors (www.terradatum.com/about/licensors.td). www.TaylorRealEstateAustin.com | www.EarlyBirdAustin.com | Direct: 512.796.4447 | Fax: 512.628.7720 | 1701 Spyglass Dr. Ste. 8 Austin, TX 78746 8 of 20
  • 9. Blake Taylor Austin Board of REALTORS New Properties by Month Dec-08 vs. Dec-10: The number of New properties is down 44% Dec-08 vs. Dec-10 Dec-08 Dec-10 Change % 32 18 -14 -44% MLS: ACTRIS Period: 2 years (monthly) Price: All Construction Type: All Bedrooms: All Bathrooms: All Lot Size: All Property Types: Residential: (House, Condo, Townhouse, Manufactured, Half Duplex, Mobile Home, Loft, Residential - Unknown) Sq Ft: All MLS Areas: 4 Clarus MarketMetrics® 1 of 2 01/18/2011 Information not guaranteed. © 2009-2010 Terradatum and its suppliers and licensors (www.terradatum.com/about/licensors.td). www.TaylorRealEstateAustin.com | www.EarlyBirdAustin.com | Direct: 512.796.4447 | Fax: 512.628.7720 | 1701 Spyglass Dr. Ste. 8 Austin, TX 78746 9 of 20
  • 10. Blake Taylor Austin Board of REALTORS New Properties by Month Dec-08 vs. Dec-10: The number of New properties is down 44% Full Market Bank Properties Non-Bank Properties Time Period # Properties Median Price # Properties % Bank Median Price # Properties % Non-Bank Median Price Dec-10 18 283,650 2 11.1 188,950 16 88.9 296,150 Nov-10 39 285,000 1 2.6 197,900 38 97.4 285,000 Oct-10 42 232,900 0 42 100.0 232,900 Sep-10 48 302,500 5 10.4 360,000 43 89.6 295,000 Aug-10 55 290,000 0 55 100.0 290,000 Jul-10 50 314,450 1 2.0 275,000 49 98.0 319,000 Jun-10 61 260,000 4 6.6 209,900 57 93.4 274,500 May-10 71 339,900 4 5.6 339,900 67 94.4 340,000 Apr-10 78 289,900 0 78 100.0 289,900 Mar-10 82 312,500 1 1.2 175,000 81 98.8 315,000 Feb-10 65 274,900 1 1.5 204,900 64 98.5 276,950 Jan-10 50 331,950 1 2.0 420,000 49 98.0 329,900 Dec-09 27 349,000 3 11.1 229,000 24 88.9 349,450 Nov-09 37 274,900 1 2.7 149,900 36 97.3 284,950 Oct-09 33 325,000 2 6.1 247,500 31 93.9 329,900 Sep-09 46 354,450 0 46 100.0 354,450 Aug-09 66 359,950 0 66 100.0 359,950 Jul-09 58 275,450 0 58 100.0 275,450 Jun-09 84 303,357 0 84 100.0 303,357 May-09 58 299,735 2 3.5 244,950 56 96.5 304,450 Apr-09 72 311,525 1 1.4 355,000 71 98.6 299,500 Mar-09 78 338,250 0 78 100.0 338,250 Feb-09 44 327,288 1 2.3 489,000 43 97.7 324,675 Jan-09 45 335,000 2 4.4 252,500 43 95.6 335,900 Dec-08 32 334,950 1 3.1 455,555 31 96.9 324,900 Clarus MarketMetrics® 2 of 2 01/18/2011 Information not guaranteed. © 2009-2010 Terradatum and its suppliers and licensors (www.terradatum.com/about/licensors.td). www.TaylorRealEstateAustin.com | www.EarlyBirdAustin.com | Direct: 512.796.4447 | Fax: 512.628.7720 | 1701 Spyglass Dr. Ste. 8 Austin, TX 78746 10 of 20
  • 11. Blake Taylor Austin Board of REALTORS For Sale Properties by Month Dec-08 vs. Dec-10: The number of For Sale properties is down 17% Dec-08 vs. Dec-10 Dec-08 Dec-10 Change % 229 190 -39 -17% MLS: ACTRIS Period: 2 years (monthly) Price: All Construction Type: All Bedrooms: All Bathrooms: All Lot Size: All Property Types: Residential: (House, Condo, Townhouse, Manufactured, Half Duplex, Mobile Home, Loft, Residential - Unknown) Sq Ft: All MLS Areas: 4 Clarus MarketMetrics® 1 of 2 01/18/2011 Information not guaranteed. © 2009-2010 Terradatum and its suppliers and licensors (www.terradatum.com/about/licensors.td). www.TaylorRealEstateAustin.com | www.EarlyBirdAustin.com | Direct: 512.796.4447 | Fax: 512.628.7720 | 1701 Spyglass Dr. Ste. 8 Austin, TX 78746 11 of 20
  • 12. Blake Taylor Austin Board of REALTORS For Sale Properties by Month Dec-08 vs. Dec-10: The number of For Sale properties is down 17% Full Market Bank Properties Non-Bank Properties Time Period # Properties Median Price Average DOM # Properties % Bank Median Price # Properties % Non-Bank Median Price Dec-10 190 289,000 141 7 3.7 220,900 183 96.3 290,000 Nov-10 229 299,000 142 9 3.9 324,900 220 96.1 297,000 Oct-10 253 295,000 149 11 4.3 339,900 242 95.7 290,000 Sep-10 263 299,814 156 12 4.6 332,400 251 95.4 299,000 Aug-10 294 299,000 157 9 3.1 275,000 285 96.9 299,000 Jul-10 300 299,000 155 9 3.0 275,000 291 97.0 299,000 Jun-10 309 298,700 153 10 3.2 263,850 299 96.8 299,000 May-10 299 315,000 156 7 2.3 339,900 292 97.7 312,500 Apr-10 286 315,000 157 3 1.1 229,000 283 99.0 315,000 Mar-10 268 315,000 159 6 2.2 216,950 262 97.8 318,388 Feb-10 224 327,000 175 8 3.6 247,500 216 96.4 329,900 Jan-10 194 329,450 187 8 4.1 247,500 186 95.9 329,900 Dec-09 190 326,250 188 8 4.2 247,500 182 95.8 329,900 Nov-09 210 324,950 184 5 2.4 260,000 205 97.6 325,000 Oct-09 221 327,500 177 4 1.8 260,000 217 98.2 329,900 Sep-09 247 345,000 173 2 0.8 307,500 245 99.2 345,000 Aug-09 290 319,950 156 2 0.7 307,500 288 99.3 319,950 Jul-09 278 310,450 154 2 0.7 307,500 276 99.3 310,450 Jun-09 281 329,900 152 2 0.7 307,500 279 99.3 329,900 May-09 268 344,950 153 4 1.5 244,950 264 98.5 345,000 Apr-09 271 345,000 159 4 1.5 405,278 267 98.5 345,000 Mar-09 254 349,700 159 3 1.2 455,555 251 98.8 349,500 Feb-09 207 350,000 175 5 2.4 295,000 202 97.6 352,500 Jan-09 222 349,900 178 5 2.2 295,000 217 97.8 350,000 Dec-08 229 345,000 180 3 1.3 339,000 226 98.7 347,250 Clarus MarketMetrics® 2 of 2 01/18/2011 Information not guaranteed. © 2009-2010 Terradatum and its suppliers and licensors (www.terradatum.com/about/licensors.td). www.TaylorRealEstateAustin.com | www.EarlyBirdAustin.com | Direct: 512.796.4447 | Fax: 512.628.7720 | 1701 Spyglass Dr. Ste. 8 Austin, TX 78746 12 of 20
  • 13. Blake Taylor Austin Board of REALTORS Expired Properties by Month Dec-08 vs. Dec-10: The number of Expired properties is down 13% Dec-08 vs. Dec-10 Dec-08 Dec-10 Change % 46 40 -6 -13% MLS: ACTRIS Period: 2 years (monthly) Price: All Construction Type: All Bedrooms: All Bathrooms: All Lot Size: All Property Types: Residential: (House, Condo, Townhouse, Manufactured, Half Duplex, Mobile Home, Loft, Residential - Unknown) Sq Ft: All MLS Areas: 4 Clarus MarketMetrics® 1 of 2 01/18/2011 Information not guaranteed. © 2009-2010 Terradatum and its suppliers and licensors (www.terradatum.com/about/licensors.td). www.TaylorRealEstateAustin.com | www.EarlyBirdAustin.com | Direct: 512.796.4447 | Fax: 512.628.7720 | 1701 Spyglass Dr. Ste. 8 Austin, TX 78746 13 of 20
  • 14. Blake Taylor Austin Board of REALTORS Expired Properties by Month Dec-08 vs. Dec-10: The number of Expired properties is down 13% Full Market Bank Properties Non-Bank Properties Time Period # Properties Median Price Average DOM # Properties % Bank Median Price # Properties % Non-Bank Median Price Dec-10 40 289,500 134 2 5.0 307,450 38 95.0 289,500 Nov-10 37 319,000 129 1 2.7 339,900 36 97.3 309,000 Oct-10 42 245,000 117 1 2.4 339,900 41 97.6 240,000 Sep-10 41 289,100 134 1 2.4 219,900 40 97.6 294,050 Aug-10 54 298,000 117 2 3.7 214,450 52 96.3 304,500 Jul-10 43 259,000 104 0 43 100.0 259,000 Jun-10 30 324,000 127 1 3.3 175,000 29 96.7 349,000 May-10 27 399,000 136 1 3.7 500,000 26 96.3 387,000 Apr-10 17 389,000 96 0 17 100.0 389,000 Mar-10 20 267,450 137 1 5.0 260,000 19 95.0 274,900 Feb-10 18 320,000 170 1 5.6 235,000 17 94.4 345,000 Jan-10 21 290,000 150 0 21 100.0 290,000 Dec-09 36 332,488 88 0 36 100.0 332,488 Nov-09 28 328,400 149 0 28 100.0 328,400 Oct-09 24 382,500 146 0 24 100.0 382,500 Sep-09 34 398,500 146 0 34 100.0 398,500 Aug-09 51 270,000 101 0 51 100.0 270,000 Jul-09 31 289,000 105 0 31 100.0 289,000 Jun-09 32 349,000 87 0 32 100.0 349,000 May-09 32 347,000 100 0 32 100.0 347,000 Apr-09 27 369,000 143 1 3.7 455,555 26 96.3 352,450 Mar-09 27 335,000 113 0 27 100.0 335,000 Feb-09 16 332,400 72 0 16 100.0 332,400 Jan-09 38 379,425 134 1 2.6 339,000 37 97.4 399,850 Dec-08 46 332,450 129 0 46 100.0 332,450 Clarus MarketMetrics® 2 of 2 01/18/2011 Information not guaranteed. © 2009-2010 Terradatum and its suppliers and licensors (www.terradatum.com/about/licensors.td). www.TaylorRealEstateAustin.com | www.EarlyBirdAustin.com | Direct: 512.796.4447 | Fax: 512.628.7720 | 1701 Spyglass Dr. Ste. 8 Austin, TX 78746 14 of 20
  • 15. Blake Taylor Austin Board of REALTORS Supply & Demand by Month Dec-08 vs. Dec-10: The number of for sale properties is down 17% and the number of sold properties is up 18% Dec-08 vs. Dec-10 Dec-08 vs. Dec-10 Dec-08 Dec-10 Change % Dec-08 Dec-10 Change % 229 190 -39 -17% 17 20 3 +18% MLS: ACTRIS Period: 2 years (monthly) Price: All Construction Type: All Bedrooms: All Bathrooms: All Lot Size: All Property Types: Residential: (House, Condo, Townhouse, Manufactured, Half Duplex, Mobile Home, Loft, Residential - Unknown) Sq Ft: All MLS Areas: 4 Clarus MarketMetrics® 1 of 2 01/18/2011 Information not guaranteed. © 2009-2010 Terradatum and its suppliers and licensors (www.terradatum.com/about/licensors.td). www.TaylorRealEstateAustin.com | www.EarlyBirdAustin.com | Direct: 512.796.4447 | Fax: 512.628.7720 | 1701 Spyglass Dr. Ste. 8 Austin, TX 78746 15 of 20
  • 16. Blake Taylor Austin Board of REALTORS Supply & Demand by Month Dec-08 vs. Dec-10: The number of for sale properties is down 17% and the number of sold properties is up 18% # Properties Average DOM # Properties Average DOM Time Period For Sale For Sale Sold Sold Dec-10 190 141 20 89 Nov-10 229 142 18 118 Oct-10 253 149 16 60 Sep-10 263 156 21 109 Aug-10 294 157 28 63 Jul-10 300 155 22 67 Jun-10 309 153 41 74 May-10 299 156 32 103 Apr-10 286 157 30 46 Mar-10 268 159 23 94 Feb-10 224 175 13 79 Jan-10 194 187 7 101 Dec-09 190 188 20 109 Nov-09 210 184 26 55 Oct-09 221 177 24 74 Sep-09 247 173 37 80 Aug-09 290 156 17 84 Jul-09 278 154 44 76 Jun-09 281 152 38 68 May-09 268 153 23 77 Apr-09 271 159 30 62 Mar-09 254 159 18 89 Feb-09 207 175 19 92 Jan-09 222 178 7 55 Dec-08 229 180 17 84 Clarus MarketMetrics® 2 of 2 01/18/2011 Information not guaranteed. © 2009-2010 Terradatum and its suppliers and licensors (www.terradatum.com/about/licensors.td). www.TaylorRealEstateAustin.com | www.EarlyBirdAustin.com | Direct: 512.796.4447 | Fax: 512.628.7720 | 1701 Spyglass Dr. Ste. 8 Austin, TX 78746 16 of 20
  • 17. Blake Taylor Austin Board of REALTORS The Average Days on Market by Month Dec-08 vs. Dec-10: The average days on market is up 46% Dec-08 vs. Dec-10 Dec-08 Dec-10 Change % 46 68 21 +46% MLS: ACTRIS Period: 2 years (monthly) Price: All Construction Type: All Bedrooms: All Bathrooms: All Lot Size: All Property Types: Residential: (House, Condo, Townhouse, Manufactured, Half Duplex, Mobile Home, Loft, Residential - Unknown) Sq Ft: All MLS Areas: 4 Clarus MarketMetrics® 1 of 2 01/18/2011 Information not guaranteed. © 2009-2010 Terradatum and its suppliers and licensors (www.terradatum.com/about/licensors.td). www.TaylorRealEstateAustin.com | www.EarlyBirdAustin.com | Direct: 512.796.4447 | Fax: 512.628.7720 | 1701 Spyglass Dr. Ste. 8 Austin, TX 78746 17 of 20
  • 18. Blake Taylor Austin Board of REALTORS The Average Days on Market by Month Dec-08 vs. Dec-10: The average days on market is up 46% Time Period Average DOM # UC Units Dec-10 68 18 Nov-10 78 20 Oct-10 107 21 Sep-10 63 11 Aug-10 97 25 Jul-10 60 18 Jun-10 70 29 May-10 56 24 Apr-10 96 41 Mar-10 56 40 Feb-10 77 20 Jan-10 77 14 Dec-09 167 10 Nov-09 114 19 Oct-09 53 24 Sep-09 83 25 Aug-09 65 38 Jul-09 75 23 Jun-09 72 29 May-09 75 39 Apr-09 77 34 Mar-09 73 28 Feb-09 79 15 Jan-09 90 21 Dec-08 46 6 Clarus MarketMetrics® 2 of 2 01/18/2011 Information not guaranteed. © 2009-2010 Terradatum and its suppliers and licensors (www.terradatum.com/about/licensors.td). www.TaylorRealEstateAustin.com | www.EarlyBirdAustin.com | Direct: 512.796.4447 | Fax: 512.628.7720 | 1701 Spyglass Dr. Ste. 8 Austin, TX 78746 18 of 20
  • 19. Blake Taylor Austin Board of REALTORS Months Supply of Inventory Dec-08 vs. Dec-10: The average months supply of inventory is down 75% Dec-08 vs. Dec-10 Dec-08 Dec-10 Change % 29.5 7.3 -22.2 -75% MLS: ACTRIS Period: 2 years (monthly) Price: All Construction Type: All Bedrooms: All Bathrooms: All Lot Size: All Property Types: Residential: (House, Condo, Townhouse, Manufactured, Half Duplex, Mobile Home, Loft, Residential - Unknown) Sq Ft: All MLS Areas: 4 Clarus MarketMetrics® 1 of 2 01/18/2011 Information not guaranteed. © 2009-2010 Terradatum and its suppliers and licensors (www.terradatum.com/about/licensors.td). www.TaylorRealEstateAustin.com | www.EarlyBirdAustin.com | Direct: 512.796.4447 | Fax: 512.628.7720 | 1701 Spyglass Dr. Ste. 8 Austin, TX 78746 19 of 20
  • 20. Blake Taylor Austin Board of REALTORS Months Supply of Inventory Dec-08 vs. Dec-10: The average months supply of inventory is down 75% # Units For Sale # UC Units UC Average Time Period Last Day of Month During Month MSI DOM Dec-10 132 18 7.3 68 Nov-10 172 20 8.6 78 Oct-10 190 21 9.0 107 Sep-10 211 11 19.2 63 Aug-10 215 25 8.6 97 Jul-10 239 18 13.3 60 Jun-10 250 29 8.6 70 May-10 248 24 10.3 56 Apr-10 228 41 5.6 96 Mar-10 208 40 5.2 56 Feb-10 186 20 9.3 77 Jan-10 159 14 11.4 77 Dec-09 144 10 14.4 167 Nov-09 163 19 8.6 114 Oct-09 173 24 7.2 53 Sep-09 188 25 7.5 83 Aug-09 201 38 5.3 65 Jul-09 224 23 9.7 75 Jun-09 220 29 7.6 72 May-09 197 39 5.1 75 Apr-09 210 34 6.2 77 Mar-09 199 28 7.1 73 Feb-09 176 15 11.7 79 Jan-09 163 21 7.8 90 Dec-08 177 6 29.5 46 Clarus MarketMetrics® 2 of 2 01/18/2011 Information not guaranteed. © 2009-2010 Terradatum and its suppliers and licensors (www.terradatum.com/about/licensors.td). www.TaylorRealEstateAustin.com | www.EarlyBirdAustin.com | Direct: 512.796.4447 | Fax: 512.628.7720 | 1701 Spyglass Dr. Ste. 8 Austin, TX 78746 20 of 20