Telling Stories with Data
•
0 recomendaciones•781 vistas

Susan Moore, whose global work and results were published in the book, Wake Me Up When the Data is Over, has held senior management positions with Microsoft and Eastman. Elissa Fink is the Senior Vice President of Tableau Software. Together, these two dynamic business leaders addressed the fundamental shift in how we see and process data.

Recomendados
Recomendados
Más contenido relacionado
Similar a Telling Stories with Data
Similar a Telling Stories with Data (20)
Más de Triangle American Marketing Association
Más de Triangle American Marketing Association (20)
Último
Último (20)
Telling Stories with Data
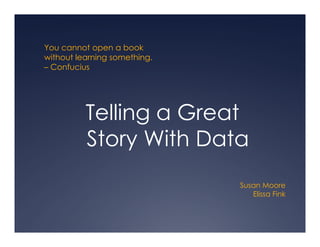
- 1. You cannot open a book Y t b k without learning something. – Confucius Telling a Great T lli G t Story With Data Susan Moore Elissa Fink
- 2. Providing Facts to Management Can Be a Big Job to Navigate 2
- 3. Why Story? Makes sense and order Sees the whole where there are disparate parts Gives vision to what the future can look like Is interactive – people p themselves p p put into stories 3
- 4. What Is a Good Story? A good story involves Characters Challenge iis b li Ch ll believable bl There are Hurdles to overcome Outcome or prognosis is clear 4
- 5. A Story Has Emotion 5
- 6. Often, Often Presenting Data ≠ Good Story Monthly Presentation of Results 6
- 7. Why? Too often, We Create the Presentation Before We Know the Story 7
- 8. The Presentation or The Story? Is This Really Just “Sales by Region”? “West Region Growing By Leaps & Bounds”? Sales by Region 30% 25% 20% 15% Last Period 10% This Period 5% 0% East Midwest South West 8
- 9. When Crafting a Data-Rich Story… Get the Story First: Explore the Data What Are the Findings? Determine What You Want People to Do as a Result Finally, Write Out the “Story Board” for Your Audience The more senior your audience = fewer slides 9
- 10. This? 10 10/21/2008
- 11. Or This? 11 10/21/2008
- 12. Be Authentic Authentic… Your Story will Flow What Makes It Believable For Your Audience? Start with metaphor, urban legend or anecdote. Develop with data. Authenticity is rooted data in facts. Facts are rooted in data. Supplement hard data with qualitative data. • Sample customer emails • Audio/video clips of competitor activity 12
- 13. Be Visual – You Are the Film Editor 13
- 14. NY Times Example http://www.nytimes.com/interactive/2008/09/15 /business/20080916-treemap-graphic.html link next 14
- 15. NY Times Example 15
- 16. This? 16
- 17. Or This? 17
- 18. Make It Easy for You and Your Audience Telling a story should be simple and direct recall and action will be that much stronger No hoop jumping State 2-3 key issues and how they 23 relate to your audience 18
- 19. This? 19
- 20. Or This? 20
- 21. How You Invite Discussion Identify yourself – share something about yourself Limit it to 3 key points on crafting your story Focus on highlighting what the audience needs Invite them to continue the discussion: Blogs Intranets Discussion Boards 21
- 22. Be Ready for Interactivity Creative ways to access and interact with the data Anticipate questions Can you be “real-time” with your answers? “Real-time” examples 22
- 23. I hear and I forget. ea a d o ge . I see and I remember. I do and I understand. – Confucius Questions Resources National Storytelling Network www.storynet.org Perceptual Edge www.perceptualedge.com g g Presentation Zen by Garr Reynolds Examples www.tableausoftware.com/examples Contact Susan – sjmooremarketing@gmail.com Elissa – efink@tableausoftware.com 23