Recommended

Recommended
More Related Content
Similar to Valassis cashing-in-cpg-coupons
Similar to Valassis cashing-in-cpg-coupons (20)
Recently uploaded
Recently uploaded (20)
Valassis cashing-in-cpg-coupons
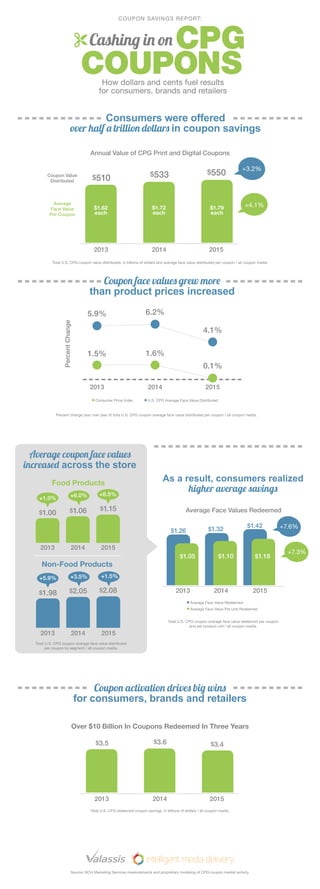
- 1. Consumers were offered over half a trillion dollars in coupon savings Source: NCH Marketing Services measurements and proprietary modeling of CPG coupon market activity. $1.62 each $1.72 each $1.79 each 2013 2014 2015 Coupon Value Distributed Average Face Value Per Coupon +3.2% $510 $533 $550 +4.1% 2013 2014 2015 PercentChange 5.9% Coupon face values grew more than product prices increased Percent change year over year of total U.S. CPG coupon average face value distributed per coupon / all coupon media. 1.5% 6.2% 1.6% 4.1% 0.1% Consumer Price Index U.S. CPG Average Face Value Distributed 2013 2014 2015 $3.5 $3.6 $3.4 Total U.S. CPG redeemed coupon savings, in billions of dollars / all coupon media. Over $10 Billion In Coupons Redeemed In Three Years Annual Value of CPG Print and Digital Coupons Coupon activation drives big wins for consumers, brands and retailers Average coupon face values increased across the store Total U.S. CPG coupon average face value distributed per coupon by segment / all coupon media. 2013 2014 2015 $1.00 $1.06 $1.15 +1.0% +6.0% +8.5% Food Products $1.98 $2.05 $2.08 2013 2014 2015 +5.9% +3.5% +1.5% Non-Food Products $1.05 $1.10 $1.18 2013 2014 2015 +7.6% As a result, consumers realized higher average savings Total U.S. CPG coupon average face value redeemed per coupon and per product unit / all coupon media. +7.3% $1.26 $1.32 $1.42 Average Face Value Redeemed Average Face Value Per Unit Redeemed Average Face Values Redeemed CPG COUPONSHow dollars and cents fuel results for consumers, brands and retailers Cashing in on COUPON SAVINGS REPORT: Total U.S. CPG coupon value distributed, in billions of dollars and average face value distributed per coupon / all coupon media.