SlideShare a Scribd company logo
1 of 7
prepared by Volkan OBAN
K-Means Clustering with R
library(datasets)
data(attitude)
attitude
rating complaints privileges learning raises critical advance
1 43 51 30 39 61 92 45
2 63 64 51 54 63 73 47
3 71 70 68 69 76 86 48
4 61 63 45 47 54 84 35
5 81 78 56 66 71 83 47
6 43 55 49 44 54 49 34
7 58 67 42 56 66 68 35
8 71 75 50 55 70 66 41
9 72 82 72 67 71 83 31
10 67 61 45 47 62 80 41
11 64 53 53 58 58 67 34
12 67 60 47 39 59 74 41
13 69 62 57 42 55 63 25
14 68 83 83 45 59 77 35
15 77 77 54 72 79 77 46
16 81 90 50 72 60 54 36
17 74 85 64 69 79 79 63
18 65 60 65 75 55 80 60
19 65 70 46 57 75 85 46
20 50 58 68 54 64 78 52
21 50 40 33 34 43 64 33
22 64 61 52 62 66 80 41
23 53 66 52 50 63 80 37
24 40 37 42 58 50 57 49
25 63 54 42 48 66 75 33
26 66 77 66 63 88 76 72
27 78 75 58 74 80 78 49
28 48 57 44 45 51 83 38
29 85 85 71 71 77 74 55
30 82 82 39 59 64 78 39
datset.seed(7)
cl = kmeans(dat, 6, nstart=100)
cl
> cl = kmeans(dat, 3, nstart=100)
>
> # Examine the result of the clustering algorithm
> cl
K-means clustering with 3 clusters of sizes 11, 2, 17
Cluster means:
privileges learning
1 61.45455 69.09091
2 75.50000 49.50000
3 45.11765 48.94118
Clustering vector:
[1] 3 3 1 3 1 3 3 3 1 3 3 3 3 2 1 1 1 1 3 2 3 1 3 3 3 1 1 3 1 3
Within cluster sum of squares by cluster:
[1] 783.6364 153.0000 1732.7059
(between_SS / total_SS = 68.0 %)
Available components:
[1] "cluster" "centers" "totss" "withinss"
[5] "tot.withinss" "betweenss" "size" "iter"
[9] "ifaul
plot(dat, col =(cl$cluster +1) , main="K-Means result with 3 clusters", pch
=20, cex=2)
> mydata <- dat
> wss <- (nrow(mydata)-1)*sum(apply(mydata,2,var))
> for (i in 2:15) wss[i] <- sum(kmeans(mydata,
+ centers=i)$withinss)
> plot(1:15, wss, type="b", xlab="Number of Clusters",
+ ylab="Within groups sum of squares",
+ main="Assessing the Optimal Number of Clusters with the Elbow Method
",
+ pch=20, cex=2)
Ref:https://rpubs.com/FelipeRego/K-Means-Clustering
Felipe Rego
> clustergram.kmeans <- function(Data, k, ...)
+ {
+ # this is the type of function that the clustergram
+ # function takes for the clustering.
+ # using similar structure will allow implementation of differe
nt clustering algorithms
+
+ # It returns a list with two elements:
+ # cluster = a vector of length of n (the number of subjects/items)
+ # indicating to which cluster each item belong
s.
+ # centers = a k dimensional vector. Each element is 1 number that re
present that cluster
+ # In our case, we are using the weighted mean
of the cluster dimensions by
+ # Using the first component (loading) of the P
CA of the Data.
+
+ cl <- kmeans(Data, k,...)
+
+ cluster <- cl$cluster
+ centers <- cl$centers %*% princomp(Data)$loadings[,1] # 1 number per
center
+ # here we are using the weighted mean for each
+
+ return(list(
+ cluster = cluster,
+ centers = centers
+ ))
+ }
>
> clustergram.plot.matlines <- function(X,Y, k.range,
+ x.range, y.range , COL,
+ add.center.points , centers.points)
+ {
+ plot(0,0, col = "white", xlim = x.range, ylim = y.range,
+ axes = F,
+ xlab = "Number of clusters (k)", ylab = "PCA weighted Mean of th
e clusters", main = "Clustergram of the PCA-weighted Mean of the clusters k
-mean clusters vs number of clusters (k)")
+ axis(side =1, at = k.range)
+ axis(side =2)
+ abline(v = k.range, col = "grey")
+
+ matlines(t(X), t(Y), pch = 19, col = COL, lty = 1, lwd = 1.5)
+
+ if(add.center.points)
+ {
+ require(plyr)
+
+ xx <- ldply(centers.points, rbind)
+ points(xx$y~xx$x, pch = 19, col = "red", cex = 1.3)
+
+ # add points
+ # temp <- l_ply(centers.points, function(xx) {
+ # with(xx,points(y~x, pch = 19, col = "red", cex = 1.3))
+ # points(xx$y~xx$x, pch = 19, col = "red", cex = 1.3)
+ # return(1)
+ # })
+ # We assign the lapply to a variable (temp) only to suppress the
lapply "NULL" output
+ }
+ }
>
>
>
> clustergram <- function(Data, k.range = 2:10 ,
+ clustering.function = clustergram.kmeans,
+ clustergram.plot = clustergram.plot.matlines,
+ line.width = .004, add.center.points = T)
+ {
+ # Data - should be a scales matrix. Where each column belongs to a d
ifferent dimension of the observations
+ # k.range - is a vector with the number of clusters to plot the clust
ergram for
+ # clustering.function - this is not really used, but offers a bases t
o later extend the function to other algorithms
+ # Although that would more work on the code
+ # line.width - is the amount to lift each line in the plot so they wo
n't superimpose eachother
+ # add.center.points - just assures that we want to plot points of the
cluster means
+
+ n <- dim(Data)[1]
+
+ PCA.1 <- Data %*% princomp(Data)$loadings[,1] # first principal comp
onent of our data
+
+ if(require(colorspace)) {
+ COL <- heat_hcl(n)[order(PCA.1)] # line colors
+ } else {
+ COL <- rainbow(n)[order(PCA.1)] # line colors
+ warning('Please consider installing the package "colorspace" for
prittier colors')
+ }
+
+ line.width <- rep(line.width, n)
+
+ Y <- NULL # Y matrix
+ X <- NULL # X matrix
+
+ centers.points <- list()
+
+ for(k in k.range)
+ {
+ k.clusters <- clustering.function(Data, k)
+
+ clusters.vec <- k.clusters$cluster
+ # the.centers <- apply(cl$centers,1, mean)
+ the.centers <- k.clusters$centers
+
+ noise <- unlist(tapply(line.width, clusters.vec, cumsum))[order(s
eq_along(clusters.vec)[order(clusters.vec)])]
+ # noise <- noise - mean(range(noise))
+ y <- the.centers[clusters.vec] + noise
+ Y <- cbind(Y, y)
+ x <- rep(k, length(y))
+ X <- cbind(X, x)
+
+ centers.points[[k]] <- data.frame(y = the.centers , x = rep(k , k
))
+ # points(the.centers ~ rep(k , k), pch = 19, col = "red", cex
= 1.5)
+ }
+
+
+ x.range <- range(k.range)
+ y.range <- range(PCA.1)
+
+ clustergram.plot(X,Y, k.range,
+ x.range, y.range , COL,
+ add.center.points , centers.points)
+
+
+ }
> set.seed(250)
> data("attitude")
> Data <- scale(attitude[,-5])
> clustergram(Data, k.range = 2:8, line.width = 0.004)
> par(cex.lab = 1.2, cex.main = .7)
> par(mfrow = c(3,2))
> for(i in 1:6) clustergram(Data, k.range = 2:8 , line.width = .004, add.ce
nter.points = T)

More Related Content

What's hot

KRUSKAL'S algorithm from chaitra
KRUSKAL'S algorithm from chaitraKRUSKAL'S algorithm from chaitra
KRUSKAL'S algorithm from chaitra
guest1f4fb3
 
NumPyの歴史とPythonの並行処理【PyData.tokyo One-day Conference 2018】
NumPyの歴史とPythonの並行処理【PyData.tokyo One-day Conference 2018】NumPyの歴史とPythonの並行処理【PyData.tokyo One-day Conference 2018】
NumPyの歴史とPythonの並行処理【PyData.tokyo One-day Conference 2018】
Atsuo Ishimoto
 

What's hot (20)

KRUSKAL'S algorithm from chaitra
KRUSKAL'S algorithm from chaitraKRUSKAL'S algorithm from chaitra
KRUSKAL'S algorithm from chaitra
 
Symbolic Regression on Network Properties
Symbolic Regression on Network PropertiesSymbolic Regression on Network Properties
Symbolic Regression on Network Properties
 
M|18 Taking Advantage of Common Table Expressions
M|18 Taking Advantage of Common Table ExpressionsM|18 Taking Advantage of Common Table Expressions
M|18 Taking Advantage of Common Table Expressions
 
Mosaic plot in R.
Mosaic plot in R.Mosaic plot in R.
Mosaic plot in R.
 
Digit recognizer by convolutional neural network
Digit recognizer by convolutional neural networkDigit recognizer by convolutional neural network
Digit recognizer by convolutional neural network
 
NTHU AI Reading Group: Improved Training of Wasserstein GANs
NTHU AI Reading Group: Improved Training of Wasserstein GANsNTHU AI Reading Group: Improved Training of Wasserstein GANs
NTHU AI Reading Group: Improved Training of Wasserstein GANs
 
NumPyの歴史とPythonの並行処理【PyData.tokyo One-day Conference 2018】
NumPyの歴史とPythonの並行処理【PyData.tokyo One-day Conference 2018】NumPyの歴史とPythonの並行処理【PyData.tokyo One-day Conference 2018】
NumPyの歴史とPythonの並行処理【PyData.tokyo One-day Conference 2018】
 
Ee693 sept2014quizgt1
Ee693 sept2014quizgt1Ee693 sept2014quizgt1
Ee693 sept2014quizgt1
 
Fast, stable and scalable true radix sorting with Matt Dowle at useR! Aalborg
Fast, stable and scalable true radix sorting with Matt Dowle at useR! AalborgFast, stable and scalable true radix sorting with Matt Dowle at useR! Aalborg
Fast, stable and scalable true radix sorting with Matt Dowle at useR! Aalborg
 
Ee693 sept2014quizgt2
Ee693 sept2014quizgt2Ee693 sept2014quizgt2
Ee693 sept2014quizgt2
 
DSP 06 _ Sheet Six
DSP 06 _ Sheet SixDSP 06 _ Sheet Six
DSP 06 _ Sheet Six
 
A framework for practical fast matrix multiplication
A framework for practical fast matrix multiplication�A framework for practical fast matrix multiplication�
A framework for practical fast matrix multiplication
 
Ch8
Ch8Ch8
Ch8
 
Igraph
IgraphIgraph
Igraph
 
Low-rank matrix approximations in Python by Christian Thurau PyData 2014
Low-rank matrix approximations in Python by Christian Thurau PyData 2014Low-rank matrix approximations in Python by Christian Thurau PyData 2014
Low-rank matrix approximations in Python by Christian Thurau PyData 2014
 
fast-matmul-ppopp2015
fast-matmul-ppopp2015fast-matmul-ppopp2015
fast-matmul-ppopp2015
 
Algebraic data types: Semilattices
Algebraic data types: SemilatticesAlgebraic data types: Semilattices
Algebraic data types: Semilattices
 
Algorithms explained
Algorithms explainedAlgorithms explained
Algorithms explained
 
Backtraking pic&amp;def
Backtraking pic&amp;defBacktraking pic&amp;def
Backtraking pic&amp;def
 
Heaps
HeapsHeaps
Heaps
 

Viewers also liked

Program_Cluster_Analysis
Program_Cluster_AnalysisProgram_Cluster_Analysis
Program_Cluster_Analysis
Sammya Sengupta
 

Viewers also liked (7)

jsm2015: the dendextend R package
jsm2015: the dendextend R packagejsm2015: the dendextend R package
jsm2015: the dendextend R package
 
Program_Cluster_Analysis
Program_Cluster_AnalysisProgram_Cluster_Analysis
Program_Cluster_Analysis
 
slides Céline Beji
slides Céline Bejislides Céline Beji
slides Céline Beji
 
Spring Mvc Rest
Spring Mvc RestSpring Mvc Rest
Spring Mvc Rest
 
Workshop Guide: RESTful Java Web Application with Spring Boot
Workshop Guide: RESTful Java Web Application with Spring BootWorkshop Guide: RESTful Java Web Application with Spring Boot
Workshop Guide: RESTful Java Web Application with Spring Boot
 
K-Means Clustering Algorithm - Cluster Analysis | Machine Learning Algorithm ...
K-Means Clustering Algorithm - Cluster Analysis | Machine Learning Algorithm ...K-Means Clustering Algorithm - Cluster Analysis | Machine Learning Algorithm ...
K-Means Clustering Algorithm - Cluster Analysis | Machine Learning Algorithm ...
 
What Is Data Science? Data Science Course - Data Science Tutorial For Beginne...
What Is Data Science? Data Science Course - Data Science Tutorial For Beginne...What Is Data Science? Data Science Course - Data Science Tutorial For Beginne...
What Is Data Science? Data Science Course - Data Science Tutorial For Beginne...
 

Similar to k-means Clustering and Custergram with R

Seminar PSU 09.04.2013 - 10.04.2013 MiFIT, Arbuzov Vyacheslav
Seminar PSU 09.04.2013 - 10.04.2013 MiFIT, Arbuzov VyacheslavSeminar PSU 09.04.2013 - 10.04.2013 MiFIT, Arbuzov Vyacheslav
Seminar PSU 09.04.2013 - 10.04.2013 MiFIT, Arbuzov Vyacheslav
Vyacheslav Arbuzov
 

Similar to k-means Clustering and Custergram with R (20)

K Means Clustering in ML.pptx
K Means Clustering in ML.pptxK Means Clustering in ML.pptx
K Means Clustering in ML.pptx
 
R programming language
R programming languageR programming language
R programming language
 
Advanced Data Visualization Examples with R-Part II
Advanced Data Visualization Examples with R-Part IIAdvanced Data Visualization Examples with R-Part II
Advanced Data Visualization Examples with R-Part II
 
A quick introduction to R
A quick introduction to RA quick introduction to R
A quick introduction to R
 
Introduction to Machine Learning
Introduction to Machine LearningIntroduction to Machine Learning
Introduction to Machine Learning
 
R Programming Intro
R Programming IntroR Programming Intro
R Programming Intro
 
Basic R Data Manipulation
Basic R Data ManipulationBasic R Data Manipulation
Basic R Data Manipulation
 
Seminar PSU 09.04.2013 - 10.04.2013 MiFIT, Arbuzov Vyacheslav
Seminar PSU 09.04.2013 - 10.04.2013 MiFIT, Arbuzov VyacheslavSeminar PSU 09.04.2013 - 10.04.2013 MiFIT, Arbuzov Vyacheslav
Seminar PSU 09.04.2013 - 10.04.2013 MiFIT, Arbuzov Vyacheslav
 
Time Series Analysis and Mining with R
Time Series Analysis and Mining with RTime Series Analysis and Mining with R
Time Series Analysis and Mining with R
 
[1062BPY12001] Data analysis with R / week 2
[1062BPY12001] Data analysis with R / week 2[1062BPY12001] Data analysis with R / week 2
[1062BPY12001] Data analysis with R / week 2
 
Seminar PSU 10.10.2014 mme
Seminar PSU 10.10.2014 mmeSeminar PSU 10.10.2014 mme
Seminar PSU 10.10.2014 mme
 
Table of Useful R commands.
Table of Useful R commands.Table of Useful R commands.
Table of Useful R commands.
 
Machine Learning in R
Machine Learning in RMachine Learning in R
Machine Learning in R
 
R programming
R programmingR programming
R programming
 
Optimization and Mathematical Programming in R and ROI - R Optimization Infra...
Optimization and Mathematical Programming in R and ROI - R Optimization Infra...Optimization and Mathematical Programming in R and ROI - R Optimization Infra...
Optimization and Mathematical Programming in R and ROI - R Optimization Infra...
 
R Language Introduction
R Language IntroductionR Language Introduction
R Language Introduction
 
Big Data Mining in Indian Economic Survey 2017
Big Data Mining in Indian Economic Survey 2017Big Data Mining in Indian Economic Survey 2017
Big Data Mining in Indian Economic Survey 2017
 
Joclad 2010 d
Joclad 2010 dJoclad 2010 d
Joclad 2010 d
 
Introduction to Neural Networks and Deep Learning from Scratch
Introduction to Neural Networks and Deep Learning from ScratchIntroduction to Neural Networks and Deep Learning from Scratch
Introduction to Neural Networks and Deep Learning from Scratch
 
Introduction to MATLAB
Introduction to MATLABIntroduction to MATLAB
Introduction to MATLAB
 

More from Dr. Volkan OBAN

More from Dr. Volkan OBAN (20)

Conference Paper:IMAGE PROCESSING AND OBJECT DETECTION APPLICATION: INSURANCE...
Conference Paper:IMAGE PROCESSING AND OBJECT DETECTION APPLICATION: INSURANCE...Conference Paper:IMAGE PROCESSING AND OBJECT DETECTION APPLICATION: INSURANCE...
Conference Paper:IMAGE PROCESSING AND OBJECT DETECTION APPLICATION: INSURANCE...
 
Covid19py Python Package - Example
Covid19py  Python Package - ExampleCovid19py  Python Package - Example
Covid19py Python Package - Example
 
Object detection with Python
Object detection with Python Object detection with Python
Object detection with Python
 
Python - Rastgele Orman(Random Forest) Parametreleri
Python - Rastgele Orman(Random Forest) ParametreleriPython - Rastgele Orman(Random Forest) Parametreleri
Python - Rastgele Orman(Random Forest) Parametreleri
 
Linear Programming wi̇th R - Examples
Linear Programming wi̇th R - ExamplesLinear Programming wi̇th R - Examples
Linear Programming wi̇th R - Examples
 
"optrees" package in R and examples.(optrees:finds optimal trees in weighted ...
"optrees" package in R and examples.(optrees:finds optimal trees in weighted ..."optrees" package in R and examples.(optrees:finds optimal trees in weighted ...
"optrees" package in R and examples.(optrees:finds optimal trees in weighted ...
 
k-means Clustering in Python
k-means Clustering in Pythonk-means Clustering in Python
k-means Clustering in Python
 
Naive Bayes Example using R
Naive Bayes Example using  R Naive Bayes Example using  R
Naive Bayes Example using R
 
R forecasting Example
R forecasting ExampleR forecasting Example
R forecasting Example
 
Data Science and its Relationship to Big Data and Data-Driven Decision Making
Data Science and its Relationship to Big Data and Data-Driven Decision MakingData Science and its Relationship to Big Data and Data-Driven Decision Making
Data Science and its Relationship to Big Data and Data-Driven Decision Making
 
Data Visualization with R.ggplot2 and its extensions examples.
Data Visualization with R.ggplot2 and its extensions examples.Data Visualization with R.ggplot2 and its extensions examples.
Data Visualization with R.ggplot2 and its extensions examples.
 
Scikit-learn Cheatsheet-Python
Scikit-learn Cheatsheet-PythonScikit-learn Cheatsheet-Python
Scikit-learn Cheatsheet-Python
 
Python Pandas for Data Science cheatsheet
Python Pandas for Data Science cheatsheet Python Pandas for Data Science cheatsheet
Python Pandas for Data Science cheatsheet
 
Pandas,scipy,numpy cheatsheet
Pandas,scipy,numpy cheatsheetPandas,scipy,numpy cheatsheet
Pandas,scipy,numpy cheatsheet
 
ReporteRs package in R. forming powerpoint documents-an example
ReporteRs package in R. forming powerpoint documents-an exampleReporteRs package in R. forming powerpoint documents-an example
ReporteRs package in R. forming powerpoint documents-an example
 
ReporteRs package in R. forming powerpoint documents-an example
ReporteRs package in R. forming powerpoint documents-an exampleReporteRs package in R. forming powerpoint documents-an example
ReporteRs package in R. forming powerpoint documents-an example
 
R-ggplot2 package Examples
R-ggplot2 package ExamplesR-ggplot2 package Examples
R-ggplot2 package Examples
 
R Machine Learning packages( generally used)
R Machine Learning packages( generally used)R Machine Learning packages( generally used)
R Machine Learning packages( generally used)
 
treemap package in R and examples.
treemap package in R and examples.treemap package in R and examples.
treemap package in R and examples.
 
imager package in R and examples..
imager package in R and examples..imager package in R and examples..
imager package in R and examples..
 

Recently uploaded

Top profile Call Girls In Indore [ 7014168258 ] Call Me For Genuine Models We...
Top profile Call Girls In Indore [ 7014168258 ] Call Me For Genuine Models We...Top profile Call Girls In Indore [ 7014168258 ] Call Me For Genuine Models We...
Top profile Call Girls In Indore [ 7014168258 ] Call Me For Genuine Models We...
gajnagarg
 
Reconciling Conflicting Data Curation Actions: Transparency Through Argument...
Reconciling Conflicting Data Curation Actions:  Transparency Through Argument...Reconciling Conflicting Data Curation Actions:  Transparency Through Argument...
Reconciling Conflicting Data Curation Actions: Transparency Through Argument...
Bertram Ludäscher
 
Top profile Call Girls In Hapur [ 7014168258 ] Call Me For Genuine Models We ...
Top profile Call Girls In Hapur [ 7014168258 ] Call Me For Genuine Models We ...Top profile Call Girls In Hapur [ 7014168258 ] Call Me For Genuine Models We ...
Top profile Call Girls In Hapur [ 7014168258 ] Call Me For Genuine Models We ...
nirzagarg
 
Top profile Call Girls In Tumkur [ 7014168258 ] Call Me For Genuine Models We...
Top profile Call Girls In Tumkur [ 7014168258 ] Call Me For Genuine Models We...Top profile Call Girls In Tumkur [ 7014168258 ] Call Me For Genuine Models We...
Top profile Call Girls In Tumkur [ 7014168258 ] Call Me For Genuine Models We...
nirzagarg
 
Top profile Call Girls In Satna [ 7014168258 ] Call Me For Genuine Models We ...
Top profile Call Girls In Satna [ 7014168258 ] Call Me For Genuine Models We ...Top profile Call Girls In Satna [ 7014168258 ] Call Me For Genuine Models We ...
Top profile Call Girls In Satna [ 7014168258 ] Call Me For Genuine Models We ...
nirzagarg
 
Sealdah % High Class Call Girls Kolkata - 450+ Call Girl Cash Payment 8005736...
Sealdah % High Class Call Girls Kolkata - 450+ Call Girl Cash Payment 8005736...Sealdah % High Class Call Girls Kolkata - 450+ Call Girl Cash Payment 8005736...
Sealdah % High Class Call Girls Kolkata - 450+ Call Girl Cash Payment 8005736...
HyderabadDolls
 
Top profile Call Girls In Chandrapur [ 7014168258 ] Call Me For Genuine Model...
Top profile Call Girls In Chandrapur [ 7014168258 ] Call Me For Genuine Model...Top profile Call Girls In Chandrapur [ 7014168258 ] Call Me For Genuine Model...
Top profile Call Girls In Chandrapur [ 7014168258 ] Call Me For Genuine Model...
gajnagarg
 
Jual obat aborsi Bandung ( 085657271886 ) Cytote pil telat bulan penggugur ka...
Jual obat aborsi Bandung ( 085657271886 ) Cytote pil telat bulan penggugur ka...Jual obat aborsi Bandung ( 085657271886 ) Cytote pil telat bulan penggugur ka...
Jual obat aborsi Bandung ( 085657271886 ) Cytote pil telat bulan penggugur ka...
Klinik kandungan
 
Computer science Sql cheat sheet.pdf.pdf
Computer science Sql cheat sheet.pdf.pdfComputer science Sql cheat sheet.pdf.pdf
Computer science Sql cheat sheet.pdf.pdf
SayantanBiswas37
 
Top profile Call Girls In dimapur [ 7014168258 ] Call Me For Genuine Models W...
Top profile Call Girls In dimapur [ 7014168258 ] Call Me For Genuine Models W...Top profile Call Girls In dimapur [ 7014168258 ] Call Me For Genuine Models W...
Top profile Call Girls In dimapur [ 7014168258 ] Call Me For Genuine Models W...
gajnagarg
 
如何办理英国诺森比亚大学毕业证(NU毕业证书)成绩单原件一模一样
如何办理英国诺森比亚大学毕业证(NU毕业证书)成绩单原件一模一样如何办理英国诺森比亚大学毕业证(NU毕业证书)成绩单原件一模一样
如何办理英国诺森比亚大学毕业证(NU毕业证书)成绩单原件一模一样
wsppdmt
 
Jual Obat Aborsi Surabaya ( Asli No.1 ) 085657271886 Obat Penggugur Kandungan...
Jual Obat Aborsi Surabaya ( Asli No.1 ) 085657271886 Obat Penggugur Kandungan...Jual Obat Aborsi Surabaya ( Asli No.1 ) 085657271886 Obat Penggugur Kandungan...
Jual Obat Aborsi Surabaya ( Asli No.1 ) 085657271886 Obat Penggugur Kandungan...
ZurliaSoop
 

Recently uploaded (20)

Top profile Call Girls In Indore [ 7014168258 ] Call Me For Genuine Models We...
Top profile Call Girls In Indore [ 7014168258 ] Call Me For Genuine Models We...Top profile Call Girls In Indore [ 7014168258 ] Call Me For Genuine Models We...
Top profile Call Girls In Indore [ 7014168258 ] Call Me For Genuine Models We...
 
Digital Advertising Lecture for Advanced Digital & Social Media Strategy at U...
Digital Advertising Lecture for Advanced Digital & Social Media Strategy at U...Digital Advertising Lecture for Advanced Digital & Social Media Strategy at U...
Digital Advertising Lecture for Advanced Digital & Social Media Strategy at U...
 
Reconciling Conflicting Data Curation Actions: Transparency Through Argument...
Reconciling Conflicting Data Curation Actions:  Transparency Through Argument...Reconciling Conflicting Data Curation Actions:  Transparency Through Argument...
Reconciling Conflicting Data Curation Actions: Transparency Through Argument...
 
TrafficWave Generator Will Instantly drive targeted and engaging traffic back...
TrafficWave Generator Will Instantly drive targeted and engaging traffic back...TrafficWave Generator Will Instantly drive targeted and engaging traffic back...
TrafficWave Generator Will Instantly drive targeted and engaging traffic back...
 
Nirala Nagar / Cheap Call Girls In Lucknow Phone No 9548273370 Elite Escort S...
Nirala Nagar / Cheap Call Girls In Lucknow Phone No 9548273370 Elite Escort S...Nirala Nagar / Cheap Call Girls In Lucknow Phone No 9548273370 Elite Escort S...
Nirala Nagar / Cheap Call Girls In Lucknow Phone No 9548273370 Elite Escort S...
 
Charbagh + Female Escorts Service in Lucknow | Starting ₹,5K To @25k with A/C...
Charbagh + Female Escorts Service in Lucknow | Starting ₹,5K To @25k with A/C...Charbagh + Female Escorts Service in Lucknow | Starting ₹,5K To @25k with A/C...
Charbagh + Female Escorts Service in Lucknow | Starting ₹,5K To @25k with A/C...
 
Dubai Call Girls Peeing O525547819 Call Girls Dubai
Dubai Call Girls Peeing O525547819 Call Girls DubaiDubai Call Girls Peeing O525547819 Call Girls Dubai
Dubai Call Girls Peeing O525547819 Call Girls Dubai
 
Digital Transformation Playbook by Graham Ware
Digital Transformation Playbook by Graham WareDigital Transformation Playbook by Graham Ware
Digital Transformation Playbook by Graham Ware
 
Top profile Call Girls In Hapur [ 7014168258 ] Call Me For Genuine Models We ...
Top profile Call Girls In Hapur [ 7014168258 ] Call Me For Genuine Models We ...Top profile Call Girls In Hapur [ 7014168258 ] Call Me For Genuine Models We ...
Top profile Call Girls In Hapur [ 7014168258 ] Call Me For Genuine Models We ...
 
Top profile Call Girls In Tumkur [ 7014168258 ] Call Me For Genuine Models We...
Top profile Call Girls In Tumkur [ 7014168258 ] Call Me For Genuine Models We...Top profile Call Girls In Tumkur [ 7014168258 ] Call Me For Genuine Models We...
Top profile Call Girls In Tumkur [ 7014168258 ] Call Me For Genuine Models We...
 
Top profile Call Girls In Satna [ 7014168258 ] Call Me For Genuine Models We ...
Top profile Call Girls In Satna [ 7014168258 ] Call Me For Genuine Models We ...Top profile Call Girls In Satna [ 7014168258 ] Call Me For Genuine Models We ...
Top profile Call Girls In Satna [ 7014168258 ] Call Me For Genuine Models We ...
 
SAC 25 Final National, Regional & Local Angel Group Investing Insights 2024 0...
SAC 25 Final National, Regional & Local Angel Group Investing Insights 2024 0...SAC 25 Final National, Regional & Local Angel Group Investing Insights 2024 0...
SAC 25 Final National, Regional & Local Angel Group Investing Insights 2024 0...
 
Sealdah % High Class Call Girls Kolkata - 450+ Call Girl Cash Payment 8005736...
Sealdah % High Class Call Girls Kolkata - 450+ Call Girl Cash Payment 8005736...Sealdah % High Class Call Girls Kolkata - 450+ Call Girl Cash Payment 8005736...
Sealdah % High Class Call Girls Kolkata - 450+ Call Girl Cash Payment 8005736...
 
Top profile Call Girls In Chandrapur [ 7014168258 ] Call Me For Genuine Model...
Top profile Call Girls In Chandrapur [ 7014168258 ] Call Me For Genuine Model...Top profile Call Girls In Chandrapur [ 7014168258 ] Call Me For Genuine Model...
Top profile Call Girls In Chandrapur [ 7014168258 ] Call Me For Genuine Model...
 
Jual obat aborsi Bandung ( 085657271886 ) Cytote pil telat bulan penggugur ka...
Jual obat aborsi Bandung ( 085657271886 ) Cytote pil telat bulan penggugur ka...Jual obat aborsi Bandung ( 085657271886 ) Cytote pil telat bulan penggugur ka...
Jual obat aborsi Bandung ( 085657271886 ) Cytote pil telat bulan penggugur ka...
 
Gomti Nagar & best call girls in Lucknow | 9548273370 Independent Escorts & D...
Gomti Nagar & best call girls in Lucknow | 9548273370 Independent Escorts & D...Gomti Nagar & best call girls in Lucknow | 9548273370 Independent Escorts & D...
Gomti Nagar & best call girls in Lucknow | 9548273370 Independent Escorts & D...
 
Computer science Sql cheat sheet.pdf.pdf
Computer science Sql cheat sheet.pdf.pdfComputer science Sql cheat sheet.pdf.pdf
Computer science Sql cheat sheet.pdf.pdf
 
Top profile Call Girls In dimapur [ 7014168258 ] Call Me For Genuine Models W...
Top profile Call Girls In dimapur [ 7014168258 ] Call Me For Genuine Models W...Top profile Call Girls In dimapur [ 7014168258 ] Call Me For Genuine Models W...
Top profile Call Girls In dimapur [ 7014168258 ] Call Me For Genuine Models W...
 
如何办理英国诺森比亚大学毕业证(NU毕业证书)成绩单原件一模一样
如何办理英国诺森比亚大学毕业证(NU毕业证书)成绩单原件一模一样如何办理英国诺森比亚大学毕业证(NU毕业证书)成绩单原件一模一样
如何办理英国诺森比亚大学毕业证(NU毕业证书)成绩单原件一模一样
 
Jual Obat Aborsi Surabaya ( Asli No.1 ) 085657271886 Obat Penggugur Kandungan...
Jual Obat Aborsi Surabaya ( Asli No.1 ) 085657271886 Obat Penggugur Kandungan...Jual Obat Aborsi Surabaya ( Asli No.1 ) 085657271886 Obat Penggugur Kandungan...
Jual Obat Aborsi Surabaya ( Asli No.1 ) 085657271886 Obat Penggugur Kandungan...
 

k-means Clustering and Custergram with R

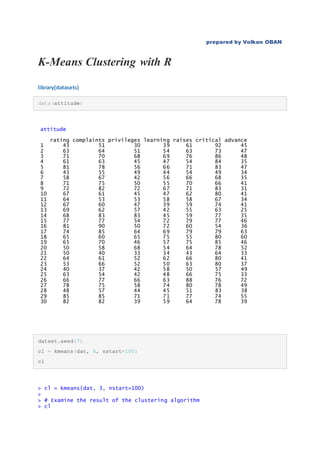
  • 1. prepared by Volkan OBAN K-Means Clustering with R library(datasets) data(attitude) attitude rating complaints privileges learning raises critical advance 1 43 51 30 39 61 92 45 2 63 64 51 54 63 73 47 3 71 70 68 69 76 86 48 4 61 63 45 47 54 84 35 5 81 78 56 66 71 83 47 6 43 55 49 44 54 49 34 7 58 67 42 56 66 68 35 8 71 75 50 55 70 66 41 9 72 82 72 67 71 83 31 10 67 61 45 47 62 80 41 11 64 53 53 58 58 67 34 12 67 60 47 39 59 74 41 13 69 62 57 42 55 63 25 14 68 83 83 45 59 77 35 15 77 77 54 72 79 77 46 16 81 90 50 72 60 54 36 17 74 85 64 69 79 79 63 18 65 60 65 75 55 80 60 19 65 70 46 57 75 85 46 20 50 58 68 54 64 78 52 21 50 40 33 34 43 64 33 22 64 61 52 62 66 80 41 23 53 66 52 50 63 80 37 24 40 37 42 58 50 57 49 25 63 54 42 48 66 75 33 26 66 77 66 63 88 76 72 27 78 75 58 74 80 78 49 28 48 57 44 45 51 83 38 29 85 85 71 71 77 74 55 30 82 82 39 59 64 78 39 datset.seed(7) cl = kmeans(dat, 6, nstart=100) cl > cl = kmeans(dat, 3, nstart=100) > > # Examine the result of the clustering algorithm > cl
  • 2. K-means clustering with 3 clusters of sizes 11, 2, 17 Cluster means: privileges learning 1 61.45455 69.09091 2 75.50000 49.50000 3 45.11765 48.94118 Clustering vector: [1] 3 3 1 3 1 3 3 3 1 3 3 3 3 2 1 1 1 1 3 2 3 1 3 3 3 1 1 3 1 3 Within cluster sum of squares by cluster: [1] 783.6364 153.0000 1732.7059 (between_SS / total_SS = 68.0 %) Available components: [1] "cluster" "centers" "totss" "withinss" [5] "tot.withinss" "betweenss" "size" "iter" [9] "ifaul plot(dat, col =(cl$cluster +1) , main="K-Means result with 3 clusters", pch =20, cex=2)
  • 3. > mydata <- dat > wss <- (nrow(mydata)-1)*sum(apply(mydata,2,var)) > for (i in 2:15) wss[i] <- sum(kmeans(mydata, + centers=i)$withinss) > plot(1:15, wss, type="b", xlab="Number of Clusters", + ylab="Within groups sum of squares", + main="Assessing the Optimal Number of Clusters with the Elbow Method ", + pch=20, cex=2) Ref:https://rpubs.com/FelipeRego/K-Means-Clustering Felipe Rego
  • 4. > clustergram.kmeans <- function(Data, k, ...) + { + # this is the type of function that the clustergram + # function takes for the clustering. + # using similar structure will allow implementation of differe nt clustering algorithms + + # It returns a list with two elements: + # cluster = a vector of length of n (the number of subjects/items) + # indicating to which cluster each item belong s. + # centers = a k dimensional vector. Each element is 1 number that re present that cluster + # In our case, we are using the weighted mean of the cluster dimensions by + # Using the first component (loading) of the P CA of the Data. + + cl <- kmeans(Data, k,...) + + cluster <- cl$cluster + centers <- cl$centers %*% princomp(Data)$loadings[,1] # 1 number per center + # here we are using the weighted mean for each + + return(list( + cluster = cluster, + centers = centers + )) + } > > clustergram.plot.matlines <- function(X,Y, k.range, + x.range, y.range , COL, + add.center.points , centers.points) + { + plot(0,0, col = "white", xlim = x.range, ylim = y.range, + axes = F, + xlab = "Number of clusters (k)", ylab = "PCA weighted Mean of th e clusters", main = "Clustergram of the PCA-weighted Mean of the clusters k -mean clusters vs number of clusters (k)") + axis(side =1, at = k.range) + axis(side =2) + abline(v = k.range, col = "grey") + + matlines(t(X), t(Y), pch = 19, col = COL, lty = 1, lwd = 1.5) + + if(add.center.points) + { + require(plyr) + + xx <- ldply(centers.points, rbind) + points(xx$y~xx$x, pch = 19, col = "red", cex = 1.3) + + # add points + # temp <- l_ply(centers.points, function(xx) { + # with(xx,points(y~x, pch = 19, col = "red", cex = 1.3)) + # points(xx$y~xx$x, pch = 19, col = "red", cex = 1.3) + # return(1) + # }) + # We assign the lapply to a variable (temp) only to suppress the lapply "NULL" output + }
  • 5. + } > > > > clustergram <- function(Data, k.range = 2:10 , + clustering.function = clustergram.kmeans, + clustergram.plot = clustergram.plot.matlines, + line.width = .004, add.center.points = T) + { + # Data - should be a scales matrix. Where each column belongs to a d ifferent dimension of the observations + # k.range - is a vector with the number of clusters to plot the clust ergram for + # clustering.function - this is not really used, but offers a bases t o later extend the function to other algorithms + # Although that would more work on the code + # line.width - is the amount to lift each line in the plot so they wo n't superimpose eachother + # add.center.points - just assures that we want to plot points of the cluster means + + n <- dim(Data)[1] + + PCA.1 <- Data %*% princomp(Data)$loadings[,1] # first principal comp onent of our data + + if(require(colorspace)) { + COL <- heat_hcl(n)[order(PCA.1)] # line colors + } else { + COL <- rainbow(n)[order(PCA.1)] # line colors + warning('Please consider installing the package "colorspace" for prittier colors') + } + + line.width <- rep(line.width, n) + + Y <- NULL # Y matrix + X <- NULL # X matrix + + centers.points <- list() + + for(k in k.range) + { + k.clusters <- clustering.function(Data, k) + + clusters.vec <- k.clusters$cluster + # the.centers <- apply(cl$centers,1, mean) + the.centers <- k.clusters$centers + + noise <- unlist(tapply(line.width, clusters.vec, cumsum))[order(s eq_along(clusters.vec)[order(clusters.vec)])] + # noise <- noise - mean(range(noise)) + y <- the.centers[clusters.vec] + noise + Y <- cbind(Y, y) + x <- rep(k, length(y)) + X <- cbind(X, x) + + centers.points[[k]] <- data.frame(y = the.centers , x = rep(k , k )) + # points(the.centers ~ rep(k , k), pch = 19, col = "red", cex = 1.5) + }
  • 6. + + + x.range <- range(k.range) + y.range <- range(PCA.1) + + clustergram.plot(X,Y, k.range, + x.range, y.range , COL, + add.center.points , centers.points) + + + } > set.seed(250) > data("attitude") > Data <- scale(attitude[,-5]) > clustergram(Data, k.range = 2:8, line.width = 0.004)
  • 7. > par(cex.lab = 1.2, cex.main = .7) > par(mfrow = c(3,2)) > for(i in 1:6) clustergram(Data, k.range = 2:8 , line.width = .004, add.ce nter.points = T)