SlideShare a Scribd company logo
1 of 58
Download to read offline
Higher College Of Technology


                             January 19


                             2012
By                                        Solar Desalination
Sager Al Musaabi                          Project for Subject
                                          MECH N449
Khalid Alhosani
                                          Dr. Mongi
Waleed AlYafaie
Solar Desalination Project 2012


Abstract ......................................................................................................................................................... 4
The results found from the calculations ....................................................................................................... 5
Introduction .................................................................................................................................................. 6
Type of desalination method ........................................................................................................................ 7
   Multiple effect solar stills.......................................................................................................................... 7
   Humidification–dehumidification systems ............................................................................................... 7
   Economics ................................................................................................................................................. 8
Illustration of solar desalination design ........................................................................................................ 8
Process flow diagram .................................................................................................................................. 12
Project proposal .......................................................................................................................................... 17
The results found from the calculations ..................................................................................................... 18
Literature Review ........................................................................................................................................ 20
   Desalination: .......................................................................................................................................... 21
   Reverse osmosis(RO): ............................................................................................................................. 21
       Process: ............................................................................................................................................... 22
       Industrial Applications ....................................................................................................................... 23
   Multi-stage flash distillation (MSF): ....................................................................................................... 24
       Process: ............................................................................................................................................... 24
       Industrial Applications ........................................................................................................................ 25
   Solar thermal energy: ............................................................................................................................. 25
       Parabolic Trough: ................................................................................................................................ 25
       Solar Power tower: ............................................................................................................................. 26
       Dish Technology: ................................................................................................................................. 26
       Solar Desalination: .............................................................................................................................. 27
   Technology .............................................................................................................................................. 28
Project Time line ......................................................................................................................................... 28
Calculation .................................................................................................................................................. 29      2
   Compare the process with and without vacuum pump ......................................................................... 32
   Calculated area of reflector: ................................................................................................................... 34


                                                                                                             MECH N449 | HCT, Abu Dhabi
Solar Desalination Project 2012
   Calculate the mass flow rate of circulated water ................................................................................... 34
   Calculation of             caused by reflector. .................................................................................................... 35
       Calculation with respect to area of reflector ...................................................................................... 35
   Calculation with respect to fluid type. .................................................................................................... 39
   Calculation on the desalination side. ...................................................................................................... 39
   The effect of attaching vacuum pump to desalination unit ................................................................... 42
   Calculation for parabolic dish ................................................................................................................. 44
Conclusion ................................................................................................................................................... 47
   Ease of safe operation ............................................................................................................................ 47
       Equipment and Clothing ..................................................................................................................... 47
       Surrounding Area ................................................................................................................................ 47
       Starting a Machine .............................................................................................................................. 47
Conclusion ................................................................................................................................................... 47
   Comments on the project: ...................................................................................................................... 48
   Problems encountered ........................................................................................................................... 48
   Recommendations .................................................................................................................................. 49
Appendix ..................................................................................................................................................... 49
   SOLAR RADIATION REACHING THE EARTH SURFACE .............................................................................. 49
   Thermal Conductivity .............................................................................................................................. 52
   Emissivity................................................................................................................................................. 53
Project main part ........................................................................................................................................ 56
References: ................................................................................................................................................. 58


                                                                                                                                                                    3


                                                                                                           MECH N449 | HCT, Abu Dhabi
Solar Desalination Project 2012

Abstract

The main aim of this project is to treated the salty water from the sea or from Groundwater wells

and make it drinkable or usable for aggregation in the united Arabic emirates .Thanks to the

large scale of solar heat available in the region where the UAE located, the utilization of that

source will be investigated in the project. The concept of a solar distillation system uses low

grade heat. The system utilizes vacuum pump or it can use the gravity forces to create vacuum

under which water can be evaporated at lower temperatures than conventional techniques, This

would allow the use of low grade heat sources, such as parabolic solar collectors or even

inexpensive flat plate. A good feature of the system is that the evaporation and condensation

take place at same locations without using another heat source. That helps us in making compact

and portable design. The system consists of solar collectors, an evaporator, and pumps to supply

the salty water and withdraw the concentrated brine and also to create a vacuum in the

evaporator. The evaporator is connected to the condenser where the produced vapor is condensed

and collected as the product. In the use of gravity force to create vacuum both, the evaporator

and condenser are placed at a height of about 10 m (the height required to have a water column

that would balance the atmospheric pressure) from the ground level. The evaporator is connected

to the salty water supply, and concentrated brine tanks, and the condenser is connected to the

fresh water tank. All tanks are kept at the ground level. On the other hand, vacuum pump can be

attached to the evaporator in case of availability of electricity source and space.


In this research the concept of the system will be examine to see the effects of various operating
                                                                                                     4
conditions: size of the evaporator, capacity rate of the pumps, and thermal resistance of material


                                                                    MECH N449 | HCT, Abu Dhabi
Solar Desalination Project 2012
used, and heat source temperature. In addition, approximate estimation of the project cost will be

included at the end of the report to compare with the existing system in market.


The results found from the calculations

To produce amount of 1L per minute of distilled water, we found that it requires an energy

between 52 to 55 kj/kg. Also we have the heat flux of the sun for the earth is about 95012 W/m2.

Therefore, an area of 1 meter square will reflect 950     with emissivity of 1. Another point is the

mass flow rate. As the water has heat capacity of 4.1813         and the volume flow rate of

circulating water is L per minute and the mass flow rate using the formula of (                    ).


Table 1

                                  The results of solar desalination

Parameter                         Formula                              Amount

Heat flux                             95012 W/m2 of the earth          For 1 square meter of area has

                                                                       heat flux of 950 W.

Temperature difference of inlet                                        28

and outlet of heat collection

element.

Heat transfer ( solar side)                                            2435.47 Kw

Heat transfer (desalination                                            2435.47 Kw

side)

Mass flow rate of sea water                                            7.6 Kg/s
                                                                                                        5


                                                                      MECH N449 | HCT, Abu Dhabi
Solar Desalination Project 2012


Introduction

Due to the increase in population growth UAE and in other Arabic gulf countries, the demand of

fresh water has been increase. That increase opposed with shortage of fresh water sources in the

region due to the nature of desert and as an effect of the global warming. The gulf region has

abundant seawater resources and a good level of solar radiation, which could be used to produce

drinking water from seawater. Although everybody recognizes the strong potential of solar

thermal energy to seawater desalination, the process is not yet developed at commercial level.

The main reason for that is the technology considered expensive compared with using facial.

Nevertheless, it is also recognized that there is still important room to improve desalination

systems based on solar thermal energy.


The use of solar distillation has been practiced for a long time, and it gained more attraction after

the First World War. Solar desalination is suitable for remote, arid and semi-arid areas, where

drinking water shortage is a major problem and solar radiation is high. The limitations of solar

energy utilization for desalination are the high initial cost for renewable energy devices and

intermittent nature of the sun. Due to these limitations the present capacity of solar desalination

systems worldwide is about 0.01% of the existing large-scale conventional desalination plants

[3]. So, efforts must be made to develop technologies, which will collect and use renewable
                                                                                                        6
energy more efficiently and cost effectively to provide clean drinking water besides developing

technologies to store this energy to use it whenever it is unavailable.


                                                                   MECH N449 | HCT, Abu Dhabi
Solar Desalination Project 2012
The combination of solar energy with desalination processes can be classified into two main

categories: 100% solar driven desalination plants or partial solar powered desalination plants.

Solar plants could be designed to operate in a fully automatic fashion in the sense that when the

sun rises, heat collection process is initiated automatically by a sensor measuring the solar

radiation.


Type of desalination method

       Multiple effect solar stills

Multiple-effect solar desalination systems are more productive than single effect systems due to

the reuse of latent heat of condensation. The increase in efficiency, though, must be balanced

against the increase in capital and operating costs. The efficiency of a multiple-effect solar still

can be increased, for example, by inclining the glass cover surface towards the sun and installing

grooves on the upper surface of the glass to hold and warm the saline water before it enters the

still. The efficiency of the system can also be improved by running it in an upward-type mode.

The addition of flat plate collectors and heat exchangers to transfer waste heat from local

industry provides an additional way of enhancing the productivity.


       Humidification–dehumidification systems

Several pilot plants have been developed over the past four decades. One such plant employed

solar absorbers to preheat the water before it was circulated through an evaporation chamber.

Another system employed a solar pond to load the air with humidity followed by a

dehumidification column to collect the fresh water. A closed air cycle humidification–                 7

dehumidification desalination process has also been used in combination with a flat-plate solar


                                                                    MECH N449 | HCT, Abu Dhabi
Solar Desalination Project 2012
collector. An open-air open-water humidification–dehumidification greenhouse structure was

developed for desalination and for crop growth. The Seawater Greenhouse uses seawater

evaporators to cool and humidify the air. The greenhouse acts as a solar still while providing a

controlled environment suited to the cultivation of crops.


       Economics

Lower operating costs in the form of alternative energy sources (e.g. waste heat or wind energy)

have been found to be key factors in the economic viability of solar desalination systems. Solar

still plants have a mean lifetime of about 20 years while the cost of fresh water produced by solar

plants ranges from US $0.52 m–3 to US $2.99 m–3, depending on the plant and the cost analysis

method. It is important to realize that maximum output does not mean that a solar still is the most

economical.


Illustration of solar desalination design

The project consists of two main parts, the solar part and desalination par. The solar par is where

the solar energy is absorbed and water is circulated. The desalination part is where desalination

take place and then it IS condensed .


In the solar part The process begin when sun wave reflected by reflector sheet with parabolic

shape which will direct the array of sun wave in to focal point. In the focal the thermal receiver

pipe is located. This receiver will absorb the reflected heat and transfer it to circulated water.

The water then flow through the pips to heat exchanger chamber (where the desalination take
                                                                                                      8
place) and the heat gained process 1 will loosen in here . After the water passed throw heat


                                                                    MECH N449 | HCT, Abu Dhabi
Solar Desalination Project 2012
exchanger tube it flow to the suction of the circulation pump. The circulation pump then forces

the water to flow back to thermal receiver pipe. And the process will repeat itself.


In the desalination part, first sea water come from supply to heat exchanger chamber to occupy

one litter volume. The inlet valve then closed. The sea water after that will be gaining heat from

circulating water through the heating tube. The pressure inside the chamber will be vacuumed

and that cased by vacuumed pump. With the vacuumed pressure sea water can boil in lower

temperature than under atmospheric pressure. After it start boiling The steam will sucked by

vacuum pump and drive it to pass throw condenser. the condenser then will remove heat from

the steam by air so steam will changed to water . the concentration of salt can be controlled by

flashing the chamber after producing 30% of volume of sea water distilled water. for example if

there is 1 L of sea water inside the chamber and we have produced 0.3 L of distilled water both

drain and inlet valves will open to flash the chamber.


                                                                                                     9


                                                                  MECH N449 | HCT, Abu Dhabi
Solar Desalination Project 2012
    Figure 1 shows main component of the desalination unit and the process flow diagram.

                                             Figure 1


    Table 2 explain the function of project main components also it has the formula used to

    calculate power for each part

Table 2

Equipment name                           Function                           Equation to find energy

Solar collector                          Reflect solar heat and direct it

                                         to focal point where water is

                                         boiled

Boiler                                   Generate steam

Heat exchange         Solar side         Transfer the solar heat to sea                               10

chamber                                  water to increase the sea


                                                                     MECH N449 | HCT, Abu Dhabi
Solar Desalination Project 2012
                                 water temperature

                  Desalination   Contain sea water and form a

                  Sid e          chamber

pump                             Pump the condensed water


Vacuum pump                      To lower the pressure inside

                                 the chamber which will lower

                                 the boiling point of water

Steam condenser                  To remove heat from steam

                                 and change it to liquid phase


                                                                                       11


                                                          MECH N449 | HCT, Abu Dhabi
Solar Desalination Project 2012

Process flow diagram


Figure 2 shows flow process diagram of the project followed by 2 tables. One for the equipment
and pipe line list and its description.
                                      Figure 2(process flow )


            Euipment list                                                  Pipe line list
Item number Describtion                                   Item number   Describtion
E-1         vacuum                                        P-1           pump discharge
E-2         circulation pump                              P-2           disalination chamber inlet
E-4         solar collector                               P-3           disalination chamber outlet
E-5         Disalination chamber                          P-4           sea water inlet
E-7         air cooling condensor                         P-5           steam outlet
E-6                                                       P-6           condensor inlet
E-7                                                       P-7           condensate


                                                                                                      12


                                                                 MECH N449 | HCT, Abu Dhabi
Solar Desalination Project 2012
Figure 3(3D project diagram)


                                                            13


                               MECH N449 | HCT, Abu Dhabi
Solar Desalination Project 2012

Figure 4(project front view)


                                  Table 3(item list for figure 1 and 2)

Item           Item name                           Item

number                                             number

1              Circulation pump                    7              Distilled water outlet               14

2              Collector                           8              Desalination chamber


                                                                          MECH N449 | HCT, Abu Dhabi
Solar Desalination Project 2012
3             condenser                        9           Steam out let

4             Vacuum pump                      10          Circulation water inlet

5             Cooling fan                      11          Circulation water outlet

6             Common drive sprocket

The figure5 shows that both circulation and vacuum pumps with the cooling fan are linked with

foot peddle so it can be drive manually and That followed by table 4 which include part list

Figure 5(pumps and fan operation)


                                                                                                15


                                                                 MECH N449 | HCT, Abu Dhabi
Solar Desalination Project 2012


Table 4(figure 5) part list

Item number         Item name                     Item number   Item name


1                   Foot paddle                   7             Condenser inlet

2                   Driver sprocket               8             Condenser outlet
3                   Speed increase sprocket       9             Cooling fun

4                   Vacuum pump                   10            Condenser
5                   Steam inlet                   11            Chain
6                   Steam outlet


                                                                                             16


                                                                MECH N449 | HCT, Abu Dhabi
Solar Desalination Project 2012


       Project proposal

Due to the increase in population growth UAE and in other Arabic gulf countries, the demand of

fresh water has been increase. That increase opposed with shortage of fresh water sources in the

region due to the nature of desert and as an effect of the global warming. The gulf region has

abundant seawater resources and a good level of solar radiation, which could be used to produce

drinking water from seawater. Although everybody recognizes the strong potential of solar

thermal energy to seawater desalination, the process is not yet developed at commercial level.

The main reason for that is the technology considered expensive compared with using facial.

Nevertheless, it is also recognized that there is still important room to improve desalination

systems based on solar thermal energy.


                                                                                                   17


                                                                   MECH N449 | HCT, Abu Dhabi
Solar Desalination Project 2012


The results found from the calculations

To produce amount of 1L per minute of distilled water, we found that it requires an energy

between 52 to 55 kj/kg. Also we have the heat flux of the sun for the earth is about 95012 W/m2.

Therefore, an area of 1 meter square will reflect 950     with emissivity of 1. Another point is the

mass flow rate. As the water has heat capacity of 4.1813         and the volume flow rate of

circulating water is L per minute and the mass flow rate using the formula of (                    ).


Table 5

                                  The results of solar desalination

Parameter                         Formula                              Amount

Heat flux                             95012 W/m2 of the earth          For 1 square meter of area has

                                                                       heat flux of 950 W.

Temperature difference of inlet                                        28

and outlet of heat collection

element.

Heat transfer ( solar side)                                            2435.47 Kw

Heat transfer (desalination                                            2435.47 Kw

side)

Mass flow rate of sea water                                            7.6 Kg/s

                                                                                                        18


                                                                      MECH N449 | HCT, Abu Dhabi
Solar Desalination Project 2012


The following table contain important parameters with respect of size

Table 6

                                       Results calculated

Area                            Pressure inside the desalination    Mass flow rate

                                chamber

1 m2                            100 KPa                                       0.365


                                70 KPa                                        0.375


                                50 KPa


2 m2                            100 KPa
                                                                               0.73


                                70 KPa                                         0.75


                                50 KPa


                                                                                                19


                                                                   MECH N449 | HCT, Abu Dhabi
Solar Desalination Project 2012


Literature Review

first green house effect was discovered in the third century before J.C, by Archimedes and 100

years after J.C, by heron of Alexandria, in 1615 by salmon de gauss, in 1974 by Joseph priestly

and in 1878 a solar still of 500 m 2 has been set up in the desert of Atacama (chila), in order to

supply in water a mine of sodium nitrate.


After 1878, work on solar energy has slow down because of fossil energy availability in a lower

cost. Solar energy has been reused from 1902 to 1908, by Schumann who built up solar machines

with much horse power to pump water.


      Solar energy has been reused from 1902 to 1908, by Schumann who built up solar machines

       with much horse power to pump water.

      In 1913, boys set up, near Cairo (Egypt), big machines of 50 horse power with lengthy parabolic

       cylinders which concentrates solar radiation upon a central pipe with a concentration factor of

       4.5, in order to pump water from the Nile River for irrigation purpose.

      Solar energy still being used till 1938,from which there was no other progress in solar energy

       field, because of its lack of competitiveness compared to energy issued from fossil fuel, from

       1950, use of solar energy , began to develop slowly among solar energy uses.


                                                                                                         20


                                                                     MECH N449 | HCT, Abu Dhabi
Solar Desalination Project 2012


                  Desalination:         1


Desalination process is a process that separate low concentration saline water (fresh water) from
the other dissolved salts (the concentrate).with proper energy, a lot of technologies can be used
to produce fresh water. The desalination can become viable as the technology improves but put
in mind that the amount of feed water discharged to waste in the brine stream varies from 20% to
70% of the feed flow. Desalination process is by far beneficiary to communities such as the UAE
where it is more efficient to desalinate than buying water.
There are several technologies that can be used in our country such as the multistage such as:


                                                           Figure 6


          Reverse osmosis(RO) 23:

This method was developed for more than
four decades and proven to be successful
where it was introduced to the commercial
business because it had a decontaminating
capability, and it was a good choice for expensive costly and energy-wasteful distillation units.

Reverse osmosis is the opposite of natural osmosis its where water will move from stronger
saline to weaker saline solution through a semi-permeable membrane that will prevent molecules
larger than water to go through, and this is why salt is left behind because it is physically larger
than water molecule (Figure 6). This semi-permeable membrane is good for desalinating water
1
    http://www.environment.gov.au/soe/2006/publications/emerging/desal/pubs/desal.pdf
                                                                                                         21
2
    http://www.allaboutwater.org/reverse-osmosis.html
3
    http://www.islandnet.com/~tiger/Tiger/RO/how_ro_works.htm


                                                                            MECH N449 | HCT, Abu Dhabi
Solar Desalination Project 2012
   but on the other hand it is not a full process if the water is used by humans, because there are
   some contaminants that are smaller than water particles so they also migrate to the distilled water
   tank, another aspect is that reverse osmosis removes alkaline mineral constituents which will
   produce acidic water that is bad if drank by humans.

           Process:

       1. Force or pressure and temperature must be added on the water to reverse the flow of
           water.
       2. Water will go through the semi-permeable membrane
       3. Water molecules and particles with smaller dimension will pass by the membrane
           through the pores
       4. Chlorine must be added to kill bacteria


                                                                                                         22
Figure 7


                                                                      MECH N449 | HCT, Abu Dhabi
Solar Desalination Project 2012


                  Industrial Applications        4


Reverse osmosis systems can be used to treat boiler feed water, industrial wastewater, process
water and more. A few of the major uses are:

          Boiler Feed Water Treatment: RO is used to reduce the solids content of waters prior to
           feeding into boilers for the power generation and other industries.
          Pharmaceutical: Reverse osmosis is an approved treatment process for the production of
           United States Pharmacopeia (USP) grade water for pharmaceutical applications.
          Food & Beverage: Water used to process food products and to produce beverages is often
           treated by a reverse osmosis system.
          Semiconductor: Reverse osmosis is an accepted component of a treatment process to
           produce ultrapure water in the semiconductor industry.
          Metal Finishing: RO systems have been successfully applied to a variety of metal
           finishing operations including several types of copper, nickel and zinc electroplating;
           nickel acetate seal; and black dye.


                                                                                                        23

4
    http://www.wateronline.com/article.mvc/Use-Of-Reverse-Osmosis-Increasing-In-Industri-0001


                                                                           MECH N449 | HCT, Abu Dhabi
Solar Desalination Project 2012


           Multi-stage flash distillation (MSF):              5


It’s a water desalination process that boil water to form steam and this steam will go through
multiple chambers where it will be heated by a heat exchanger.


                    Process6:

      1. Feed water at the cold inlet temperature is pumped
      2. Water temperature increase when going through the heat exchanger
      3. Brine water will enter the stages and in each stage a small fraction of water will boil
      4. Remnant of the brine water will go out through the discharge nozzle
      5. The resulting steam will cool and condenses to form fresh water and in the same time
           used to heat the feed water(it is a little hot than the feed water)
Figure 8


                                                                                                   24
5
    http://www.allaboutwater.org/distillation.html
6
    http://www.sidem-desalination.com/en/process/MSF/


                                                                      MECH N449 | HCT, Abu Dhabi
Solar Desalination Project 2012


                    Industrial Applications


          Oil refining: to make it a possible fuels for cars, and when properly chemically processed
           it can produce a variety of hydrocarbons like jet fuel, plastics, tires and crayons
          Desalinizing water: to produce fresh water in lands who suffer from the scarcity of water
          Clorosilanes: using distillation it can produce highest grades of silicon that are used to
           manufacture semi-conductors
          Medicine: used to manufacture pharmaceutical and vitamins

                   Solar thermal energy 7:

Solar energy is renewable energy which play very important role and it’s the most important
renewable energy in the world. The efficiency of the solar energy depends on the available
sunlight which is different from place to another. That can be caused by cloudy weather or
differences in latitude. On other hand, the seasons also affect the solar energy. For instance, in
summer, the day is longer than night and the angle of the sun is higher which provide much
stronger solar power than in winter. The electrical power that is produced due to sun called the
solar thermal power. There are 3 types of solar thermal energies such as the parabolic trough,
solar power tower and the dish design.


                    Parabolic Trough8:

                From 1983 to 1989, nine parabolic trough power plants were built by Luz Solar
Partners Ltd in California desert. The plant was able to have 354 MW of capacity. That was by
the big support of the government to have solar power industry. However in that time, the prices
of energy went down and the need of the renewable energy decreased. Also the support from
                                                                                                          25
7
    http://interestingenergyfacts.blogspot.com/2008/04/solar-energy-more-advanatges-than.html
8
    http://www.solardesalination.com.au/content/Parabolic-Trough-Solar-Power-History.html


                                                                             MECH N449 | HCT, Abu Dhabi
Solar Desalination Project 2012
government was only for short period and even not sure. In 1990 Luz doesn’t have enough
money. Therefore, he sold his power stations to Florida-based utility FPL and them still using it
now. They have improved the power station. The 354 MW can now generate 2,325 MW of
reliable electricity.


                  Solar Power tower9:

               From 1982 to 1988, the biggest power tower plant was built. The power towers were
able to produce large power production. The system was to convert the water into steam in the
receiver to power the steam turbine. The heliostat field was consisting of 1818 heliostats in area
of 39.3 m2. The power tower plant was able to generate 10MW for 8 hours daily in summer
solstice and 4 hours daily in winter solstice. The disadvantage of the thermal storage system was
more complicated and inefficient in terms of thermodynamic concept.


                 Dish Technology10:

Dish design is the oldest one among all the solar technologies. In 1901, Enemas in Pasadena,
California have built a reflective dish that has surface area of 700 ft2 and operates 10 hp solar
steam engine. Between 1907 and 1913, a solar-driven hydraulic pump was built by American
engineer, F. Shuman. The disadvantage of this technology is that cost of solar dish is very high
because it uses semi-conducting materials which used to build an efficient solar energy system.
This is very costly compared by the costs of the electricity done by non-renewable energy.


9
     http://www.solarpaces.org/CSP_Technology/docs/solar_tower.pdf
                                                                                                     26

10
     http://www.redrok.com/NewtonSolarSteamManuscript.pdf


                                                                   MECH N449 | HCT, Abu Dhabi
Solar Desalination Project 2012
Another problem is that the dish technology requires a large area for installation because solar
panels need very large area to reach the maximum efficiency. Also the location of the sun affects
the efficiency of the solar dish system. Also the air pollution affects the efficiency of the system.


                Solar Desalination11:

             In 1869, Mouchot have made report of oldest document work on solar desalination
of some Arab alchemist in the 15 century. The Arab alchemist had used the Damascus mirrors in
solar desalination. The Damascus mirrors used to focus the sun radiation on a glass container that
has salty water to make fresh water. In 1559, the scientist Porta had produced seven methods of
desalination. One of them is to convert water that have little amount of salt to fresh water.
Another achievement is that he produced another method called the
humidification/dehumidification method. In 1774, the French chemist Lavoisier had used big
lenses to collect the sun radiation placed on elaborate supporting structures to concentrate solar
energy on the contents of distillation flasks. In 1870, the first American patent in desalination
was for Wheeler and Evans. That patent has a lot of information needed for solar energy and
corrosion problems. After two years, in 1872, a large solar distillation plant was built by Carlos
Wilson, a Sweden engineer who designed it in Las Salinas, Chile. The main purpose of the plant
was to produce fresh water. This plant transfers feed water that has high percentage of salinity of
(140,000 ppm) to the stills. The material of the plant was wood and timber with one sheet of
glass. The plant was able to produce 22.70 m3 of fresh water per day, (about 4.9 l/m2). From
1965 to 1970, a group of solar distillation was built in 4 different islands in Greek. It’s is the
largest solar desalination plant ever built. The plant was able to produce a capacity of 2044 to
8640 m3/day.


                                                                                                          27
11

http://membrane.ustc.edu.cn/paper/pdf/Seawater%20desalination%20using%20renewable%20energy%20sources.pd
f


                                                                     MECH N449 | HCT, Abu Dhabi
Solar Desalination Project 2012

             Technology

The solar desalination plant consists of solar energy collector. Seawater or salt water passing

inside a central tube through the collator, and the sun causes evaporation. The steam condenses

on the inside a tank.


This water still must be treated with minerals before drinking


Project Time line

Figure 9

 Team Name                                                  Mubarak                    Khaled
                                        Turbojet Engine Project
                                                                 Duration
                        Tasks                      Start Date                               End Date
                                                                  (Days)

 Project Choosing                                     9/13/2011             4              9/16/2011

 information about the project Gathering              9/19/2011            5                9/24/2011
 Writing project proposal                             9/24/2011            5                9/29/2011
 Project Approval                                     9/29/2011            1                9/30/2011
 Writing Literature Survey                            9/30/2011            25              10/25/2011
 Project Execution Plan                              10/25/2011            5               10/30/2011
 Distribution of Tasks                               10/30/2011            5                11/4/2011
 System Designing                                     11/4/2011            15              11/19/2011
 Designing calculation                               11/19/2011            10              11/29/2011
 Visibility Study                                    11/29/2011            5                12/4/2011
 Final report and presentation preparation            12/4/2011            30                1/3/2012


                                                                                                        28


                                                                  MECH N449 | HCT, Abu Dhabi
Solar Desalination Project 2012

Calculation

In order to design new solar unite to desalinate sea water we have to do the following procedure.


   1. Find the required energy needed to vaporize the sea water.
   2. Design source of energy capable to provide required energy.
   3. Try to reduce size of the system.


First we will see the required energy per unit mass to vaporize sea water. We can make

assumption that the sate 1 is liquid and state 2 is superheated. Also we can assume the pressure

created by the vaccume pump is 70 kpa absolute . So state 1 @ T=30       and P = 100kpa .state 2

@ T = 90     and P = 70 kpa.


By using the HEI Condenser Performance Calculator we find the following result as it shows in

figure 9


                                                                                                    29


                                                                    MECH N449 | HCT, Abu Dhabi
Solar Desalination Project 2012
Figure 10


@ state 1 Cp equal 4.1784 kJ/kg/    and @ state 2 Cp equal 1.9918 kJ/kg/


To calculate the energy required to change state 1 to state 2 the following equation is used


                                                                                               30


                                                                  MECH N449 | HCT, Abu Dhabi
Solar Desalination Project 2012
If more vacuum is created inside the chamber the following calculation can be done


P 2 = 50 kpa absolute and T2= 82


@ state 1 Cp equal 4.1784 kJ/kg/    and @ state 2 Cp equal 1.9650 kJ/kg/
                                                                                               31
To calculate the energy required to change state 1 to state 2 the following equation is used


                                                                  MECH N449 | HCT, Abu Dhabi
Solar Desalination Project 2012


       Compare the process with and without vacuum pump


In this process we have assume state 1 @ T=30    and P = 100kpa .state 2 @ T = 110    and P =

100 kpa.


By using the HEI Condenser Performance Calculator we find the following result as it shows in

figure 10


                                                                                                32


                                                               MECH N449 | HCT, Abu Dhabi
Solar Desalination Project 2012
Figure 11


@ state 1 Cp equal 4.1784 kJ/kg/    and @ state 2 Cp equal 2.0147 kJ/kg/


To calculate the energy required to change state 1 to state 2 the following equation is used


                                                                                               33


                                                                  MECH N449 | HCT, Abu Dhabi
Solar Desalination Project 2012
That show with vacuum pump reduces the energy required to vaporize sea water. If we compare

energy required with and without vacuum pump we can find difference of 8.6%.


The desired output is to have 1 Liter/hour as a volume flow rate, which is equivalent to 1/3600

Kg/Second, then we multiple                               = 0.01555 kJ/seconds = 0.01555 watt


This energy calculated is supplied from the collector with an assumption that there are no losses

from thermal resistivity and all heat will transfer from the circulated water into sea water.


       Calculated area of reflector:

In order to calculate the surface area of the reflector, we have to use the value of heat flux (950

W/m²) and the energy required


                                    =           =0.0589 m²


       Calculate the mass flow rate of circulated water


 =


In the previous calculation (required energy), the temperature difference between sea water inlet

and evaporation of sea water is found to be 60˚C(       and this difference is caused by

vaporization of sea water in order to recover these . losses we have to add the loss in the

temperature difference through the collector therefore we can assume the          through the         34

collector is 60˚C.


                                                                   MECH N449 | HCT, Abu Dhabi
Solar Desalination Project 2012

Average cp =           =              the average specific heat capacity is


                                 =             = 0.278 kg/s


           Calculation of              caused by reflector.

To calculate the capacity of distilled water provided by the system we should rely of several

thinks such as mass flow rate, area of reflector, type of liquid used in hot side (reflector side )


           Calculation with respect to area of reflector

In the first calculation we will see how the area of reflector will affect the performance of the

system. Depend on our finding the heat flux of the sun on the earth surface is approximate 95012

W/m2. So for example one square meter of reflector will reflect 950w if the emissivity is 1. That

means 950 w will reflect onto a receiver pipe (also called “absorber pipe or heat collection

element”) placed at the focal line of the parabolic surface. Moreover, second assumption is that

water is used as thermal fluid. The specific heat capacity of water is 4.1813             . The volume

flow rate of circulating water is ½ L per mint which is equal to 8.3              m3. Since the density

of water is 958.4 @ 100           13 . from that we can calculate the mass flow rate .


                                                                                                          35
12
     http://home.iprimus.com.au/nielsens/solrad.html
13
     http://en.wikipedia.org/wiki/Density


                                                                          MECH N449 | HCT, Abu Dhabi
Solar Desalination Project 2012


by assume that all reflected heat are absorbed by the water and there is no loses due to thermal

resistivity of the heat collection element material , then the deference of temperature can be

calculated .


                   That give us                        equation # 1


                                       =28


That means the deference between the inlet and the outlet of the heat collection element.


If the area of reflector is doubled(2m2) then the temperature deferent will be as following


                                        =56


Other way to calculate the calculate the rate of heat transfer is by the following equation.

                                                        equation # 2


In the calculation done ahead we found that 56      can be added to water that mean if the initial

state of water is @ T =70    &P= 100 Kpa , the final state is T=70 + 56 = 126      ,because we

assume the process is isobaric so P2 = P1 = 100 Kpa                                                  36


                                                                   MECH N449 | HCT, Abu Dhabi
Solar Desalination Project 2012
By using With HEI Condenser Performance Calculator14 we find that at initial state of water

after the circulation pump and before entering collector receiver the enthalpy is 293.0289


and final state is 2728.4964               .


figure 11 shows pictures of calculation don by the program done for the last calculation .
Figure 12

                    Sample calculation don by HEI Condenser Performance Calculator

Initial state of water                              Final state of steam


@temp 70        and pressure equal to 100 Kpa,      @temp 126     and pressure equal to 100 Kpa,

enthalpy is 293.0289 KJ/Kg                          enthalpy is 2728.4964 KJ/Kg

The specific volume 0.001m3/Kg                      The specific volume 1.8215m3/Kg                37


14
     http://www.dofmaster.com/steam.html

                                                                    MECH N449 | HCT, Abu Dhabi
Solar Desalination Project 2012


After find out the enthalpy for initial and final state we can use the equation #2

                                                          Equation # 2


                                                          .0289)         = 2435.47 Kw


To reach to the desired heat transfer we have to calculate the required area of calculator. Since

heat flux is 950 W/m2 and desired heat transfer is 2435.47 Kw


In first step we did the assumption that specific heat capacity is equal in the initial and final state.

We did that just to find out a point from which we can start. Therefore there is error in the first

and second. And also more error can be found if calculate the thermal heat resistance of heat

collection element and if taking in consideration the emissivity of reflector sheet.


                                                                                                           38


                                                                     MECH N449 | HCT, Abu Dhabi
Solar Desalination Project 2012


           Calculation with respect to fluid type.

                                                                                           15
If motor oil is used as thermal fluid the specific heat capacity will changed to 2              from that

the result well be as the following


                                         =120


We can summarize motor oil required less energy to increase its temperature by one degree.

That mean the area of reflector will be smaller to provide required heat.


           Calculation on the desalination side.

From the previous calculation for the reflector side we found the deference in temperature is

120       . If we assume the all heat are absorbed by sea water and there is no thermal resistance for

                                                                                                  16
tube material inside the desalination unit, The heat capacity of sea water is almost 4                 ,the

following calculation can be done.


                                                              Equation 1


By making assumption of the all heat added to water by the collector are absorbed by the water

in the desalination unit. In previous calculation we found that rate of heat added to water is
                                                                                                              39

15
     http://www.engineeringtoolbox.com/specific-heat-fluids-d_151.html
16
     http://www.kayelaby.npl.co.uk/general_physics/2_7/2_7_9.html

                                                                           MECH N449 | HCT, Abu Dhabi
Solar Desalination Project 2012
2435.47 KW. And @ initial state of sea water P=100Kpa Atm and T= 30            and @ final state is T

110    and P= 100Kpa the mass flow rate can be calculated.


Mass flow rate of sea water is equal to


Mass flow rate is           = 7.6 Kg/s


Calculation using equation #2


@ State 1 of sea water T =30     P = 100 Kpa and @ state 2 T= 110         P=100 Kpa


For state 1 from table A-4 @ T=30         P sat =4.246 kpa which is < P system so it is liquid (hf

=125.79 kj/kg) .for state 2 @ T = 110       P sat =143.27 Kpa which is > P system 100 Kpa so it is

superheated. From table A-6 enthalpy       2676.2 kj/kg.


                                                      = (2676.2-125.9) = 2550.3 KJ/Kg


By using the HEI Condenser Performance Calculator we find the following result as it show in

figure 12


                                                                                                        40


                                                                    MECH N449 | HCT, Abu Dhabi
Solar Desalination Project 2012
Figure 13


It shows that enthalpy @ initial stat equal to 125.7509KJ/Kg and @ final state equal

2696.383KJ/Kg


                                                      Equation # 2


                                                = (2696.383-125.7509) = 2570.6 KJ/Kg


                                                                                             41


                                                 = 0.9 Kg/s

                                                                MECH N449 | HCT, Abu Dhabi
Solar Desalination Project 2012

                   The effect of attaching vacuum pump to desalination unit

The main reason of creating vacuum inside desalination unit is to lower the required energy to

evaporate water.


For example if pressure of 70 Kpa is applied on the sea water , it only required to raise the

temperature to 90    to be at superheated steam state .as it shows in the figure 13.

Figure 14


The required energy to evaporate the water can be found from calculating the change in enthalpy.

The enthalpy founded using HEI Condenser Performance Calculator as it shows in figure 14


                                                                                                   42


                                                                   MECH N449 | HCT, Abu Dhabi
Solar Desalination Project 2012
Figure 15


@ State 1 of sea water T =30    P = 100 Kpa and @ state 2 T= 90       P=70 Kpa


For state 1 from table A-4 @ T=30      P sat =4.246 kpa which is < P system so it is liquid (hf

=125.79 kj/kg) .for state 2 @ T = 90   P sat =70.14 Kpa which is      P system that. From table

A-6 enthalpy    2676.2 kj/kg.
                                                                                                  43

                                                   = (2676.2-125.9) = 2550.3 KJ/Kg


                                                                 MECH N449 | HCT, Abu Dhabi
Solar Desalination Project 2012
As it can be seen from the figure 14. @ State 1 T= 30               P=70 Kpa and @state 2 T=

90      P=70Kpa. Enthalpy is equal to 125.7235 KJ/Kg and 2660.1525 KJ/Kg respectively. There

for change in enthalpy equal to (2660.1525-125.7235) = 2534.429 KJ/Kg


The rate of heat absorb by sea water is equal to 0.0167                    4           120   =8


           Calculation for parabolic dish
                                Figure 16 shows a parabola shape with all dimensions


A torispherical dome is the surface obtained from the intersection of a spherical cap with a
tangent torus, as illustrated above. The radius of the sphere            is called the "crown radius," and
the radius of the torus is called the "knuckle radius." Torispherical domes are used to construct
pressure vessels. 17
                                                                                                             44


17
     http://mathworld.wolfram.com/TorisphericalDome.html

                                                                               MECH N449 | HCT, Abu Dhabi
Solar Desalination Project 2012
Let be the distance from the center of the torus to the center of the torus tube, let       be the
radius of the torus tube, and let be the height from the base of the dome to the top. Then the
radius of the base is given by             . In addition, by elementary geometry, a torispherical dome
            18
satisfies

                                                                                                         (1)

So

                                                                                                         (2)

The transition from sphere to torus occurs at the critical radius


                                                                                                         (3)


So the dome has equation


                                                                                                         (4)


Where

                                                                                                         (5)

The torispherical dome has volume

                                                                                                         (6
                                                                                                           )

                                                                                                         (7


                                                                                                               45


18
     http://mathworld.wolfram.com/TorisphericalDome.html

                                                                      MECH N449 | HCT, Abu Dhabi
Solar Desalination Project 2012

Table 7


                                              Cost estimation

          Item                      Capacity/size                             Cost

Circulation pump                   1L/min(0.25 HP)          200 DHS

Collector sheet                         1m2                 125 DHS/m2

Bicycle                 Height of 0.75 - 1.10 m (2.5 -      2000 DHS

                        3.5 ft.)


                        Width of up to 0.61 m (2 ft.)


                        Length of 1.5 - 1.8 m (5 - 6 ft.)


                 Chains +gear +sprocket                     1000 DHS

Aluminum sheet                10cm x10 cm x30cm             500 DHS

Piping and fittings     Copper tubes +                      500 DHS

                        fittings

                        Heavy duty                          500 DHS

                        polyethylene +

                        fittings

Temperature gauge                              4 gauges     160x4 = 640 DHS
                                                                                                    46
                         total                              5465 DHS


                                                                       MECH N449 | HCT, Abu Dhabi
Solar Desalination Project 2012

Conclusion


       Ease of safe operation


       Equipment and Clothing


Avoid wearing long flowing clothes. Tie up long hair. Wear protective equipment such as a dust
mask, gloves, eye protection, ear mufflers, jacket and boots that provide good grip on the floor.


        Surrounding Area


Make sure the area around the machine is free of clutter and you have sufficient space to work.
Do not work in poorly lit conditions or in positions that are uncomfortable to you. Notify a
supervisor of such problems promptly. The machine must be positioned on a stable surface and
must be a suitable distance away from you. Position yourself in a comfortable manner so that
you do not have to reach out or bend.


          Starting a Machine


Before starting a machine, check the machine guards and ensure they all fit and are in place.
Ensure that any keys or wrenches are removed so they do not fly out and hit you or another
person nearby. Never operate a machine if you notice loose parts, unusual sounds or vibrations.
To avoid electric shocks, you must ensure that the machine is properly grounded.
to do welding job make sure hat all required PPE are used and you must be aware how t do
welding or as assistance from professional person.


                                                                                                    47


                                                                 MECH N449 | HCT, Abu Dhabi
Solar Desalination Project 2012

       Comments on the project:

The project is a good start for desalination of sea water because the UAE is a desert country

where fresh water is scarce and sea water is available. It’s a project that can be used in areas with

a hot climate because it relies on the solar energy. One important factor that was taken into

consideration that the team worked on making a solar desalination system that can be portable so

it can be used on different applications. It is a project that is easy to manufacture by using basic

concepts of thermodynamics, heat transfer and material selection. Moreover, the parts needed to

fabricate such product are available in the local market.


       Problems encountered

There are a lot of factors that affected the solar desalination performance such as:


      Dust (the formation of the dust on the reflector sheet can eliminate or block the absorption of
       sun light which will negatively affect the system.
      It can be operated in daytime only.
      Pollution can be a disadvantage to solar panels, as pollution can degrade the efficiency of
       photovoltaic cells. Clouds also provide the same effect, as they can reduce the energy of the sun
       rays
      The location of solar panels can affect performance, due to possible obstructions from the
       surrounding buildings or landscape


                                                                                                           48


                                                                     MECH N449 | HCT, Abu Dhabi
Solar Desalination Project 2012


       Recommendations


since we are using single stage desalination it’s better to use multistage desalination for a better

performance, another aspect is to place the solar system in a location that there are no building

near so as the sun shifts the shadow of the buildings will not affect the process. Lastly if we are

given more time, the building of the solar desalination system would have supported the

calculations and it will help in finding errors if occurred.


Appendix


       SOLAR RADIATION REACHING THE EARTH SURFACE


The process of heat transfer from the sun to the surface of earth:

The intensity of the solar radiation reaching us is about 1369 watts per square meter [W/m2].
This is known as the Solar Constant. It is important to understand that it is not the intensity per
square meter of the Earth’s surface but per square meter on a sphere with the radius of
                                                                                                       49
149,596.000 km and with the Sun at its center the atmosphere absorbs about 68 W/m2 and
reflects 77 W/m2 (Wallace and Hobbs 1977). The radiation reaching the Earth’s surface is


                                                                     MECH N449 | HCT, Abu Dhabi
Solar Desalination Project 2012
therefore on average 198 W/m2, i.e. 58% of the radiation intercepted by the Earth as it shows in
figure16. 19

                                                       Figure 17


Figure 16. The distribution of the solar radiation. On average, each square

meter of the upper regions of the atmosphere receives 342 watts of solar

radiation [W/m2]. The atmosphere absorbs on average 67 W/m 2 and reflects

77 W/m2. About 198 W/m2 reaches the Earth's surface, of which 168 W/m2 is

absorbed and 30 W/m2 is reflected back to space. The total of the reflected

                                                                                                   50


19
     http://home.iprimus.com.au/nielsens/solrad.html

                                                                   MECH N449 | HCT, Abu Dhabi
Solar Desalination Project 2012
radiation is 107 W/m2, or 31% of the incoming radiation.


Source: Modified figure of Houghton et al. 2001


The intensity of solar radiation depends on the time of the year and geographical
positions as illustrated in Figure 17.

                                          Figure 18


Figure 17: The intensity of solar radiation (solar power) in various parts of the

world depending on the season, measured in watts per square meter [W/m2].


Source: Sofia (Sharing of Free Intellectual Assets).                                      51


                                                             MECH N449 | HCT, Abu Dhabi
Solar Desalination Project 2012


HANDY FORMULA to calculate how much energy we receive from the Sun:


                                              Equation 1


Where E is the solar energy in EJ, S is the Solar Constant in W/m2, n is the number of hours; r is
the Earth's radius in km.

This formula is for the total solar energy intercepted by the Earth in n hours. If you want to
calculate how much of the solar energy reaches the Earth's surface, multiply the result by 0.58

       Thermal Conductivity


Thermal conductivity (λ) is the intrinsic property of a material which relates its ability to conduct
heat. Heat transfer by conduction involves transfer of energy within a material without any
motion of the material as a whole. Conduction takes place when a temperature gradient exists in
a solid (or stationary fluid) medium. Conductive heat flow occurs in the direction of decreasing
temperature because higher temperature equates to higher molecular energy or more molecular
movement. Energy is transferred from the more energetic to the less energetic molecules when
neighboring molecules collide.

Thermal conductivity is defined as the quantity of heat (Q) transmitted through a unit thickness
(L) in a direction normal to a surface of unit area (A) due to a unit temperature gradient (ΔT)
                                                                                                        52
under steady state conditions and when the heat transfer is dependent only on the temperature
gradient. In equation form this becomes the following:


                                                                   MECH N449 | HCT, Abu Dhabi
Solar Desalination Project 2012


                  Thermal Conductivity = heat × distance / (area × temperature gradient)


                                               λ = Q × L / (A × ΔT)


           Emissivity


The emissivity of a material (usually written ε or e) is the relative ability of its surface to emit
energy by radiation. It is the ratio of energy radiated by a particular material to energy radiated
by a black body at the same temperature. A true black body would have an ε = 1 while any real
object would have ε < 1. Emissivity is a dimensionless quantity.20

In general, the duller and blacker a material is, the closer its emissivity is to 1. The more
reflective a material is, the lower its emissivity. Highly polished silver has an emissivity of about
0.02


Low emissivity (low e) - actually low thermal emissivity - is a quality of a surface that radiates,
or emits, low levels of radiant thermal (heat) energy. All materials absorb, reflect and emit
radiant energy. This article is primarily about material properties within a special wavelength
interval of radiant energy - namely thermal radiation of materials with temperatures
approximately in the interval -40...60°C.

Emissivity is the value given to materials based on the ratio of heat emitted compared to a
blackbody, on a scale of 0 to 1. A blackbody would have an emissivity of 1 and a perfect
reflector would have a value of 0.
                                                                                                        53


20
     http://en.wikipedia.org/wiki/Emissivity

                                                                      MECH N449 | HCT, Abu Dhabi
Solar Desalination Project 2012
Reflectivity is inversely related to emissivity and when added together their total should equal 1
for an opaque material. Therefore, if asphalt has a thermal emissivity value of 0.90 its thermal
reflectance value would be 0.10. This means that it absorbs and emits 90% of radiant thermal
energy and reflects only 10%. Conversely, a low-e material such as aluminum foil has a thermal
emissivity value of 0.03 and a thermal reflectance value of 0.97, meaning it reflects 97% of
radiant thermal energy and emits only 3%. Low-emissivity building materials include window
glass manufactured with metal-oxide coatings as well as housewrap materials, reflective thermal
insulations and other forms of radiant thermal barriers.

The thermal emissivity of various surfaces is listed in the following table [8] .


Table 8

Materials surface      Thermal emittance
Asphalt                0.90-0.98
Aluminum foil          0.03-0.05
Brick                  0.93
Concrete               0.85-0.95
Glass (unglazed)       0.95
Fiberglass/cellulose   0.80-0.90
Limestone              0.36-0.90
Marble                 0.93
Paper                  0.92
Plaster                0.91
Silver                 0.02
Steel (mild)           0.12
Wood                   0.90


                                                                                                     54


                                                                   MECH N449 | HCT, Abu Dhabi
Solar Desalination Project 2012


Table 9

Material               Thermal Conductivity   Thermal Conductivity
                            W/m, oK           (cal/sec)/(cm2, oC/cm)

Air at 0 C                    0.024                 0.000057

Aluminum                      205.0                   0.50

Brass                         109.0                     -

Concrete                       0.8                    0.002

Copper                        385.0                   0.99

Glass, ordinary                0.8                   0.0025

Gold                           310                      -

Ice                            1.6                    0.005

Iron                            -                     0.163

Lead                           34.7                   0.083

Polyethylene HD                0.5                      -

Polystyrene expanded           0.03                     -

Silver                        406.0                   1.01

Styrofoam                      0.01                     -

Steel                          50.2                     -

Water at 20 C                   -                    0.0014

Wood                        0.12-0.04                0.0001


                                                                                55


                                                   MECH N449 | HCT, Abu Dhabi
Solar Desalination Project 2012


            Project main part

Figure 18 show picture of the solar desalination unit with main component

Figure 19


                                                                    7


                                                                                            56


                                                               MECH N449 | HCT, Abu Dhabi
Solar Desalination Project 2012
Table 10 shows name of equipment in figure 18 , its function and equation used to calculate

energy

Table 10

Equipment name                          Function                         Equation to find energy

Solar collector                         Reflect solar heat and direct

                                        it to focal point where water

                                        is boiled

Boiler                                  Generate steam

Heat exchange        Solar side         Transfer the solar heat to sea

chamber                                 water to increase the sea

                                        water temperature

                     Desalination       Contain sea water and form a

                     Sid e              chamber

pump                                    Pump the condensed water


Vacuum pump                             To lower the pressure inside

                                        the chamber which will

                                        lower the boiling point of

                                        water

Steam condenser                         To remove heat from steam

                                        and change it to liquid phase


                                                                                                   57


                                                                     MECH N449 | HCT, Abu Dhabi
Solar Desalination Project 2012


References:

http://www.solardesalination.com.au/content/Parabolic-Trough-Solar-Power-History.html


http://www.solarpaces.org/CSP_Technology/docs/solar_tower.pdf


http://interestingenergyfacts.blogspot.com/2008/04/solar-energy-more-advanatges-than.html


http://www.redrok.com/NewtonSolarSteamManuscript.pdf


http://membrane.ustc.edu.cn/paper/pdf/Seawater%20desalination%20using%20renewable%20en

ergy%20sources.pdf


http://www.islandnet.com/~tiger/Tiger/RO/how_ro_works.htm

http://www.allaboutwater.org/reverse-osmosis.html

http://www.environment.gov.au/soe/2006/publications/emerging/desal/pubs/desal.pdf

http://www.wateronline.com/article.mvc/Use-Of-Reverse-Osmosis-Increasing-In-Industri-0001

http://www.sidem-desalination.com/en/process/MSF/

http://en.wikipedia.org/wiki/Emissivity


                                                                                            58


                                                              MECH N449 | HCT, Abu Dhabi

More Related Content

What's hot

Solar powered desalination final
Solar powered desalination finalSolar powered desalination final
Solar powered desalination finalJeet Suthar
 
solar still
solar stillsolar still
solar stillTHE ROCK
 
Solar Water Distillation For Drinking Purposes
Solar Water Distillation For Drinking PurposesSolar Water Distillation For Drinking Purposes
Solar Water Distillation For Drinking Purposessunil sudhakaran
 
Hydrogen energy sources - generation and storage
Hydrogen energy sources - generation and storageHydrogen energy sources - generation and storage
Hydrogen energy sources - generation and storageShantam Warkad
 
Green hydrogen technology.pptx
Green hydrogen technology.pptxGreen hydrogen technology.pptx
Green hydrogen technology.pptxHemchandMore1
 
purification of water using solar still
purification of water using solar stillpurification of water using solar still
purification of water using solar stillMohamed Ahmed
 
01 thermal energy storage using ice slurry
01 thermal energy storage using ice slurry01 thermal energy storage using ice slurry
01 thermal energy storage using ice slurryWahid Mohamed
 
Design And Development of Hybrid Solar Dryers For Domestic Applications
Design And Development of Hybrid Solar Dryers For Domestic ApplicationsDesign And Development of Hybrid Solar Dryers For Domestic Applications
Design And Development of Hybrid Solar Dryers For Domestic Applicationssangeetkhule
 
Solar Thermal Energy
Solar Thermal Energy Solar Thermal Energy
Solar Thermal Energy Raktim Saikia
 
Solar distillation presentation
Solar distillation presentation Solar distillation presentation
Solar distillation presentation Divya Kritika
 
2nd CSP Training series : solar desalination (1/2)
2nd CSP Training series : solar desalination (1/2)2nd CSP Training series : solar desalination (1/2)
2nd CSP Training series : solar desalination (1/2)Leonardo ENERGY
 
OCEAN THERMAL ENERGY CONVERSION
OCEAN THERMAL ENERGY CONVERSION OCEAN THERMAL ENERGY CONVERSION
OCEAN THERMAL ENERGY CONVERSION Snehanshu Das
 
Unit iii solar energy storage and applications
Unit iii solar energy storage and applicationsUnit iii solar energy storage and applications
Unit iii solar energy storage and applicationsDr SOUNDIRARAJ N
 

What's hot (20)

Solar distillation
Solar distillationSolar distillation
Solar distillation
 
Solar powered desalination final
Solar powered desalination finalSolar powered desalination final
Solar powered desalination final
 
solar still
solar stillsolar still
solar still
 
Solar Water Distillation For Drinking Purposes
Solar Water Distillation For Drinking PurposesSolar Water Distillation For Drinking Purposes
Solar Water Distillation For Drinking Purposes
 
Hydrogen energy sources - generation and storage
Hydrogen energy sources - generation and storageHydrogen energy sources - generation and storage
Hydrogen energy sources - generation and storage
 
Green hydrogen technology.pptx
Green hydrogen technology.pptxGreen hydrogen technology.pptx
Green hydrogen technology.pptx
 
Solar still for pure water
Solar still for pure waterSolar still for pure water
Solar still for pure water
 
Solar Air Heater
Solar Air HeaterSolar Air Heater
Solar Air Heater
 
purification of water using solar still
purification of water using solar stillpurification of water using solar still
purification of water using solar still
 
Solar energy
Solar energySolar energy
Solar energy
 
Solar still
Solar stillSolar still
Solar still
 
01 thermal energy storage using ice slurry
01 thermal energy storage using ice slurry01 thermal energy storage using ice slurry
01 thermal energy storage using ice slurry
 
Design And Development of Hybrid Solar Dryers For Domestic Applications
Design And Development of Hybrid Solar Dryers For Domestic ApplicationsDesign And Development of Hybrid Solar Dryers For Domestic Applications
Design And Development of Hybrid Solar Dryers For Domestic Applications
 
Solar Thermal Energy
Solar Thermal Energy Solar Thermal Energy
Solar Thermal Energy
 
Solar distillation presentation
Solar distillation presentation Solar distillation presentation
Solar distillation presentation
 
Solar desalination
Solar desalinationSolar desalination
Solar desalination
 
Cogeneration
CogenerationCogeneration
Cogeneration
 
2nd CSP Training series : solar desalination (1/2)
2nd CSP Training series : solar desalination (1/2)2nd CSP Training series : solar desalination (1/2)
2nd CSP Training series : solar desalination (1/2)
 
OCEAN THERMAL ENERGY CONVERSION
OCEAN THERMAL ENERGY CONVERSION OCEAN THERMAL ENERGY CONVERSION
OCEAN THERMAL ENERGY CONVERSION
 
Unit iii solar energy storage and applications
Unit iii solar energy storage and applicationsUnit iii solar energy storage and applications
Unit iii solar energy storage and applications
 

Viewers also liked

John tibby geography teachers' association year 12 night 2014-water alternati...
John tibby geography teachers' association year 12 night 2014-water alternati...John tibby geography teachers' association year 12 night 2014-water alternati...
John tibby geography teachers' association year 12 night 2014-water alternati...John Tibby
 
Desalination of seawater
Desalination of seawaterDesalination of seawater
Desalination of seawatermorrison2816
 
Amr fadlelmawla desalination-kuwait (1)
Amr fadlelmawla desalination-kuwait (1)Amr fadlelmawla desalination-kuwait (1)
Amr fadlelmawla desalination-kuwait (1)Nidaa Majali
 
Combined solar power and desalination plants
Combined solar power and desalination plantsCombined solar power and desalination plants
Combined solar power and desalination plantsParti Djibouti
 
Midterm Presentation
Midterm PresentationMidterm Presentation
Midterm PresentationJacob Sanchez
 
Definisi Reverse Osmosis System -- By Fujikasui Engineering Indonesia (Perusa...
Definisi Reverse Osmosis System -- By Fujikasui Engineering Indonesia (Perusa...Definisi Reverse Osmosis System -- By Fujikasui Engineering Indonesia (Perusa...
Definisi Reverse Osmosis System -- By Fujikasui Engineering Indonesia (Perusa...Anggi Nurbana Wahyudi
 
Adelaide Desalination Plant Death - Allen ONeil
Adelaide Desalination Plant Death - Allen ONeilAdelaide Desalination Plant Death - Allen ONeil
Adelaide Desalination Plant Death - Allen ONeilAndrea_AUST
 
water-treatment-plant
water-treatment-plantwater-treatment-plant
water-treatment-plantleubo
 
Australia success of desalination in solving water challenges
Australia success of desalination in solving water challengesAustralia success of desalination in solving water challenges
Australia success of desalination in solving water challengesDegrémont
 
Desalination Sustainably Drought Proofing Australia
Desalination Sustainably Drought Proofing AustraliaDesalination Sustainably Drought Proofing Australia
Desalination Sustainably Drought Proofing AustraliaEngineers Australia
 
Desalination Overview and 24 MLD Jaffna SWRO Project May, 2015 - Water Globe.
Desalination Overview and 24 MLD Jaffna SWRO Project May, 2015 - Water Globe.Desalination Overview and 24 MLD Jaffna SWRO Project May, 2015 - Water Globe.
Desalination Overview and 24 MLD Jaffna SWRO Project May, 2015 - Water Globe.Private Consultants
 
Hydraulics for engineers
Hydraulics for engineersHydraulics for engineers
Hydraulics for engineersYuri Melliza
 
Fan and blowers (mech 326)
Fan and blowers (mech 326)Fan and blowers (mech 326)
Fan and blowers (mech 326)Yuri Melliza
 

Viewers also liked (20)

John tibby geography teachers' association year 12 night 2014-water alternati...
John tibby geography teachers' association year 12 night 2014-water alternati...John tibby geography teachers' association year 12 night 2014-water alternati...
John tibby geography teachers' association year 12 night 2014-water alternati...
 
Ppt assgn 1
Ppt assgn  1Ppt assgn  1
Ppt assgn 1
 
Desalination of seawater
Desalination of seawaterDesalination of seawater
Desalination of seawater
 
Amr fadlelmawla desalination-kuwait (1)
Amr fadlelmawla desalination-kuwait (1)Amr fadlelmawla desalination-kuwait (1)
Amr fadlelmawla desalination-kuwait (1)
 
Combined solar power and desalination plants
Combined solar power and desalination plantsCombined solar power and desalination plants
Combined solar power and desalination plants
 
Midterm Presentation
Midterm PresentationMidterm Presentation
Midterm Presentation
 
Reverse osmosis
Reverse osmosisReverse osmosis
Reverse osmosis
 
Definisi Reverse Osmosis System -- By Fujikasui Engineering Indonesia (Perusa...
Definisi Reverse Osmosis System -- By Fujikasui Engineering Indonesia (Perusa...Definisi Reverse Osmosis System -- By Fujikasui Engineering Indonesia (Perusa...
Definisi Reverse Osmosis System -- By Fujikasui Engineering Indonesia (Perusa...
 
Adelaide Desalination Plant Death - Allen ONeil
Adelaide Desalination Plant Death - Allen ONeilAdelaide Desalination Plant Death - Allen ONeil
Adelaide Desalination Plant Death - Allen ONeil
 
water-treatment-plant
water-treatment-plantwater-treatment-plant
water-treatment-plant
 
Desalination Of Seawater By Ro System
Desalination Of Seawater By Ro SystemDesalination Of Seawater By Ro System
Desalination Of Seawater By Ro System
 
Desalination
DesalinationDesalination
Desalination
 
Australia success of desalination in solving water challenges
Australia success of desalination in solving water challengesAustralia success of desalination in solving water challenges
Australia success of desalination in solving water challenges
 
Desalination Sustainably Drought Proofing Australia
Desalination Sustainably Drought Proofing AustraliaDesalination Sustainably Drought Proofing Australia
Desalination Sustainably Drought Proofing Australia
 
Desalination Overview and 24 MLD Jaffna SWRO Project May, 2015 - Water Globe.
Desalination Overview and 24 MLD Jaffna SWRO Project May, 2015 - Water Globe.Desalination Overview and 24 MLD Jaffna SWRO Project May, 2015 - Water Globe.
Desalination Overview and 24 MLD Jaffna SWRO Project May, 2015 - Water Globe.
 
Hydraulics for engineers
Hydraulics for engineersHydraulics for engineers
Hydraulics for engineers
 
Fan and blowers (mech 326)
Fan and blowers (mech 326)Fan and blowers (mech 326)
Fan and blowers (mech 326)
 
psychrometrics
psychrometricspsychrometrics
psychrometrics
 
Pump principles
Pump principlesPump principles
Pump principles
 
Pumps (mech 326)
Pumps (mech 326)Pumps (mech 326)
Pumps (mech 326)
 

Similar to HCT Solar Desalination Project

OceanaGold -110729 NI-43-101-Technical-Report-Didipio
OceanaGold -110729 NI-43-101-Technical-Report-DidipioOceanaGold -110729 NI-43-101-Technical-Report-Didipio
OceanaGold -110729 NI-43-101-Technical-Report-DidipioNo to mining in Palawan
 
GroupD_Low Cost Subsea Processing System for Brownfield Developments
GroupD_Low Cost Subsea Processing System for Brownfield DevelopmentsGroupD_Low Cost Subsea Processing System for Brownfield Developments
GroupD_Low Cost Subsea Processing System for Brownfield DevelopmentsOlawale B. SAMUEL, PMP®
 
SUSTAINABLE REGENERATION OF URBAN GREEN AREAS IN EGYPT’S DESERT CITIES - Adop...
SUSTAINABLE REGENERATION OF URBAN GREEN AREAS IN EGYPT’S DESERT CITIES - Adop...SUSTAINABLE REGENERATION OF URBAN GREEN AREAS IN EGYPT’S DESERT CITIES - Adop...
SUSTAINABLE REGENERATION OF URBAN GREEN AREAS IN EGYPT’S DESERT CITIES - Adop...Mahmoud Moursy Hussein
 
Double Parking System Design
Double Parking System DesignDouble Parking System Design
Double Parking System DesignWaleed Alyafie
 
1310 feasibility compost_coffee and climate_soil and more final
1310 feasibility compost_coffee and climate_soil and more final1310 feasibility compost_coffee and climate_soil and more final
1310 feasibility compost_coffee and climate_soil and more finalAnurag Sinha
 
Cict6640 sandis wanjala wamalwa
Cict6640 sandis wanjala wamalwaCict6640 sandis wanjala wamalwa
Cict6640 sandis wanjala wamalwaSandisWanjala
 
Utility-Scale Solar Photovoltaic Power Plants - A Project Developer’s Guide
Utility-Scale Solar Photovoltaic Power Plants - A Project Developer’s GuideUtility-Scale Solar Photovoltaic Power Plants - A Project Developer’s Guide
Utility-Scale Solar Photovoltaic Power Plants - A Project Developer’s GuidePrivate Consultants
 
CSP Report Group E (1)
CSP Report Group E (1)CSP Report Group E (1)
CSP Report Group E (1)Rachit Kansal
 
Worcester Art Museum: Green Technology Evaluation
Worcester Art Museum: Green Technology EvaluationWorcester Art Museum: Green Technology Evaluation
Worcester Art Museum: Green Technology EvaluationFlanna489y
 
TS Editor 3.0 User Manual
TS Editor 3.0 User ManualTS Editor 3.0 User Manual
TS Editor 3.0 User ManualHydroOffice.org
 
Democratic Republic of the Congo - Energy Outlook
Democratic Republic of the Congo - Energy OutlookDemocratic Republic of the Congo - Energy Outlook
Democratic Republic of the Congo - Energy OutlookRachit Kansal
 
JohnWhelanThesisFinal
JohnWhelanThesisFinalJohnWhelanThesisFinal
JohnWhelanThesisFinalJohn Whelan
 
Solar Energy - A Complete Guide
Solar Energy - A Complete GuideSolar Energy - A Complete Guide
Solar Energy - A Complete GuideNaman Pratap Singh
 
Ifc+solar+report web+ 08+05
Ifc+solar+report web+ 08+05Ifc+solar+report web+ 08+05
Ifc+solar+report web+ 08+05Mohammed Selim
 
Does online interaction with promotional video increase customer learning and...
Does online interaction with promotional video increase customer learning and...Does online interaction with promotional video increase customer learning and...
Does online interaction with promotional video increase customer learning and...rossm2
 
Grid connected pv power system
Grid connected pv power systemGrid connected pv power system
Grid connected pv power systemZelalem Girma
 
GREEN ROOF ADVISORY GROUP, Austin TX
GREEN ROOF ADVISORY GROUP, Austin TXGREEN ROOF ADVISORY GROUP, Austin TX
GREEN ROOF ADVISORY GROUP, Austin TXFlanna489y
 

Similar to HCT Solar Desalination Project (20)

OceanaGold -110729 NI-43-101-Technical-Report-Didipio
OceanaGold -110729 NI-43-101-Technical-Report-DidipioOceanaGold -110729 NI-43-101-Technical-Report-Didipio
OceanaGold -110729 NI-43-101-Technical-Report-Didipio
 
GroupD_Low Cost Subsea Processing System for Brownfield Developments
GroupD_Low Cost Subsea Processing System for Brownfield DevelopmentsGroupD_Low Cost Subsea Processing System for Brownfield Developments
GroupD_Low Cost Subsea Processing System for Brownfield Developments
 
SUSTAINABLE REGENERATION OF URBAN GREEN AREAS IN EGYPT’S DESERT CITIES - Adop...
SUSTAINABLE REGENERATION OF URBAN GREEN AREAS IN EGYPT’S DESERT CITIES - Adop...SUSTAINABLE REGENERATION OF URBAN GREEN AREAS IN EGYPT’S DESERT CITIES - Adop...
SUSTAINABLE REGENERATION OF URBAN GREEN AREAS IN EGYPT’S DESERT CITIES - Adop...
 
Double Parking System Design
Double Parking System DesignDouble Parking System Design
Double Parking System Design
 
1310 feasibility compost_coffee and climate_soil and more final
1310 feasibility compost_coffee and climate_soil and more final1310 feasibility compost_coffee and climate_soil and more final
1310 feasibility compost_coffee and climate_soil and more final
 
Cict6640 sandis wanjala wamalwa
Cict6640 sandis wanjala wamalwaCict6640 sandis wanjala wamalwa
Cict6640 sandis wanjala wamalwa
 
Utility-Scale Solar Photovoltaic Power Plants - A Project Developer’s Guide
Utility-Scale Solar Photovoltaic Power Plants - A Project Developer’s GuideUtility-Scale Solar Photovoltaic Power Plants - A Project Developer’s Guide
Utility-Scale Solar Photovoltaic Power Plants - A Project Developer’s Guide
 
CSP Report Group E (1)
CSP Report Group E (1)CSP Report Group E (1)
CSP Report Group E (1)
 
Upwind - Design limits and solutions for very large wind turbines
Upwind - Design limits and solutions for very large wind turbinesUpwind - Design limits and solutions for very large wind turbines
Upwind - Design limits and solutions for very large wind turbines
 
Worcester Art Museum: Green Technology Evaluation
Worcester Art Museum: Green Technology EvaluationWorcester Art Museum: Green Technology Evaluation
Worcester Art Museum: Green Technology Evaluation
 
TS Editor 3.0 User Manual
TS Editor 3.0 User ManualTS Editor 3.0 User Manual
TS Editor 3.0 User Manual
 
K12 2011
K12 2011K12 2011
K12 2011
 
Airah Discussion Paper Energy Modelling Protocol Alignment 300911
Airah Discussion Paper   Energy Modelling Protocol Alignment 300911Airah Discussion Paper   Energy Modelling Protocol Alignment 300911
Airah Discussion Paper Energy Modelling Protocol Alignment 300911
 
Democratic Republic of the Congo - Energy Outlook
Democratic Republic of the Congo - Energy OutlookDemocratic Republic of the Congo - Energy Outlook
Democratic Republic of the Congo - Energy Outlook
 
JohnWhelanThesisFinal
JohnWhelanThesisFinalJohnWhelanThesisFinal
JohnWhelanThesisFinal
 
Solar Energy - A Complete Guide
Solar Energy - A Complete GuideSolar Energy - A Complete Guide
Solar Energy - A Complete Guide
 
Ifc+solar+report web+ 08+05
Ifc+solar+report web+ 08+05Ifc+solar+report web+ 08+05
Ifc+solar+report web+ 08+05
 
Does online interaction with promotional video increase customer learning and...
Does online interaction with promotional video increase customer learning and...Does online interaction with promotional video increase customer learning and...
Does online interaction with promotional video increase customer learning and...
 
Grid connected pv power system
Grid connected pv power systemGrid connected pv power system
Grid connected pv power system
 
GREEN ROOF ADVISORY GROUP, Austin TX
GREEN ROOF ADVISORY GROUP, Austin TXGREEN ROOF ADVISORY GROUP, Austin TX
GREEN ROOF ADVISORY GROUP, Austin TX
 

More from Waleed Alyafie

Material selection of desalination plants
Material selection of desalination plantsMaterial selection of desalination plants
Material selection of desalination plantsWaleed Alyafie
 
Cooling load calculations
Cooling load calculationsCooling load calculations
Cooling load calculationsWaleed Alyafie
 
Automatic door system of bus door
Automatic door  system of bus doorAutomatic door  system of bus door
Automatic door system of bus doorWaleed Alyafie
 
Safety role of management
Safety role of managementSafety role of management
Safety role of managementWaleed Alyafie
 
Safety Role of management
Safety Role of managementSafety Role of management
Safety Role of managementWaleed Alyafie
 
Economy Report of United Arab Emirates
Economy Report of United Arab EmiratesEconomy Report of United Arab Emirates
Economy Report of United Arab EmiratesWaleed Alyafie
 
Torsion test machine design
Torsion test machine designTorsion test machine design
Torsion test machine designWaleed Alyafie
 

More from Waleed Alyafie (11)

Rights Theory
Rights TheoryRights Theory
Rights Theory
 
Material selection of desalination plants
Material selection of desalination plantsMaterial selection of desalination plants
Material selection of desalination plants
 
Cooling load calculations
Cooling load calculationsCooling load calculations
Cooling load calculations
 
Automatic door system of bus door
Automatic door  system of bus doorAutomatic door  system of bus door
Automatic door system of bus door
 
Project management
Project managementProject management
Project management
 
Safety role of management
Safety role of managementSafety role of management
Safety role of management
 
Safety Role of management
Safety Role of managementSafety Role of management
Safety Role of management
 
Economy Report of United Arab Emirates
Economy Report of United Arab EmiratesEconomy Report of United Arab Emirates
Economy Report of United Arab Emirates
 
IC Engine Practical
IC Engine PracticalIC Engine Practical
IC Engine Practical
 
Torsion test machine design
Torsion test machine designTorsion test machine design
Torsion test machine design
 
Building Vibration
Building VibrationBuilding Vibration
Building Vibration
 

Recently uploaded

ANG SEKTOR NG agrikultura.pptx QUARTER 4
ANG SEKTOR NG agrikultura.pptx QUARTER 4ANG SEKTOR NG agrikultura.pptx QUARTER 4
ANG SEKTOR NG agrikultura.pptx QUARTER 4MiaBumagat1
 
Difference Between Search & Browse Methods in Odoo 17
Difference Between Search & Browse Methods in Odoo 17Difference Between Search & Browse Methods in Odoo 17
Difference Between Search & Browse Methods in Odoo 17Celine George
 
Food processing presentation for bsc agriculture hons
Food processing presentation for bsc agriculture honsFood processing presentation for bsc agriculture hons
Food processing presentation for bsc agriculture honsManeerUddin
 
Global Lehigh Strategic Initiatives (without descriptions)
Global Lehigh Strategic Initiatives (without descriptions)Global Lehigh Strategic Initiatives (without descriptions)
Global Lehigh Strategic Initiatives (without descriptions)cama23
 
4.16.24 21st Century Movements for Black Lives.pptx
4.16.24 21st Century Movements for Black Lives.pptx4.16.24 21st Century Movements for Black Lives.pptx
4.16.24 21st Century Movements for Black Lives.pptxmary850239
 
Karra SKD Conference Presentation Revised.pptx
Karra SKD Conference Presentation Revised.pptxKarra SKD Conference Presentation Revised.pptx
Karra SKD Conference Presentation Revised.pptxAshokKarra1
 
What is Model Inheritance in Odoo 17 ERP
What is Model Inheritance in Odoo 17 ERPWhat is Model Inheritance in Odoo 17 ERP
What is Model Inheritance in Odoo 17 ERPCeline George
 
Influencing policy (training slides from Fast Track Impact)
Influencing policy (training slides from Fast Track Impact)Influencing policy (training slides from Fast Track Impact)
Influencing policy (training slides from Fast Track Impact)Mark Reed
 
INTRODUCTION TO CATHOLIC CHRISTOLOGY.pptx
INTRODUCTION TO CATHOLIC CHRISTOLOGY.pptxINTRODUCTION TO CATHOLIC CHRISTOLOGY.pptx
INTRODUCTION TO CATHOLIC CHRISTOLOGY.pptxHumphrey A Beña
 
Field Attribute Index Feature in Odoo 17
Field Attribute Index Feature in Odoo 17Field Attribute Index Feature in Odoo 17
Field Attribute Index Feature in Odoo 17Celine George
 
Virtual-Orientation-on-the-Administration-of-NATG12-NATG6-and-ELLNA.pdf
Virtual-Orientation-on-the-Administration-of-NATG12-NATG6-and-ELLNA.pdfVirtual-Orientation-on-the-Administration-of-NATG12-NATG6-and-ELLNA.pdf
Virtual-Orientation-on-the-Administration-of-NATG12-NATG6-and-ELLNA.pdfErwinPantujan2
 
MULTIDISCIPLINRY NATURE OF THE ENVIRONMENTAL STUDIES.pptx
MULTIDISCIPLINRY NATURE OF THE ENVIRONMENTAL STUDIES.pptxMULTIDISCIPLINRY NATURE OF THE ENVIRONMENTAL STUDIES.pptx
MULTIDISCIPLINRY NATURE OF THE ENVIRONMENTAL STUDIES.pptxAnupkumar Sharma
 
Student Profile Sample - We help schools to connect the data they have, with ...
Student Profile Sample - We help schools to connect the data they have, with ...Student Profile Sample - We help schools to connect the data they have, with ...
Student Profile Sample - We help schools to connect the data they have, with ...Seán Kennedy
 
AUDIENCE THEORY -CULTIVATION THEORY - GERBNER.pptx
AUDIENCE THEORY -CULTIVATION THEORY -  GERBNER.pptxAUDIENCE THEORY -CULTIVATION THEORY -  GERBNER.pptx
AUDIENCE THEORY -CULTIVATION THEORY - GERBNER.pptxiammrhaywood
 
4.18.24 Movement Legacies, Reflection, and Review.pptx
4.18.24 Movement Legacies, Reflection, and Review.pptx4.18.24 Movement Legacies, Reflection, and Review.pptx
4.18.24 Movement Legacies, Reflection, and Review.pptxmary850239
 
HỌC TỐT TIẾNG ANH 11 THEO CHƯƠNG TRÌNH GLOBAL SUCCESS ĐÁP ÁN CHI TIẾT - CẢ NĂ...
HỌC TỐT TIẾNG ANH 11 THEO CHƯƠNG TRÌNH GLOBAL SUCCESS ĐÁP ÁN CHI TIẾT - CẢ NĂ...HỌC TỐT TIẾNG ANH 11 THEO CHƯƠNG TRÌNH GLOBAL SUCCESS ĐÁP ÁN CHI TIẾT - CẢ NĂ...
HỌC TỐT TIẾNG ANH 11 THEO CHƯƠNG TRÌNH GLOBAL SUCCESS ĐÁP ÁN CHI TIẾT - CẢ NĂ...Nguyen Thanh Tu Collection
 
Active Learning Strategies (in short ALS).pdf
Active Learning Strategies (in short ALS).pdfActive Learning Strategies (in short ALS).pdf
Active Learning Strategies (in short ALS).pdfPatidar M
 

Recently uploaded (20)

ANG SEKTOR NG agrikultura.pptx QUARTER 4
ANG SEKTOR NG agrikultura.pptx QUARTER 4ANG SEKTOR NG agrikultura.pptx QUARTER 4
ANG SEKTOR NG agrikultura.pptx QUARTER 4
 
Difference Between Search & Browse Methods in Odoo 17
Difference Between Search & Browse Methods in Odoo 17Difference Between Search & Browse Methods in Odoo 17
Difference Between Search & Browse Methods in Odoo 17
 
Food processing presentation for bsc agriculture hons
Food processing presentation for bsc agriculture honsFood processing presentation for bsc agriculture hons
Food processing presentation for bsc agriculture hons
 
Global Lehigh Strategic Initiatives (without descriptions)
Global Lehigh Strategic Initiatives (without descriptions)Global Lehigh Strategic Initiatives (without descriptions)
Global Lehigh Strategic Initiatives (without descriptions)
 
4.16.24 21st Century Movements for Black Lives.pptx
4.16.24 21st Century Movements for Black Lives.pptx4.16.24 21st Century Movements for Black Lives.pptx
4.16.24 21st Century Movements for Black Lives.pptx
 
YOUVE_GOT_EMAIL_PRELIMS_EL_DORADO_2024.pptx
YOUVE_GOT_EMAIL_PRELIMS_EL_DORADO_2024.pptxYOUVE_GOT_EMAIL_PRELIMS_EL_DORADO_2024.pptx
YOUVE_GOT_EMAIL_PRELIMS_EL_DORADO_2024.pptx
 
Karra SKD Conference Presentation Revised.pptx
Karra SKD Conference Presentation Revised.pptxKarra SKD Conference Presentation Revised.pptx
Karra SKD Conference Presentation Revised.pptx
 
What is Model Inheritance in Odoo 17 ERP
What is Model Inheritance in Odoo 17 ERPWhat is Model Inheritance in Odoo 17 ERP
What is Model Inheritance in Odoo 17 ERP
 
Influencing policy (training slides from Fast Track Impact)
Influencing policy (training slides from Fast Track Impact)Influencing policy (training slides from Fast Track Impact)
Influencing policy (training slides from Fast Track Impact)
 
INTRODUCTION TO CATHOLIC CHRISTOLOGY.pptx
INTRODUCTION TO CATHOLIC CHRISTOLOGY.pptxINTRODUCTION TO CATHOLIC CHRISTOLOGY.pptx
INTRODUCTION TO CATHOLIC CHRISTOLOGY.pptx
 
Field Attribute Index Feature in Odoo 17
Field Attribute Index Feature in Odoo 17Field Attribute Index Feature in Odoo 17
Field Attribute Index Feature in Odoo 17
 
Virtual-Orientation-on-the-Administration-of-NATG12-NATG6-and-ELLNA.pdf
Virtual-Orientation-on-the-Administration-of-NATG12-NATG6-and-ELLNA.pdfVirtual-Orientation-on-the-Administration-of-NATG12-NATG6-and-ELLNA.pdf
Virtual-Orientation-on-the-Administration-of-NATG12-NATG6-and-ELLNA.pdf
 
MULTIDISCIPLINRY NATURE OF THE ENVIRONMENTAL STUDIES.pptx
MULTIDISCIPLINRY NATURE OF THE ENVIRONMENTAL STUDIES.pptxMULTIDISCIPLINRY NATURE OF THE ENVIRONMENTAL STUDIES.pptx
MULTIDISCIPLINRY NATURE OF THE ENVIRONMENTAL STUDIES.pptx
 
Student Profile Sample - We help schools to connect the data they have, with ...
Student Profile Sample - We help schools to connect the data they have, with ...Student Profile Sample - We help schools to connect the data they have, with ...
Student Profile Sample - We help schools to connect the data they have, with ...
 
AUDIENCE THEORY -CULTIVATION THEORY - GERBNER.pptx
AUDIENCE THEORY -CULTIVATION THEORY -  GERBNER.pptxAUDIENCE THEORY -CULTIVATION THEORY -  GERBNER.pptx
AUDIENCE THEORY -CULTIVATION THEORY - GERBNER.pptx
 
Raw materials used in Herbal Cosmetics.pptx
Raw materials used in Herbal Cosmetics.pptxRaw materials used in Herbal Cosmetics.pptx
Raw materials used in Herbal Cosmetics.pptx
 
4.18.24 Movement Legacies, Reflection, and Review.pptx
4.18.24 Movement Legacies, Reflection, and Review.pptx4.18.24 Movement Legacies, Reflection, and Review.pptx
4.18.24 Movement Legacies, Reflection, and Review.pptx
 
YOUVE GOT EMAIL_FINALS_EL_DORADO_2024.pptx
YOUVE GOT EMAIL_FINALS_EL_DORADO_2024.pptxYOUVE GOT EMAIL_FINALS_EL_DORADO_2024.pptx
YOUVE GOT EMAIL_FINALS_EL_DORADO_2024.pptx
 
HỌC TỐT TIẾNG ANH 11 THEO CHƯƠNG TRÌNH GLOBAL SUCCESS ĐÁP ÁN CHI TIẾT - CẢ NĂ...
HỌC TỐT TIẾNG ANH 11 THEO CHƯƠNG TRÌNH GLOBAL SUCCESS ĐÁP ÁN CHI TIẾT - CẢ NĂ...HỌC TỐT TIẾNG ANH 11 THEO CHƯƠNG TRÌNH GLOBAL SUCCESS ĐÁP ÁN CHI TIẾT - CẢ NĂ...
HỌC TỐT TIẾNG ANH 11 THEO CHƯƠNG TRÌNH GLOBAL SUCCESS ĐÁP ÁN CHI TIẾT - CẢ NĂ...
 
Active Learning Strategies (in short ALS).pdf
Active Learning Strategies (in short ALS).pdfActive Learning Strategies (in short ALS).pdf
Active Learning Strategies (in short ALS).pdf
 

HCT Solar Desalination Project

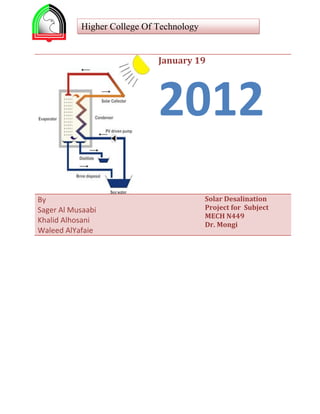
  • 1. Higher College Of Technology January 19 2012 By Solar Desalination Sager Al Musaabi Project for Subject MECH N449 Khalid Alhosani Dr. Mongi Waleed AlYafaie
  • 2. Solar Desalination Project 2012 Abstract ......................................................................................................................................................... 4 The results found from the calculations ....................................................................................................... 5 Introduction .................................................................................................................................................. 6 Type of desalination method ........................................................................................................................ 7 Multiple effect solar stills.......................................................................................................................... 7 Humidification–dehumidification systems ............................................................................................... 7 Economics ................................................................................................................................................. 8 Illustration of solar desalination design ........................................................................................................ 8 Process flow diagram .................................................................................................................................. 12 Project proposal .......................................................................................................................................... 17 The results found from the calculations ..................................................................................................... 18 Literature Review ........................................................................................................................................ 20 Desalination: .......................................................................................................................................... 21 Reverse osmosis(RO): ............................................................................................................................. 21 Process: ............................................................................................................................................... 22 Industrial Applications ....................................................................................................................... 23 Multi-stage flash distillation (MSF): ....................................................................................................... 24 Process: ............................................................................................................................................... 24 Industrial Applications ........................................................................................................................ 25 Solar thermal energy: ............................................................................................................................. 25 Parabolic Trough: ................................................................................................................................ 25 Solar Power tower: ............................................................................................................................. 26 Dish Technology: ................................................................................................................................. 26 Solar Desalination: .............................................................................................................................. 27 Technology .............................................................................................................................................. 28 Project Time line ......................................................................................................................................... 28 Calculation .................................................................................................................................................. 29 2 Compare the process with and without vacuum pump ......................................................................... 32 Calculated area of reflector: ................................................................................................................... 34 MECH N449 | HCT, Abu Dhabi
  • 3. Solar Desalination Project 2012 Calculate the mass flow rate of circulated water ................................................................................... 34 Calculation of caused by reflector. .................................................................................................... 35 Calculation with respect to area of reflector ...................................................................................... 35 Calculation with respect to fluid type. .................................................................................................... 39 Calculation on the desalination side. ...................................................................................................... 39 The effect of attaching vacuum pump to desalination unit ................................................................... 42 Calculation for parabolic dish ................................................................................................................. 44 Conclusion ................................................................................................................................................... 47 Ease of safe operation ............................................................................................................................ 47 Equipment and Clothing ..................................................................................................................... 47 Surrounding Area ................................................................................................................................ 47 Starting a Machine .............................................................................................................................. 47 Conclusion ................................................................................................................................................... 47 Comments on the project: ...................................................................................................................... 48 Problems encountered ........................................................................................................................... 48 Recommendations .................................................................................................................................. 49 Appendix ..................................................................................................................................................... 49 SOLAR RADIATION REACHING THE EARTH SURFACE .............................................................................. 49 Thermal Conductivity .............................................................................................................................. 52 Emissivity................................................................................................................................................. 53 Project main part ........................................................................................................................................ 56 References: ................................................................................................................................................. 58 3 MECH N449 | HCT, Abu Dhabi
  • 4. Solar Desalination Project 2012 Abstract The main aim of this project is to treated the salty water from the sea or from Groundwater wells and make it drinkable or usable for aggregation in the united Arabic emirates .Thanks to the large scale of solar heat available in the region where the UAE located, the utilization of that source will be investigated in the project. The concept of a solar distillation system uses low grade heat. The system utilizes vacuum pump or it can use the gravity forces to create vacuum under which water can be evaporated at lower temperatures than conventional techniques, This would allow the use of low grade heat sources, such as parabolic solar collectors or even inexpensive flat plate. A good feature of the system is that the evaporation and condensation take place at same locations without using another heat source. That helps us in making compact and portable design. The system consists of solar collectors, an evaporator, and pumps to supply the salty water and withdraw the concentrated brine and also to create a vacuum in the evaporator. The evaporator is connected to the condenser where the produced vapor is condensed and collected as the product. In the use of gravity force to create vacuum both, the evaporator and condenser are placed at a height of about 10 m (the height required to have a water column that would balance the atmospheric pressure) from the ground level. The evaporator is connected to the salty water supply, and concentrated brine tanks, and the condenser is connected to the fresh water tank. All tanks are kept at the ground level. On the other hand, vacuum pump can be attached to the evaporator in case of availability of electricity source and space. In this research the concept of the system will be examine to see the effects of various operating 4 conditions: size of the evaporator, capacity rate of the pumps, and thermal resistance of material MECH N449 | HCT, Abu Dhabi
  • 5. Solar Desalination Project 2012 used, and heat source temperature. In addition, approximate estimation of the project cost will be included at the end of the report to compare with the existing system in market. The results found from the calculations To produce amount of 1L per minute of distilled water, we found that it requires an energy between 52 to 55 kj/kg. Also we have the heat flux of the sun for the earth is about 95012 W/m2. Therefore, an area of 1 meter square will reflect 950 with emissivity of 1. Another point is the mass flow rate. As the water has heat capacity of 4.1813 and the volume flow rate of circulating water is L per minute and the mass flow rate using the formula of ( ). Table 1 The results of solar desalination Parameter Formula Amount Heat flux 95012 W/m2 of the earth For 1 square meter of area has heat flux of 950 W. Temperature difference of inlet 28 and outlet of heat collection element. Heat transfer ( solar side) 2435.47 Kw Heat transfer (desalination 2435.47 Kw side) Mass flow rate of sea water 7.6 Kg/s 5 MECH N449 | HCT, Abu Dhabi
  • 6. Solar Desalination Project 2012 Introduction Due to the increase in population growth UAE and in other Arabic gulf countries, the demand of fresh water has been increase. That increase opposed with shortage of fresh water sources in the region due to the nature of desert and as an effect of the global warming. The gulf region has abundant seawater resources and a good level of solar radiation, which could be used to produce drinking water from seawater. Although everybody recognizes the strong potential of solar thermal energy to seawater desalination, the process is not yet developed at commercial level. The main reason for that is the technology considered expensive compared with using facial. Nevertheless, it is also recognized that there is still important room to improve desalination systems based on solar thermal energy. The use of solar distillation has been practiced for a long time, and it gained more attraction after the First World War. Solar desalination is suitable for remote, arid and semi-arid areas, where drinking water shortage is a major problem and solar radiation is high. The limitations of solar energy utilization for desalination are the high initial cost for renewable energy devices and intermittent nature of the sun. Due to these limitations the present capacity of solar desalination systems worldwide is about 0.01% of the existing large-scale conventional desalination plants [3]. So, efforts must be made to develop technologies, which will collect and use renewable 6 energy more efficiently and cost effectively to provide clean drinking water besides developing technologies to store this energy to use it whenever it is unavailable. MECH N449 | HCT, Abu Dhabi
  • 7. Solar Desalination Project 2012 The combination of solar energy with desalination processes can be classified into two main categories: 100% solar driven desalination plants or partial solar powered desalination plants. Solar plants could be designed to operate in a fully automatic fashion in the sense that when the sun rises, heat collection process is initiated automatically by a sensor measuring the solar radiation. Type of desalination method Multiple effect solar stills Multiple-effect solar desalination systems are more productive than single effect systems due to the reuse of latent heat of condensation. The increase in efficiency, though, must be balanced against the increase in capital and operating costs. The efficiency of a multiple-effect solar still can be increased, for example, by inclining the glass cover surface towards the sun and installing grooves on the upper surface of the glass to hold and warm the saline water before it enters the still. The efficiency of the system can also be improved by running it in an upward-type mode. The addition of flat plate collectors and heat exchangers to transfer waste heat from local industry provides an additional way of enhancing the productivity. Humidification–dehumidification systems Several pilot plants have been developed over the past four decades. One such plant employed solar absorbers to preheat the water before it was circulated through an evaporation chamber. Another system employed a solar pond to load the air with humidity followed by a dehumidification column to collect the fresh water. A closed air cycle humidification– 7 dehumidification desalination process has also been used in combination with a flat-plate solar MECH N449 | HCT, Abu Dhabi
  • 8. Solar Desalination Project 2012 collector. An open-air open-water humidification–dehumidification greenhouse structure was developed for desalination and for crop growth. The Seawater Greenhouse uses seawater evaporators to cool and humidify the air. The greenhouse acts as a solar still while providing a controlled environment suited to the cultivation of crops. Economics Lower operating costs in the form of alternative energy sources (e.g. waste heat or wind energy) have been found to be key factors in the economic viability of solar desalination systems. Solar still plants have a mean lifetime of about 20 years while the cost of fresh water produced by solar plants ranges from US $0.52 m–3 to US $2.99 m–3, depending on the plant and the cost analysis method. It is important to realize that maximum output does not mean that a solar still is the most economical. Illustration of solar desalination design The project consists of two main parts, the solar part and desalination par. The solar par is where the solar energy is absorbed and water is circulated. The desalination part is where desalination take place and then it IS condensed . In the solar part The process begin when sun wave reflected by reflector sheet with parabolic shape which will direct the array of sun wave in to focal point. In the focal the thermal receiver pipe is located. This receiver will absorb the reflected heat and transfer it to circulated water. The water then flow through the pips to heat exchanger chamber (where the desalination take 8 place) and the heat gained process 1 will loosen in here . After the water passed throw heat MECH N449 | HCT, Abu Dhabi
  • 9. Solar Desalination Project 2012 exchanger tube it flow to the suction of the circulation pump. The circulation pump then forces the water to flow back to thermal receiver pipe. And the process will repeat itself. In the desalination part, first sea water come from supply to heat exchanger chamber to occupy one litter volume. The inlet valve then closed. The sea water after that will be gaining heat from circulating water through the heating tube. The pressure inside the chamber will be vacuumed and that cased by vacuumed pump. With the vacuumed pressure sea water can boil in lower temperature than under atmospheric pressure. After it start boiling The steam will sucked by vacuum pump and drive it to pass throw condenser. the condenser then will remove heat from the steam by air so steam will changed to water . the concentration of salt can be controlled by flashing the chamber after producing 30% of volume of sea water distilled water. for example if there is 1 L of sea water inside the chamber and we have produced 0.3 L of distilled water both drain and inlet valves will open to flash the chamber. 9 MECH N449 | HCT, Abu Dhabi
  • 10. Solar Desalination Project 2012 Figure 1 shows main component of the desalination unit and the process flow diagram. Figure 1 Table 2 explain the function of project main components also it has the formula used to calculate power for each part Table 2 Equipment name Function Equation to find energy Solar collector Reflect solar heat and direct it to focal point where water is boiled Boiler Generate steam Heat exchange Solar side Transfer the solar heat to sea 10 chamber water to increase the sea MECH N449 | HCT, Abu Dhabi
  • 11. Solar Desalination Project 2012 water temperature Desalination Contain sea water and form a Sid e chamber pump Pump the condensed water Vacuum pump To lower the pressure inside the chamber which will lower the boiling point of water Steam condenser To remove heat from steam and change it to liquid phase 11 MECH N449 | HCT, Abu Dhabi
  • 12. Solar Desalination Project 2012 Process flow diagram Figure 2 shows flow process diagram of the project followed by 2 tables. One for the equipment and pipe line list and its description. Figure 2(process flow ) Euipment list Pipe line list Item number Describtion Item number Describtion E-1 vacuum P-1 pump discharge E-2 circulation pump P-2 disalination chamber inlet E-4 solar collector P-3 disalination chamber outlet E-5 Disalination chamber P-4 sea water inlet E-7 air cooling condensor P-5 steam outlet E-6 P-6 condensor inlet E-7 P-7 condensate 12 MECH N449 | HCT, Abu Dhabi
  • 13. Solar Desalination Project 2012 Figure 3(3D project diagram) 13 MECH N449 | HCT, Abu Dhabi
  • 14. Solar Desalination Project 2012 Figure 4(project front view) Table 3(item list for figure 1 and 2) Item Item name Item number number 1 Circulation pump 7 Distilled water outlet 14 2 Collector 8 Desalination chamber MECH N449 | HCT, Abu Dhabi
  • 15. Solar Desalination Project 2012 3 condenser 9 Steam out let 4 Vacuum pump 10 Circulation water inlet 5 Cooling fan 11 Circulation water outlet 6 Common drive sprocket The figure5 shows that both circulation and vacuum pumps with the cooling fan are linked with foot peddle so it can be drive manually and That followed by table 4 which include part list Figure 5(pumps and fan operation) 15 MECH N449 | HCT, Abu Dhabi
  • 16. Solar Desalination Project 2012 Table 4(figure 5) part list Item number Item name Item number Item name 1 Foot paddle 7 Condenser inlet 2 Driver sprocket 8 Condenser outlet 3 Speed increase sprocket 9 Cooling fun 4 Vacuum pump 10 Condenser 5 Steam inlet 11 Chain 6 Steam outlet 16 MECH N449 | HCT, Abu Dhabi
  • 17. Solar Desalination Project 2012 Project proposal Due to the increase in population growth UAE and in other Arabic gulf countries, the demand of fresh water has been increase. That increase opposed with shortage of fresh water sources in the region due to the nature of desert and as an effect of the global warming. The gulf region has abundant seawater resources and a good level of solar radiation, which could be used to produce drinking water from seawater. Although everybody recognizes the strong potential of solar thermal energy to seawater desalination, the process is not yet developed at commercial level. The main reason for that is the technology considered expensive compared with using facial. Nevertheless, it is also recognized that there is still important room to improve desalination systems based on solar thermal energy. 17 MECH N449 | HCT, Abu Dhabi
  • 18. Solar Desalination Project 2012 The results found from the calculations To produce amount of 1L per minute of distilled water, we found that it requires an energy between 52 to 55 kj/kg. Also we have the heat flux of the sun for the earth is about 95012 W/m2. Therefore, an area of 1 meter square will reflect 950 with emissivity of 1. Another point is the mass flow rate. As the water has heat capacity of 4.1813 and the volume flow rate of circulating water is L per minute and the mass flow rate using the formula of ( ). Table 5 The results of solar desalination Parameter Formula Amount Heat flux 95012 W/m2 of the earth For 1 square meter of area has heat flux of 950 W. Temperature difference of inlet 28 and outlet of heat collection element. Heat transfer ( solar side) 2435.47 Kw Heat transfer (desalination 2435.47 Kw side) Mass flow rate of sea water 7.6 Kg/s 18 MECH N449 | HCT, Abu Dhabi
  • 19. Solar Desalination Project 2012 The following table contain important parameters with respect of size Table 6 Results calculated Area Pressure inside the desalination Mass flow rate chamber 1 m2 100 KPa 0.365 70 KPa 0.375 50 KPa 2 m2 100 KPa 0.73 70 KPa 0.75 50 KPa 19 MECH N449 | HCT, Abu Dhabi
  • 20. Solar Desalination Project 2012 Literature Review first green house effect was discovered in the third century before J.C, by Archimedes and 100 years after J.C, by heron of Alexandria, in 1615 by salmon de gauss, in 1974 by Joseph priestly and in 1878 a solar still of 500 m 2 has been set up in the desert of Atacama (chila), in order to supply in water a mine of sodium nitrate. After 1878, work on solar energy has slow down because of fossil energy availability in a lower cost. Solar energy has been reused from 1902 to 1908, by Schumann who built up solar machines with much horse power to pump water.  Solar energy has been reused from 1902 to 1908, by Schumann who built up solar machines with much horse power to pump water.  In 1913, boys set up, near Cairo (Egypt), big machines of 50 horse power with lengthy parabolic cylinders which concentrates solar radiation upon a central pipe with a concentration factor of 4.5, in order to pump water from the Nile River for irrigation purpose.  Solar energy still being used till 1938,from which there was no other progress in solar energy field, because of its lack of competitiveness compared to energy issued from fossil fuel, from 1950, use of solar energy , began to develop slowly among solar energy uses. 20 MECH N449 | HCT, Abu Dhabi
  • 21. Solar Desalination Project 2012 Desalination: 1 Desalination process is a process that separate low concentration saline water (fresh water) from the other dissolved salts (the concentrate).with proper energy, a lot of technologies can be used to produce fresh water. The desalination can become viable as the technology improves but put in mind that the amount of feed water discharged to waste in the brine stream varies from 20% to 70% of the feed flow. Desalination process is by far beneficiary to communities such as the UAE where it is more efficient to desalinate than buying water. There are several technologies that can be used in our country such as the multistage such as: Figure 6 Reverse osmosis(RO) 23: This method was developed for more than four decades and proven to be successful where it was introduced to the commercial business because it had a decontaminating capability, and it was a good choice for expensive costly and energy-wasteful distillation units. Reverse osmosis is the opposite of natural osmosis its where water will move from stronger saline to weaker saline solution through a semi-permeable membrane that will prevent molecules larger than water to go through, and this is why salt is left behind because it is physically larger than water molecule (Figure 6). This semi-permeable membrane is good for desalinating water 1 http://www.environment.gov.au/soe/2006/publications/emerging/desal/pubs/desal.pdf 21 2 http://www.allaboutwater.org/reverse-osmosis.html 3 http://www.islandnet.com/~tiger/Tiger/RO/how_ro_works.htm MECH N449 | HCT, Abu Dhabi
  • 22. Solar Desalination Project 2012 but on the other hand it is not a full process if the water is used by humans, because there are some contaminants that are smaller than water particles so they also migrate to the distilled water tank, another aspect is that reverse osmosis removes alkaline mineral constituents which will produce acidic water that is bad if drank by humans. Process: 1. Force or pressure and temperature must be added on the water to reverse the flow of water. 2. Water will go through the semi-permeable membrane 3. Water molecules and particles with smaller dimension will pass by the membrane through the pores 4. Chlorine must be added to kill bacteria 22 Figure 7 MECH N449 | HCT, Abu Dhabi
  • 23. Solar Desalination Project 2012 Industrial Applications 4 Reverse osmosis systems can be used to treat boiler feed water, industrial wastewater, process water and more. A few of the major uses are:  Boiler Feed Water Treatment: RO is used to reduce the solids content of waters prior to feeding into boilers for the power generation and other industries.  Pharmaceutical: Reverse osmosis is an approved treatment process for the production of United States Pharmacopeia (USP) grade water for pharmaceutical applications.  Food & Beverage: Water used to process food products and to produce beverages is often treated by a reverse osmosis system.  Semiconductor: Reverse osmosis is an accepted component of a treatment process to produce ultrapure water in the semiconductor industry.  Metal Finishing: RO systems have been successfully applied to a variety of metal finishing operations including several types of copper, nickel and zinc electroplating; nickel acetate seal; and black dye. 23 4 http://www.wateronline.com/article.mvc/Use-Of-Reverse-Osmosis-Increasing-In-Industri-0001 MECH N449 | HCT, Abu Dhabi
  • 24. Solar Desalination Project 2012 Multi-stage flash distillation (MSF): 5 It’s a water desalination process that boil water to form steam and this steam will go through multiple chambers where it will be heated by a heat exchanger. Process6: 1. Feed water at the cold inlet temperature is pumped 2. Water temperature increase when going through the heat exchanger 3. Brine water will enter the stages and in each stage a small fraction of water will boil 4. Remnant of the brine water will go out through the discharge nozzle 5. The resulting steam will cool and condenses to form fresh water and in the same time used to heat the feed water(it is a little hot than the feed water) Figure 8 24 5 http://www.allaboutwater.org/distillation.html 6 http://www.sidem-desalination.com/en/process/MSF/ MECH N449 | HCT, Abu Dhabi
  • 25. Solar Desalination Project 2012 Industrial Applications  Oil refining: to make it a possible fuels for cars, and when properly chemically processed it can produce a variety of hydrocarbons like jet fuel, plastics, tires and crayons  Desalinizing water: to produce fresh water in lands who suffer from the scarcity of water  Clorosilanes: using distillation it can produce highest grades of silicon that are used to manufacture semi-conductors  Medicine: used to manufacture pharmaceutical and vitamins Solar thermal energy 7: Solar energy is renewable energy which play very important role and it’s the most important renewable energy in the world. The efficiency of the solar energy depends on the available sunlight which is different from place to another. That can be caused by cloudy weather or differences in latitude. On other hand, the seasons also affect the solar energy. For instance, in summer, the day is longer than night and the angle of the sun is higher which provide much stronger solar power than in winter. The electrical power that is produced due to sun called the solar thermal power. There are 3 types of solar thermal energies such as the parabolic trough, solar power tower and the dish design. Parabolic Trough8: From 1983 to 1989, nine parabolic trough power plants were built by Luz Solar Partners Ltd in California desert. The plant was able to have 354 MW of capacity. That was by the big support of the government to have solar power industry. However in that time, the prices of energy went down and the need of the renewable energy decreased. Also the support from 25 7 http://interestingenergyfacts.blogspot.com/2008/04/solar-energy-more-advanatges-than.html 8 http://www.solardesalination.com.au/content/Parabolic-Trough-Solar-Power-History.html MECH N449 | HCT, Abu Dhabi
  • 26. Solar Desalination Project 2012 government was only for short period and even not sure. In 1990 Luz doesn’t have enough money. Therefore, he sold his power stations to Florida-based utility FPL and them still using it now. They have improved the power station. The 354 MW can now generate 2,325 MW of reliable electricity. Solar Power tower9: From 1982 to 1988, the biggest power tower plant was built. The power towers were able to produce large power production. The system was to convert the water into steam in the receiver to power the steam turbine. The heliostat field was consisting of 1818 heliostats in area of 39.3 m2. The power tower plant was able to generate 10MW for 8 hours daily in summer solstice and 4 hours daily in winter solstice. The disadvantage of the thermal storage system was more complicated and inefficient in terms of thermodynamic concept. Dish Technology10: Dish design is the oldest one among all the solar technologies. In 1901, Enemas in Pasadena, California have built a reflective dish that has surface area of 700 ft2 and operates 10 hp solar steam engine. Between 1907 and 1913, a solar-driven hydraulic pump was built by American engineer, F. Shuman. The disadvantage of this technology is that cost of solar dish is very high because it uses semi-conducting materials which used to build an efficient solar energy system. This is very costly compared by the costs of the electricity done by non-renewable energy. 9 http://www.solarpaces.org/CSP_Technology/docs/solar_tower.pdf 26 10 http://www.redrok.com/NewtonSolarSteamManuscript.pdf MECH N449 | HCT, Abu Dhabi
  • 27. Solar Desalination Project 2012 Another problem is that the dish technology requires a large area for installation because solar panels need very large area to reach the maximum efficiency. Also the location of the sun affects the efficiency of the solar dish system. Also the air pollution affects the efficiency of the system. Solar Desalination11: In 1869, Mouchot have made report of oldest document work on solar desalination of some Arab alchemist in the 15 century. The Arab alchemist had used the Damascus mirrors in solar desalination. The Damascus mirrors used to focus the sun radiation on a glass container that has salty water to make fresh water. In 1559, the scientist Porta had produced seven methods of desalination. One of them is to convert water that have little amount of salt to fresh water. Another achievement is that he produced another method called the humidification/dehumidification method. In 1774, the French chemist Lavoisier had used big lenses to collect the sun radiation placed on elaborate supporting structures to concentrate solar energy on the contents of distillation flasks. In 1870, the first American patent in desalination was for Wheeler and Evans. That patent has a lot of information needed for solar energy and corrosion problems. After two years, in 1872, a large solar distillation plant was built by Carlos Wilson, a Sweden engineer who designed it in Las Salinas, Chile. The main purpose of the plant was to produce fresh water. This plant transfers feed water that has high percentage of salinity of (140,000 ppm) to the stills. The material of the plant was wood and timber with one sheet of glass. The plant was able to produce 22.70 m3 of fresh water per day, (about 4.9 l/m2). From 1965 to 1970, a group of solar distillation was built in 4 different islands in Greek. It’s is the largest solar desalination plant ever built. The plant was able to produce a capacity of 2044 to 8640 m3/day. 27 11 http://membrane.ustc.edu.cn/paper/pdf/Seawater%20desalination%20using%20renewable%20energy%20sources.pd f MECH N449 | HCT, Abu Dhabi
  • 28. Solar Desalination Project 2012 Technology The solar desalination plant consists of solar energy collector. Seawater or salt water passing inside a central tube through the collator, and the sun causes evaporation. The steam condenses on the inside a tank. This water still must be treated with minerals before drinking Project Time line Figure 9 Team Name Mubarak Khaled Turbojet Engine Project Duration Tasks Start Date End Date (Days) Project Choosing 9/13/2011 4 9/16/2011 information about the project Gathering 9/19/2011 5 9/24/2011 Writing project proposal 9/24/2011 5 9/29/2011 Project Approval 9/29/2011 1 9/30/2011 Writing Literature Survey 9/30/2011 25 10/25/2011 Project Execution Plan 10/25/2011 5 10/30/2011 Distribution of Tasks 10/30/2011 5 11/4/2011 System Designing 11/4/2011 15 11/19/2011 Designing calculation 11/19/2011 10 11/29/2011 Visibility Study 11/29/2011 5 12/4/2011 Final report and presentation preparation 12/4/2011 30 1/3/2012 28 MECH N449 | HCT, Abu Dhabi
  • 29. Solar Desalination Project 2012 Calculation In order to design new solar unite to desalinate sea water we have to do the following procedure. 1. Find the required energy needed to vaporize the sea water. 2. Design source of energy capable to provide required energy. 3. Try to reduce size of the system. First we will see the required energy per unit mass to vaporize sea water. We can make assumption that the sate 1 is liquid and state 2 is superheated. Also we can assume the pressure created by the vaccume pump is 70 kpa absolute . So state 1 @ T=30 and P = 100kpa .state 2 @ T = 90 and P = 70 kpa. By using the HEI Condenser Performance Calculator we find the following result as it shows in figure 9 29 MECH N449 | HCT, Abu Dhabi
  • 30. Solar Desalination Project 2012 Figure 10 @ state 1 Cp equal 4.1784 kJ/kg/ and @ state 2 Cp equal 1.9918 kJ/kg/ To calculate the energy required to change state 1 to state 2 the following equation is used 30 MECH N449 | HCT, Abu Dhabi
  • 31. Solar Desalination Project 2012 If more vacuum is created inside the chamber the following calculation can be done P 2 = 50 kpa absolute and T2= 82 @ state 1 Cp equal 4.1784 kJ/kg/ and @ state 2 Cp equal 1.9650 kJ/kg/ 31 To calculate the energy required to change state 1 to state 2 the following equation is used MECH N449 | HCT, Abu Dhabi
  • 32. Solar Desalination Project 2012 Compare the process with and without vacuum pump In this process we have assume state 1 @ T=30 and P = 100kpa .state 2 @ T = 110 and P = 100 kpa. By using the HEI Condenser Performance Calculator we find the following result as it shows in figure 10 32 MECH N449 | HCT, Abu Dhabi
  • 33. Solar Desalination Project 2012 Figure 11 @ state 1 Cp equal 4.1784 kJ/kg/ and @ state 2 Cp equal 2.0147 kJ/kg/ To calculate the energy required to change state 1 to state 2 the following equation is used 33 MECH N449 | HCT, Abu Dhabi
  • 34. Solar Desalination Project 2012 That show with vacuum pump reduces the energy required to vaporize sea water. If we compare energy required with and without vacuum pump we can find difference of 8.6%. The desired output is to have 1 Liter/hour as a volume flow rate, which is equivalent to 1/3600 Kg/Second, then we multiple = 0.01555 kJ/seconds = 0.01555 watt This energy calculated is supplied from the collector with an assumption that there are no losses from thermal resistivity and all heat will transfer from the circulated water into sea water. Calculated area of reflector: In order to calculate the surface area of the reflector, we have to use the value of heat flux (950 W/m²) and the energy required = =0.0589 m² Calculate the mass flow rate of circulated water = In the previous calculation (required energy), the temperature difference between sea water inlet and evaporation of sea water is found to be 60˚C( and this difference is caused by vaporization of sea water in order to recover these . losses we have to add the loss in the temperature difference through the collector therefore we can assume the through the 34 collector is 60˚C. MECH N449 | HCT, Abu Dhabi
  • 35. Solar Desalination Project 2012 Average cp = = the average specific heat capacity is = = 0.278 kg/s Calculation of caused by reflector. To calculate the capacity of distilled water provided by the system we should rely of several thinks such as mass flow rate, area of reflector, type of liquid used in hot side (reflector side ) Calculation with respect to area of reflector In the first calculation we will see how the area of reflector will affect the performance of the system. Depend on our finding the heat flux of the sun on the earth surface is approximate 95012 W/m2. So for example one square meter of reflector will reflect 950w if the emissivity is 1. That means 950 w will reflect onto a receiver pipe (also called “absorber pipe or heat collection element”) placed at the focal line of the parabolic surface. Moreover, second assumption is that water is used as thermal fluid. The specific heat capacity of water is 4.1813 . The volume flow rate of circulating water is ½ L per mint which is equal to 8.3 m3. Since the density of water is 958.4 @ 100 13 . from that we can calculate the mass flow rate . 35 12 http://home.iprimus.com.au/nielsens/solrad.html 13 http://en.wikipedia.org/wiki/Density MECH N449 | HCT, Abu Dhabi
  • 36. Solar Desalination Project 2012 by assume that all reflected heat are absorbed by the water and there is no loses due to thermal resistivity of the heat collection element material , then the deference of temperature can be calculated . That give us equation # 1 =28 That means the deference between the inlet and the outlet of the heat collection element. If the area of reflector is doubled(2m2) then the temperature deferent will be as following =56 Other way to calculate the calculate the rate of heat transfer is by the following equation. equation # 2 In the calculation done ahead we found that 56 can be added to water that mean if the initial state of water is @ T =70 &P= 100 Kpa , the final state is T=70 + 56 = 126 ,because we assume the process is isobaric so P2 = P1 = 100 Kpa 36 MECH N449 | HCT, Abu Dhabi
  • 37. Solar Desalination Project 2012 By using With HEI Condenser Performance Calculator14 we find that at initial state of water after the circulation pump and before entering collector receiver the enthalpy is 293.0289 and final state is 2728.4964 . figure 11 shows pictures of calculation don by the program done for the last calculation . Figure 12 Sample calculation don by HEI Condenser Performance Calculator Initial state of water Final state of steam @temp 70 and pressure equal to 100 Kpa, @temp 126 and pressure equal to 100 Kpa, enthalpy is 293.0289 KJ/Kg enthalpy is 2728.4964 KJ/Kg The specific volume 0.001m3/Kg The specific volume 1.8215m3/Kg 37 14 http://www.dofmaster.com/steam.html MECH N449 | HCT, Abu Dhabi
  • 38. Solar Desalination Project 2012 After find out the enthalpy for initial and final state we can use the equation #2 Equation # 2 .0289) = 2435.47 Kw To reach to the desired heat transfer we have to calculate the required area of calculator. Since heat flux is 950 W/m2 and desired heat transfer is 2435.47 Kw In first step we did the assumption that specific heat capacity is equal in the initial and final state. We did that just to find out a point from which we can start. Therefore there is error in the first and second. And also more error can be found if calculate the thermal heat resistance of heat collection element and if taking in consideration the emissivity of reflector sheet. 38 MECH N449 | HCT, Abu Dhabi
  • 39. Solar Desalination Project 2012 Calculation with respect to fluid type. 15 If motor oil is used as thermal fluid the specific heat capacity will changed to 2 from that the result well be as the following =120 We can summarize motor oil required less energy to increase its temperature by one degree. That mean the area of reflector will be smaller to provide required heat. Calculation on the desalination side. From the previous calculation for the reflector side we found the deference in temperature is 120 . If we assume the all heat are absorbed by sea water and there is no thermal resistance for 16 tube material inside the desalination unit, The heat capacity of sea water is almost 4 ,the following calculation can be done. Equation 1 By making assumption of the all heat added to water by the collector are absorbed by the water in the desalination unit. In previous calculation we found that rate of heat added to water is 39 15 http://www.engineeringtoolbox.com/specific-heat-fluids-d_151.html 16 http://www.kayelaby.npl.co.uk/general_physics/2_7/2_7_9.html MECH N449 | HCT, Abu Dhabi
  • 40. Solar Desalination Project 2012 2435.47 KW. And @ initial state of sea water P=100Kpa Atm and T= 30 and @ final state is T 110 and P= 100Kpa the mass flow rate can be calculated. Mass flow rate of sea water is equal to Mass flow rate is = 7.6 Kg/s Calculation using equation #2 @ State 1 of sea water T =30 P = 100 Kpa and @ state 2 T= 110 P=100 Kpa For state 1 from table A-4 @ T=30 P sat =4.246 kpa which is < P system so it is liquid (hf =125.79 kj/kg) .for state 2 @ T = 110 P sat =143.27 Kpa which is > P system 100 Kpa so it is superheated. From table A-6 enthalpy 2676.2 kj/kg. = (2676.2-125.9) = 2550.3 KJ/Kg By using the HEI Condenser Performance Calculator we find the following result as it show in figure 12 40 MECH N449 | HCT, Abu Dhabi
  • 41. Solar Desalination Project 2012 Figure 13 It shows that enthalpy @ initial stat equal to 125.7509KJ/Kg and @ final state equal 2696.383KJ/Kg Equation # 2 = (2696.383-125.7509) = 2570.6 KJ/Kg 41 = 0.9 Kg/s MECH N449 | HCT, Abu Dhabi
  • 42. Solar Desalination Project 2012 The effect of attaching vacuum pump to desalination unit The main reason of creating vacuum inside desalination unit is to lower the required energy to evaporate water. For example if pressure of 70 Kpa is applied on the sea water , it only required to raise the temperature to 90 to be at superheated steam state .as it shows in the figure 13. Figure 14 The required energy to evaporate the water can be found from calculating the change in enthalpy. The enthalpy founded using HEI Condenser Performance Calculator as it shows in figure 14 42 MECH N449 | HCT, Abu Dhabi
  • 43. Solar Desalination Project 2012 Figure 15 @ State 1 of sea water T =30 P = 100 Kpa and @ state 2 T= 90 P=70 Kpa For state 1 from table A-4 @ T=30 P sat =4.246 kpa which is < P system so it is liquid (hf =125.79 kj/kg) .for state 2 @ T = 90 P sat =70.14 Kpa which is P system that. From table A-6 enthalpy 2676.2 kj/kg. 43 = (2676.2-125.9) = 2550.3 KJ/Kg MECH N449 | HCT, Abu Dhabi
  • 44. Solar Desalination Project 2012 As it can be seen from the figure 14. @ State 1 T= 30 P=70 Kpa and @state 2 T= 90 P=70Kpa. Enthalpy is equal to 125.7235 KJ/Kg and 2660.1525 KJ/Kg respectively. There for change in enthalpy equal to (2660.1525-125.7235) = 2534.429 KJ/Kg The rate of heat absorb by sea water is equal to 0.0167 4 120 =8 Calculation for parabolic dish Figure 16 shows a parabola shape with all dimensions A torispherical dome is the surface obtained from the intersection of a spherical cap with a tangent torus, as illustrated above. The radius of the sphere is called the "crown radius," and the radius of the torus is called the "knuckle radius." Torispherical domes are used to construct pressure vessels. 17 44 17 http://mathworld.wolfram.com/TorisphericalDome.html MECH N449 | HCT, Abu Dhabi
  • 45. Solar Desalination Project 2012 Let be the distance from the center of the torus to the center of the torus tube, let be the radius of the torus tube, and let be the height from the base of the dome to the top. Then the radius of the base is given by . In addition, by elementary geometry, a torispherical dome 18 satisfies (1) So (2) The transition from sphere to torus occurs at the critical radius (3) So the dome has equation (4) Where (5) The torispherical dome has volume (6 ) (7 45 18 http://mathworld.wolfram.com/TorisphericalDome.html MECH N449 | HCT, Abu Dhabi
  • 46. Solar Desalination Project 2012 Table 7 Cost estimation Item Capacity/size Cost Circulation pump 1L/min(0.25 HP) 200 DHS Collector sheet 1m2 125 DHS/m2 Bicycle Height of 0.75 - 1.10 m (2.5 - 2000 DHS 3.5 ft.) Width of up to 0.61 m (2 ft.) Length of 1.5 - 1.8 m (5 - 6 ft.) Chains +gear +sprocket 1000 DHS Aluminum sheet 10cm x10 cm x30cm 500 DHS Piping and fittings Copper tubes + 500 DHS fittings Heavy duty 500 DHS polyethylene + fittings Temperature gauge 4 gauges 160x4 = 640 DHS 46 total 5465 DHS MECH N449 | HCT, Abu Dhabi
  • 47. Solar Desalination Project 2012 Conclusion Ease of safe operation Equipment and Clothing Avoid wearing long flowing clothes. Tie up long hair. Wear protective equipment such as a dust mask, gloves, eye protection, ear mufflers, jacket and boots that provide good grip on the floor. Surrounding Area Make sure the area around the machine is free of clutter and you have sufficient space to work. Do not work in poorly lit conditions or in positions that are uncomfortable to you. Notify a supervisor of such problems promptly. The machine must be positioned on a stable surface and must be a suitable distance away from you. Position yourself in a comfortable manner so that you do not have to reach out or bend. Starting a Machine Before starting a machine, check the machine guards and ensure they all fit and are in place. Ensure that any keys or wrenches are removed so they do not fly out and hit you or another person nearby. Never operate a machine if you notice loose parts, unusual sounds or vibrations. To avoid electric shocks, you must ensure that the machine is properly grounded. to do welding job make sure hat all required PPE are used and you must be aware how t do welding or as assistance from professional person. 47 MECH N449 | HCT, Abu Dhabi
  • 48. Solar Desalination Project 2012 Comments on the project: The project is a good start for desalination of sea water because the UAE is a desert country where fresh water is scarce and sea water is available. It’s a project that can be used in areas with a hot climate because it relies on the solar energy. One important factor that was taken into consideration that the team worked on making a solar desalination system that can be portable so it can be used on different applications. It is a project that is easy to manufacture by using basic concepts of thermodynamics, heat transfer and material selection. Moreover, the parts needed to fabricate such product are available in the local market. Problems encountered There are a lot of factors that affected the solar desalination performance such as:  Dust (the formation of the dust on the reflector sheet can eliminate or block the absorption of sun light which will negatively affect the system.  It can be operated in daytime only.  Pollution can be a disadvantage to solar panels, as pollution can degrade the efficiency of photovoltaic cells. Clouds also provide the same effect, as they can reduce the energy of the sun rays  The location of solar panels can affect performance, due to possible obstructions from the surrounding buildings or landscape 48 MECH N449 | HCT, Abu Dhabi
  • 49. Solar Desalination Project 2012 Recommendations since we are using single stage desalination it’s better to use multistage desalination for a better performance, another aspect is to place the solar system in a location that there are no building near so as the sun shifts the shadow of the buildings will not affect the process. Lastly if we are given more time, the building of the solar desalination system would have supported the calculations and it will help in finding errors if occurred. Appendix SOLAR RADIATION REACHING THE EARTH SURFACE The process of heat transfer from the sun to the surface of earth: The intensity of the solar radiation reaching us is about 1369 watts per square meter [W/m2]. This is known as the Solar Constant. It is important to understand that it is not the intensity per square meter of the Earth’s surface but per square meter on a sphere with the radius of 49 149,596.000 km and with the Sun at its center the atmosphere absorbs about 68 W/m2 and reflects 77 W/m2 (Wallace and Hobbs 1977). The radiation reaching the Earth’s surface is MECH N449 | HCT, Abu Dhabi
  • 50. Solar Desalination Project 2012 therefore on average 198 W/m2, i.e. 58% of the radiation intercepted by the Earth as it shows in figure16. 19 Figure 17 Figure 16. The distribution of the solar radiation. On average, each square meter of the upper regions of the atmosphere receives 342 watts of solar radiation [W/m2]. The atmosphere absorbs on average 67 W/m 2 and reflects 77 W/m2. About 198 W/m2 reaches the Earth's surface, of which 168 W/m2 is absorbed and 30 W/m2 is reflected back to space. The total of the reflected 50 19 http://home.iprimus.com.au/nielsens/solrad.html MECH N449 | HCT, Abu Dhabi
  • 51. Solar Desalination Project 2012 radiation is 107 W/m2, or 31% of the incoming radiation. Source: Modified figure of Houghton et al. 2001 The intensity of solar radiation depends on the time of the year and geographical positions as illustrated in Figure 17. Figure 18 Figure 17: The intensity of solar radiation (solar power) in various parts of the world depending on the season, measured in watts per square meter [W/m2]. Source: Sofia (Sharing of Free Intellectual Assets). 51 MECH N449 | HCT, Abu Dhabi
  • 52. Solar Desalination Project 2012 HANDY FORMULA to calculate how much energy we receive from the Sun: Equation 1 Where E is the solar energy in EJ, S is the Solar Constant in W/m2, n is the number of hours; r is the Earth's radius in km. This formula is for the total solar energy intercepted by the Earth in n hours. If you want to calculate how much of the solar energy reaches the Earth's surface, multiply the result by 0.58 Thermal Conductivity Thermal conductivity (λ) is the intrinsic property of a material which relates its ability to conduct heat. Heat transfer by conduction involves transfer of energy within a material without any motion of the material as a whole. Conduction takes place when a temperature gradient exists in a solid (or stationary fluid) medium. Conductive heat flow occurs in the direction of decreasing temperature because higher temperature equates to higher molecular energy or more molecular movement. Energy is transferred from the more energetic to the less energetic molecules when neighboring molecules collide. Thermal conductivity is defined as the quantity of heat (Q) transmitted through a unit thickness (L) in a direction normal to a surface of unit area (A) due to a unit temperature gradient (ΔT) 52 under steady state conditions and when the heat transfer is dependent only on the temperature gradient. In equation form this becomes the following: MECH N449 | HCT, Abu Dhabi
  • 53. Solar Desalination Project 2012 Thermal Conductivity = heat × distance / (area × temperature gradient) λ = Q × L / (A × ΔT) Emissivity The emissivity of a material (usually written ε or e) is the relative ability of its surface to emit energy by radiation. It is the ratio of energy radiated by a particular material to energy radiated by a black body at the same temperature. A true black body would have an ε = 1 while any real object would have ε < 1. Emissivity is a dimensionless quantity.20 In general, the duller and blacker a material is, the closer its emissivity is to 1. The more reflective a material is, the lower its emissivity. Highly polished silver has an emissivity of about 0.02 Low emissivity (low e) - actually low thermal emissivity - is a quality of a surface that radiates, or emits, low levels of radiant thermal (heat) energy. All materials absorb, reflect and emit radiant energy. This article is primarily about material properties within a special wavelength interval of radiant energy - namely thermal radiation of materials with temperatures approximately in the interval -40...60°C. Emissivity is the value given to materials based on the ratio of heat emitted compared to a blackbody, on a scale of 0 to 1. A blackbody would have an emissivity of 1 and a perfect reflector would have a value of 0. 53 20 http://en.wikipedia.org/wiki/Emissivity MECH N449 | HCT, Abu Dhabi
  • 54. Solar Desalination Project 2012 Reflectivity is inversely related to emissivity and when added together their total should equal 1 for an opaque material. Therefore, if asphalt has a thermal emissivity value of 0.90 its thermal reflectance value would be 0.10. This means that it absorbs and emits 90% of radiant thermal energy and reflects only 10%. Conversely, a low-e material such as aluminum foil has a thermal emissivity value of 0.03 and a thermal reflectance value of 0.97, meaning it reflects 97% of radiant thermal energy and emits only 3%. Low-emissivity building materials include window glass manufactured with metal-oxide coatings as well as housewrap materials, reflective thermal insulations and other forms of radiant thermal barriers. The thermal emissivity of various surfaces is listed in the following table [8] . Table 8 Materials surface Thermal emittance Asphalt 0.90-0.98 Aluminum foil 0.03-0.05 Brick 0.93 Concrete 0.85-0.95 Glass (unglazed) 0.95 Fiberglass/cellulose 0.80-0.90 Limestone 0.36-0.90 Marble 0.93 Paper 0.92 Plaster 0.91 Silver 0.02 Steel (mild) 0.12 Wood 0.90 54 MECH N449 | HCT, Abu Dhabi
  • 55. Solar Desalination Project 2012 Table 9 Material Thermal Conductivity Thermal Conductivity W/m, oK (cal/sec)/(cm2, oC/cm) Air at 0 C 0.024 0.000057 Aluminum 205.0 0.50 Brass 109.0 - Concrete 0.8 0.002 Copper 385.0 0.99 Glass, ordinary 0.8 0.0025 Gold 310 - Ice 1.6 0.005 Iron - 0.163 Lead 34.7 0.083 Polyethylene HD 0.5 - Polystyrene expanded 0.03 - Silver 406.0 1.01 Styrofoam 0.01 - Steel 50.2 - Water at 20 C - 0.0014 Wood 0.12-0.04 0.0001 55 MECH N449 | HCT, Abu Dhabi
  • 56. Solar Desalination Project 2012 Project main part Figure 18 show picture of the solar desalination unit with main component Figure 19 7 56 MECH N449 | HCT, Abu Dhabi
  • 57. Solar Desalination Project 2012 Table 10 shows name of equipment in figure 18 , its function and equation used to calculate energy Table 10 Equipment name Function Equation to find energy Solar collector Reflect solar heat and direct it to focal point where water is boiled Boiler Generate steam Heat exchange Solar side Transfer the solar heat to sea chamber water to increase the sea water temperature Desalination Contain sea water and form a Sid e chamber pump Pump the condensed water Vacuum pump To lower the pressure inside the chamber which will lower the boiling point of water Steam condenser To remove heat from steam and change it to liquid phase 57 MECH N449 | HCT, Abu Dhabi
  • 58. Solar Desalination Project 2012 References: http://www.solardesalination.com.au/content/Parabolic-Trough-Solar-Power-History.html http://www.solarpaces.org/CSP_Technology/docs/solar_tower.pdf http://interestingenergyfacts.blogspot.com/2008/04/solar-energy-more-advanatges-than.html http://www.redrok.com/NewtonSolarSteamManuscript.pdf http://membrane.ustc.edu.cn/paper/pdf/Seawater%20desalination%20using%20renewable%20en ergy%20sources.pdf http://www.islandnet.com/~tiger/Tiger/RO/how_ro_works.htm http://www.allaboutwater.org/reverse-osmosis.html http://www.environment.gov.au/soe/2006/publications/emerging/desal/pubs/desal.pdf http://www.wateronline.com/article.mvc/Use-Of-Reverse-Osmosis-Increasing-In-Industri-0001 http://www.sidem-desalination.com/en/process/MSF/ http://en.wikipedia.org/wiki/Emissivity 58 MECH N449 | HCT, Abu Dhabi