
Recomendados
Recomendados
Más contenido relacionado
La actualidad más candente
La actualidad más candente (20)
Destacado
Destacado (14)
Similar a RGS conference 2014 presentation
Similar a RGS conference 2014 presentation (20)
Último
Último (20)
RGS conference 2014 presentation
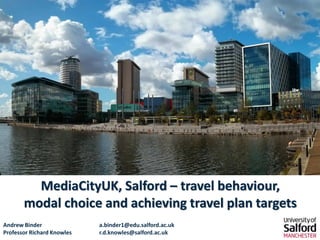
- 1. 1 MediaCityUK, Salford –travel behaviour, modal choice and achieving travel plan targets Andrew Bindera.binder1@edu.salford.ac.ukProfessor Richard Knowlesr.d.knowles@salford.ac.uk
- 2. Introduction & structure 2 •2nd year of part time PhD •Present progress and initial outputs •Gain input and feedback •Research aims •MediaCityUK background •Travel plan background •2014 travel survey –preliminary analysis •Next steps for the research
- 3. PhD research aims 3 •Identify modal choice and travel behaviour of BBC MediaCityUK employees •Explore factors that influence modal choice •Identify barriers to modal shift and sustainable travel use
- 4. Wider aims 4 •A greater understanding of individual’s travel behaviour and modal choice at MediaCityUK •Uncover trends in travel behaviour •A greater understanding of factors affecting modal choice •The impact of a change of workplace and/or residence on commuter travel patterns and modal choice •Evaluation of the impact and effectiveness of specific infrastructure and non-infrastructure measures to promote modal shift •Highlight where transport policy crosses over with other policy areas and where this integration is successful or not •Comparison with other media cities (e.g. Copenhagen, Seoul)
- 5. Wider aims 5 •Using MediaCityUK as an example of transit-oriented development (TOD) •Contribute towards: •Informing policy (planning, transport, health etc.) •Planning for future sustainable development •Reducing congestion and pollution •Improving transport accessibility •Understanding if planning system is ensuring sustainable development •Understanding where further support and interventions needed from national and local government and within organisations •Provide outputs that can be used to inform practice •Greater understanding of the role of city regions, economic development in urban areas, regional policy
- 6. •15 hectare mixed-use property development •On the site of the former SalfordDocks now called SalfordQuays •MediaCityUK and wider SalfordQuays represent CBD extension •MediaCityUK owned by Peel Holdings •Centered on the creative and digital industries •Key tenants Phase 1 –BBC, ITV & University of Salford •BBC moved departments from London and Manchester city centre 6
- 7. 7 Birmingham London Liverpool Leeds Greater Manchester
- 8. SALFORDMANCHESTERSalford CrescentSalford CentralManchester VictoriaDeansgateManchester Oxford RoadManchester PiccadillyEcclesSalford QuaysCity centreLight railHeavy rail
- 9. 9 Salford Quays MMEDIACITYUKBBC M M M M MThe StudiosITV studiosITV & UniversityNew footbridge
- 10. MediaCityUK development timeline 10 •mid-1980s –Redevelopment of SalfordQuays begins •2004 –BBC announce proposals to relocate parts of its operation to Manchester area •June 2006 –SalfordQuays selected as chosen site •October 2006 –Outline planning permission granted •May 2007 –Full planning permission granted •mid-2007 –Start of construction •late-2010 –First tenants take occupation •September 2010 –Metrolinkstation opened •early 2011 –BBC start broadcasting from MediaCityUK •May 2011 –BBC begin process of moving approximately 2,500 staff to the site from London & Manchester (completed mid-2012) •September 2011 –University of Salfordopens new campus •2012-2014 –ITV moves to new MediaCityUK facility
- 11. Why study MediaCityUK? •Unique development in the UK •New centre for Creative Industries -a growing market (valued at £71.4 billon a year) •Regeneration site •Extension of CBD •Large migrated workforce (BBC –2,500 employees) •Comparable with similar developments e.g. DR Byen(Copenhagen) Digital Media City (Seoul) •MediaCityUK was set modal share targets as a condition of being granted planning permission 11 1 1 https://www.gov.uk/government/news/creative-industries-worth-8million-an-hour-to-uk- economy
- 12. Planning conditions & travel plan 12 •Outline travel plan (2006) •Final travel plan (2011) •Detailed action plan through to 2016 •Target set of a minimum of 45% of trips to the site by non-car modes in the peak periods •Greater Manchester –Journey to work = 31% by non-car modes2 •Manchester city centre–Journey to Work inbound = 70% by non-car modes3 22011 Census3Manchester City Centre Transport Strategy (2010) MediaCityUK Phase 1
- 13. Travel plans A strategy geared towards managing private vehicle demand and facilitating increased use of sustainable modes of travel, such as walking, cycling and public transport. •Workplace TPs emerged in mid-1990s •A New Deal for Transport (1998) –part of national policy •Policy instrument and delivery mechanism (Enoch, 2012) •Package of ‘hard’ and ‘soft’ measures (Roby, 2010) •Research showed typical reduction in commuter car use of between 10-30% (Cairns et al., 2004) •Only statutory as part of planning process 13
- 14. Sustainable transport infrastructure 14 •£20 million Metrolink(tram) extension to MediaCityUK •New MediaCityUK stop (opened Sep 2010) •4 extra trams •SalfordQuayslinkbus service (started July 2011) •Links MediaCityUK with SalfordCrescent railway station •£430k public funding per year •Fleet of 4 hybrid buses •Commercially operated by Stagecoach from Sep 2012 –route extended to central and south Manchester
- 15. Sustainable transport infrastructure 15 •Local Sustainable Transport Fund funding used to develop cycle routes in Salford(£1.2 million in total) •Several new routes link the Quays from nearby areas with poor or no public transport connections •Existing routes improved (River Irwell route linking to Manchester city centre) •Cycle Hub –300 secure storage spaces, shower, changing and locker area •New pedestrian and cycle bridge •In planning –Water Taxi’s connecting to Manchester city centre
- 16. Travel data available 16 •Site-wide baseline travel survey in Nov 2012 by Peel •Baseline data for travel plan •59% non-car modes
- 17. Data collection -travel survey 17 •Study survey conducted in June/July 2014 •Online using Google Forms •All BBC employees invited through weekly newsletter and email contact •Incentivisedthrough prize draw vouchers •Approximately 10% response rate
- 18. 18 •Tram most popular PT •Cycle use well above local & national average •Rail users will have had to connect via another mode (most popular was tram) •55.4% non-car modes (target at least 45%) Primary mode of travel (based on duration)
- 19. 19 Comparing primary mode from previous place of work to MediaCityUK ex-BBC London ex-BBC Manchester •Car use increase •Cycle use increase •PT decrease •Car use increase •Cycle use similar •Tram use similar •Train and bus decrease n=49 n=90
- 20. 20 Age and primary mode
- 21. 21 Gender and primary mode
- 22. 22 Survey evaluation Response rate •Approximately 10% •2012 survey response rate was approximately 25% •Constrained by communication methods •Gender split unequal –60% female/40% male •Previous workplace split unequal •ex-London 20% •ex-Manchester 36% •Other location 44% •Weighting of responses potentially required
- 23. 23 Survey evaluation Establishing primary and secondary mode of travel •Not straightforward •Respondent interpretation of primary and secondary mode •Some people use different modes on different days or time of year •No typical day for a lot of people •Can’t ask too many questions! Self-selection bias •Those with more interest in/awareness of transport issues more likely to complete –e.g. cycle, public transport users
- 24. 24 Survey evaluation Validation using 2012 survey •Similar modal split to 2012 survey June2014 November 2012 Difference Walk 7.2% 3% 4.2% Cycle 14.9% 14% 0.9% Bus 4.8% 4% 0.8% Tram 17.7% 23% -5.3% Train 10.0% 13% -3.0% Car (driver) 38.2% 33% 5.2% Car sharing (as driver) 4.4% 6% -1.6% Car sharing (as passenger) 1.6% 2% -0.4% Taxi 0.4% 1% -0.6% Motorcycle/scooter 0.8% 1% -0.2%
- 25. Next steps 25 •Utilisefull analysis of travel survey to develop next stages of research •Qualitative research •Travel diary •Interviewing •Investigation around key themes that impact on modal choice •Working hours •Distance from residence •Accessibility levels •Family/dependants
- 26. Many thanks for listening, do you have any questions? 26
- 27. 27 References Cairns, S., Sloman., L., Newson., C., Anable, J., Kirkbride, A. & Goodwin, P. (2004) Smarter Choices –Changing the Way We Travel, DfT, London Enoch, M. (2012) Sustainable Transport, Mobility Management and Travel Plans, Ashgate: London Roby, H. (2010), Workplace travel plans: past, present and future, Journal of Transport Geography, 18(1) pp. 23-30 Image sources www.manchestertransport.wordpress.com Google Maps Wikimedia Commons