SlideShare una empresa de Scribd logo
1 de 333
WK 2 DQ 1
Read the journal article “The Ethics of Internet Research”
(Williams, 2012) and this week’s lecture. In your own words,
provide a summary of the article and add your own thoughts on
how the Internet can affect the research process, including, but
not limited to, ethics concerns.
Reference
Williams, S. G. (2012). The Ethics of Internet Research.
Online Journal Of Nursing Informatics, 16(2), 38-48.
Week Two Lecture
Business Research Methods and Tools
Week 2: Research ethics and research design
Hypothesis testing
This week, you’ll learn more about the building blocks of
business research. Last week’s readings and guidance
introduced you to the concept of hypotheses and research
questions. Let’s go into hypothesis testing a bit further.
Let’s reconsider last week’s sample research question: “Why are
some of Ashford University’s students not successful in
school?” Assume that Ashford’s management noticed that not
all students are as successful as they would like them to be:
some students fail courses, others drop out, and so on. This is
considered the problem they would like to solve with the
research. After some background evaluation, the administration
develops a hypothesis about the problem and the question:
“Ashford students don’t succeed when they have old
computers.” The hypothesis states the problem (lack of student
success) and an “educated guess” about why the problem is
happening (students have old computers).
In the research, Ashford’s administrators need to operationalize
the study and test the hypothesis; this means they need to do the
research to find out whether their hypothesis is correct. They
could study it by sending a survey to students in order to find
out how old their computer is. They could give a new computer
to some of the students with an old computer, and they could
not give a new computer to students with an old computer.
Then, the researchers could observe whether there is a
difference between the old-computer students and the new-
computer students.
In this study, the “null hypothesis” would be: “There is no
statistically significant difference between the success of
students with old computers and students with new computers.”
If the study found there is, in fact, no difference in the success
of the two groups, the researchers would fail to reject the null
hypothesis. If there is a difference between the two groups, the
researchers would reject the null hypothesis.
The process of collecting data to observe differences might be
new to you. Remember that if you are not collecting data to
answer a research question, you are not doing original research.
You might have thought previously that if you write a paper in
which you summarize what other researchers have done, then
you are “doing research.” That’s not true in this class. In
business research, you go beyond summarizing others’ work;
you’re making observations from data that are your own.
Research ethics
It’s important to make sure that whatever research you do that
involves people, or data from or about them, is conducted
ethically. If research is ethical, it means (among other things)
that the researchers are protecting the privacy of the
participants and any research data collected about them.
In business settings, companies conduct research all the time to
learn how to serve customers better, how to increase profits,
and so on. If you surveyed your customers about their
experience in your store using an online survey, it wouldn’t be
ethical to force them to provide their names and addresses. They
might choose to provide their names and contact information if
they wanted you to follow up with them about a negative
experience in the store, but to protect their privacy, you should
not demand that information.
In university settings, ethics boards (also called Institutional
Review Boards or IRBs) review the plans for all the studies that
involve human participants, such as people who complete
surveys or participate in interviews. The IRB’s main objective
is to ensure the safety, privacy, and confidentiality of
participants. You can read about Ashford’s IRB at
http://www.ashford.edu/about/institutional-review-board.htm.
For viewing:
Ty, R. (2009, June 16). Types of research & research designs
[Video file]. Retrieved from
https://www.youtube.com/watch?v=49_u-pXwx7g
Marianne102. (2009, December 8). Unethical research methods
[Video file]. Retrieved from
https://www.youtube.com/watch?v=fmEDdVEwkHc
WK 2 DQ 2
Google’s business model includes state-of-the art research. Pick
a research study that Google’s researchers have done from their
list of Research Areas & Publications (2014). What do you
think about this research? Find details about related research to
support your argument. Cite the studies in your post, and
document it in APA style as outlined in the Ashford Writing
Center.
Google. (2014). Research areas & publications. Retrieved from
http://research.google.com/pubs/papers.html
Text
· Landrum, R. E. (2014). Research methods for business: Tools
and applications. San Diego, CA: Bridgepoint Education, Inc.
01CH_Landrum_Bus
iness.pdf
1
1The Business of
Business Research
© Adrian Weinbrecht/cultura/Corbis
Learning Objectives
After reading this chapter, you should be able to:
• Describe the importance of decision-making skills and how
studying business research methods
allows students to hone those skills.
• Place business research in the context of scientific research.
• Explain the differences between quantitative and qualitative
research approaches.
• Communicate the criteria used to evaluate scientific/business
theories.
• Explain the benefits of systematically following a business
research approach, including the proper
presentation of data, avoiding plagiarism, and being an educated
consumer of research.
co-photo
co-intro
co-cn
co-box
co-cr
co-ct
CO_CRD
CT
CN
CO_H1
CO_TX
CO_NL
Lan81479_01_c01_001-032.indd 1 5/22/14 11:34 AM
Introduction
Pre-Test
1. The application of scientific principles to gather data for
making business decisions is
called:
a. case studies.
b. business data analysis.
c. costs versus benefits.
d. business research.
2. Common sense is one form of which of the following classic
“ways of knowing”?
a. tenacity
b. intuition
c. authority
d. mysticism
3. When answering research questions, quantitative research
offers more insight than
qualitative research does.
a. true
b. false
4. Theories that can be tested empirically are said to have
__________, while theories that do
not contradict themselves have __________.
a. intersubjective testability; internal consistency
b. subsumptive power; heuristic value
c. internal consistency; modifiability
d. heuristic value; communicability
5. Unintentional plagiarism caused by not understanding the
rules for citation is more
acceptable than intentional plagiarism.
a. true
b. false
Answers
1. d. business research. The correct answer can be found in
Section 1.1.
2. b. intuition. The correct answer can be found in Section 1.2.
3. b. false. The correct answer can be found in Section 1.3.
4. a. intersubjective testability; internal consistency. The
correct answer can be found
in Section 1.4.
5. b. false. The correct answer can be found in Section 1.5.
Introduction
If you have ever used Google Maps (or other map/navigation
apps), you know that there are
multiple types of views, such as street views, satellite views,
and so on. A user can zoom
out for the big picture or zoom in to see finer details. This
chapter is akin to this navigation
process, but with business research methods rather than map
locations. Understanding big
picture ideas like skills, critical thinking, science, and theories
is an important motivator and
foundational piece for the details that will come later, and some
of those details are previewed
photo-caption
photo-box-right-thin
photo
box-1
BX1_H1
BX_TX
PT
PT_NLF
PT_NL
PT_ANS
PT_ANS_NLF
PT_ANS_NL
PT_ANS_NLL
sec_t
kt
i
bi
Lan81479_01_c01_001-032.indd 2 5/22/14 11:34 AM
Section 1.1Skills for a 21st-Century Worker
in this chapter as tools (presenting data visually, avoiding
plagiarism, and being a smart con-
sumer of research). This chapter presents conceptual scaffolding
by which more detailed and
finer-grained business research methodologies will be
examined. With an understanding of
the intended destination, setting the foundation in this chapter
will help when the future
details become more complex.
1.1 Skills for a 21st-Century Worker
Our lives are consumed by decision making. You can think
about this from a daily perspec-
tive, career perspective, lifetime perspective, and so on. Think
about the number of decisions
you have made today, including what time to wake up, what
clothes to wear, what to eat for
breakfast, and so on. These are routine decisions that you make,
probably without much
thought. You made a decision to continue your education to
better your life and enhance your
career; this probably commanded more consideration than your
typical breakfast choice.
Some decisions require more thought—more research, more
data—because the stakes are
higher. The availability of data in today’s world makes decision
making all the more compli-
cated. In an attempt to understand just how much information
Americans consume, using
multiple approaches and data sources, experts have estimated
that the average person con-
sumes information almost 12 hours a day (Bohn & Short, 2009).
This is about 100,500 words
per day on average, or 34 gigabytes of information per day on
average. In the business world,
decisions must be made about whether the data needed already
exists, or if additional efforts
should be expended to gather new data.
Decision making is at the heart of business research. Business
research involves the appli-
cation of scientific principles to gather relevant data to aid in
decision making. Businesses
obtain and analyze data in order to manage the company; that
data might involve financials,
consumer feedback, market analysis, or product research
(Miranda, 2013). Business research
is the story of scientific research, with specific applications and
tools for the workplace and
all the aspects of the business world. At first blush it may seem
that conducting research is
always preferred, but there are indicators that should be
considered when making this deci-
sion (Zikmund, 1994). These key indicators include:
1. Time—is there enough time to allow for the appropriate
application of business
research methods, or is the decision needed so quickly as to
prevent having the time
for adequate research?
2. Data availability—if the data are readily available in a
useable form, then business
research is facilitated; if not readily available, then the cost of
gathering that data
(financial cost, time constraints, person-power) must be
considered.
3. Importance—decisions that impact the organization greatly or
have high risk may
warrant more research attention in comparison to daily business
decisions; con-
ducting research on every decision would be tedious and
unwieldy.
4. Costs versus benefits—for any type of business activity, there
are costs (of time, of
resources, of expertise, and so on); will the knowledge gained
from research be worth
the investment, will the decision quality improve, and is the
investment of resources
into business research the best investment of those collective
efforts?
Lan81479_01_c01_001-032.indd 3 5/22/14 11:34 AM
Section 1.1Skills for a 21st-Century Worker
For a quick comparison of the advantages and disadvantages of
scientific versus nonscientific
approaches to business research, see Table 1.1.
Table 1.1: Advantages and disadvantages to scientific versus
nonscientific
business research
Business Research
Approach Advantages Disadvantages
Scientific Methods are logical, and measured
outcomes can be replicated by others;
greater confidence in the outcomes due
to objectivity.
The entire story may not be captured
due to the imprecise nature of mea-
suring behavior; likely to be able to
describe behaviors, but not to under-
stand the cause of the behaviors.
Nonscientific Case studies and anecdotes are vivid
and descriptive, allowing researchers to
seek better understanding of motiva-
tors and causes; can help answer “why”
questions.
The results are often open to ques-
tion with case studies and anecdotes
because of their subjectivity. If someone
else were to review the same materials,
reliable outcomes may be challenging
to find.
Source: Data from Johnston, K. (2013). Scientific vs.
unscientific methods in business research. Demand Media, Inc.
Retrieved from
http://www.ehow.com/info_8512344_scientific-unscientific-
methods-business-research.html
Just as business research can be seen as a specialized approach
of scientific research, the skills
gained by learning about and applying business research are
complementary to the skills neces-
sary for workplace success in the 21st century. There are a
myriad of organizations, think tanks,
and government agencies that have offered suggestions about
the key skills and abilities neces-
sary, and there is some overlap in the skills provided. Two
exemplar lists are provided below;
one list is from the Partnership for 21st Century Skills (2009)
and the other from a recent Gallup
(2013) poll conducted on behalf of Microsoft® and the Pearson
Foundation.
Partnership for 21st Century Skills (2009)
• Core Subjects and 21st Century Themes
• Core Subjects: English/reading/language arts, world
languages, arts,
mathematics, economics, science, geography, history,
government/civics
• Themes: global awareness, financial/business/entrepreneurial
literacy, civic
literacy, health literacy, environmental literacy
• Learning and Innovation Skills
• Creativity and innovation, Critical thinking and Problem
solving, Communication
and collaboration
• Information, Media, and Technology Skills
• Information literacy, Media literacy,
Information/Communications/Technology
literacy
• Life and Career Skills
• Flexibility and adaptability, Initiative and self-direction,
Social and cross-cultural
skills, Productivity and accountability, Leadership and
responsibility
Source: Excerpted from Partnership for 21st Century Skills.
(2009). P21 Framework Definitions. Retrieved from
http://www.p21
.org/storage/documents/P21_Framework _Definitions.pdf
Lan81479_01_c01_001-032.indd 4 5/22/14 11:34 AM
http://www.ehow.com/info_8512344_scientific-unscientific-
methods-business-research.html
http://www.p21.org/storage/documents/P21_Framework_Definit
ions.pdf
http://www.p21.org/storage/documents/P21_Framework_Definit
ions.pdf
Section 1.2Business Research Is Scientific Research
Gallup Poll (2013)
• 21st Century Skills in Education
• Technology
• Collaboration
• Knowledge construction
• Skilled communication
• Real-world application
• Self-regulation
• Problem-solving
Source: Gallup, Inc. (2013). 21st Century Skills and the
Workplace. Retrieved from
http://www.gallup.com/strategicconsulting
/162821/21st-century-skills-workplace.aspx
Consider how you can practice these skills throughout this
course, other courses, and in
everyday life. Acquiring these types of skills can give you an
added advantage, especially in
a tight economy or when the competition increases for highly
desirable jobs. Understanding
and possessing the skills and abilities of a business researcher
can help prepare for career
transitions, including unexpected twists and turns. Thus, to
launch into an exploration of
business research, the story begins with an understanding of
science, the scientific method,
and a critical thinking approach.
1.2 Business Research Is Scientific Research
The methodologies used by business researchers emerge from
the basic and applied approaches
of scientific researchers. Thus, the foundations of business
research are the foundations of sci-
ence. The benefits of a more scientific approach to business
research are reaped when research-
ers have a clearly defined goal, utilize neutral wording when
using survey methodology, imple-
ment research controls, use proper sampling, and strive for
statistical significance (Knickelbine,
2013)—you’ll learn more about each of these topics throughout
this text. The scientific story
can be a long and complex one, but in this context the key ideas
include how we know what we
know, the basic assumptions and cautions of science, and the
characteristics of critical thinking.
How Do We Know What We Know?
Scientist and logician Charles Peirce (1877) provided a
framework for how we decide what
we know and believe. That is, how do individuals come to know
what they know? Are some
methods of learning about the world better than others? Is the
type of evidence used to estab-
lish beliefs important? Peirce called this the “methods of fixing
beliefs” and offered examples
such as tenacity, authority, a priori logic, and science
(Helmstadter, 1970). Reviewed here are
the classic “ways of knowing.”
Authority
Gaining a greater understanding via authority can be an
efficient method for learning.
Authority figures are often experts or highly regarded sources.
For example, recall your first
introduction to business course. You probably had a thick
textbook containing hundreds of
Lan81479_01_c01_001-032.indd 5 5/22/14 11:34 AM
http://www.gallup.com/strategicconsulting/162821/21st-
century-skills-workplace.aspx
http://www.gallup.com/strategicconsulting/162821/21st-
century-skills-workplace.aspx
Section 1.2Business Research Is Scientific Research
pages, with hundreds of references cited. It would not be
efficient for you to read all of those
original sources, so your textbook author read those materials
and extracted the relevant
information. He or she provided a valuable service for you.
The problem is that sometimes authority figures get it wrong
and transmit incorrect informa-
tion to us (Beins, 2005). And sometimes, because authority
figures are often experts, they do
not all agree and may change their minds. Occasionally,
authority figures may use their status
to mislead us, because throughout history, authority figures
have not always had the greater
good as their primary interest—this could be political figures,
religious leaders, social activ-
ists, and yes, even authors.
Logic
Logic can be a valuable tool in helping to understand behavior
as well. Logic in this con-
text means the ability to understand behavior through reasoning
(i.e., philosophical logic).
Scientists often make logical deductions about the world. For
instance, consider the classic
syllogism (Shirky, 2003):
Humans are mortal.
Greeks are human.
Therefore, Greeks are mortal.
In this syllogism, the first two premises are true, and as it
happens, so is the conclusion. But
sometimes our logic is flawed because humans do not always
behave in logical ways (and syllo-
gisms are often more complex than the example above). For
example, a person could reason that:
Truly exciting books are rare.
Rare books are expensive.
Therefore, truly exciting books are expensive.
The premises are not necessarily completely true, although the
“logic” of the syllogism does
follow in the conclusion. Logic can be a helpful method of
understanding the world around
us, but there are flaws in this approach as well. Take, for
example, the notion of inattentional
blindness—the idea that a person might not “see” an event
happening right in front of them
(Simons & Chabris, 1999). In a series of classic “gorillas in our
midst” studies, researchers
determined that when participants were asked to count the
number of passes made by a team
in white jerseys, over half of the time they failed to see a gorilla
move through the scene being
viewed (for a YouTube example, see
http://www.youtube.com/watch?v=vJG698U2Mvo).
Sometimes our human limitations impact our ability to be
completely logical.
Lan81479_01_c01_001-032.indd 6 5/22/14 11:34 AM
http://www.youtube.com/watch?v=vJG698U2Mvo
Section 1.2Business Research Is Scientific Research
Intuition
Sometimes individuals “know” something through intuition, a
gut feeling or hunch. This feel-
ing does not come about through evidence; instead, one simply
believes something to be true.
Sometimes our gut is correct and sometimes not. Consider
Figure 1.1. Imagine the movement
of the ball out of the curved tube (Bloom & Weisberg, 2007)—
will it follow the straight path
of Option 1 or the curved path of Option 2? Many college
students believe that the ball will
follow the curved path (2), when that is not the case.
Two types of intuition commonly described are common sense
and mysticism (Salinas, n.d.).
Common sense typically refers to the everyday decisions that
we make when relying on our
current store of knowledge, without adding more informational
data. Part of the problem with
common sense is that it changes over time, so that practices
from 150 years ago (e.g., slavery)
might have been common sense then but are no longer so today.
Also, common sense is usually
applied after the fact. That is, after the event has occurred, a
person has an “I-knew-it-all-along”
reaction. It is easy to be right after the fact. Another concern
about common sense is that not
everyone’s common sense can be right (Beins, 2005). For
example, think about relationships
and the saying “absence makes the heart grow fonder.” If you
have been in a long-distance
relationship, you may feel that there is some truth to that. But
also think about the phrase “out
of sight, out of mind.” This would not yield a positive
prediction about your long-distance rela-
tionship. Considering these two common sense ideas together
(Salinas, n.d.), it seems improb-
able that they could both be true at the same time. Thus,
although common sense may be com-
mon, it may not always make sense.
Mysticism is a type of intuitive experience that occurs because
a person experiences an
altered state of consciousness, perhaps through meditation or
chemical assistance (Salinas,
n.d.). These can be profound experiences, but they are unique in
that they cannot be repli-
cated in a laboratory setting and are not typically predictable.
This type of insight into human
Figure 1.1: Which route? Rolling a ball through a curved tube
Source: Adapted from Figure 1 (A and B) Alternative intuitions
about the movement of a ball out of a curved tube. Adapted
from
Bloom, P., & Weisberg, D. S. (2007, May 18). Childhood
origins of adult resistance to science. Science, 316, 996–997.
doi:10.1126
/science.1133398
Lan81479_01_c01_001-032.indd 7 5/22/14 11:34 AM
Section 1.2Business Research Is Scientific Research
behavior may not be reliable because of the uniqueness and
individuality of the experience.
For example, Aunt Bertha may claim that she saw an alien
spacecraft land in her backyard. You
check her backyard and see no evidence of a landing. You speak
to the neighbors and no one
else saw or heard anything. Aunt Bertha’s unique experience is
difficult to confirm; she does
not think she is lying, but you might not know what to believe.
Tenacity
Sometimes individuals hold to certain beliefs about the world
because they have tenacity, or
persistence. People believe in ideas based on superstition or
habit, and continue to believe
because it has always been that way (e.g., the Earth is flat). For
example, have you ever had
a lucky pen or lucky shirt for test taking? Was your successful
performance on that test due
to your lucky pen, or you? Superstitions and habits are not
always healthy or efficient, but
understanding the tenacity of beliefs is important to consider as
we study human behavior,
especially when we are interested in behavior change, as
business researchers often are.
Science
The hallmarks of science are observation and objectivity.
Scientists have precise rules and
procedures for gathering scientific data. Business researchers
typically use a measurement
approach, and those measurements may be qualitative (with
words) or quantitative (with
numbers). This scientific approach was summarized nicely in
two statements made some
time ago (McCall, 1939, p. 15):
Whatever exists at all, exists in some amount.
Anything that exists in some amount can be measured.
Scientists strive to understand behavior without regard to
personal beliefs, biases, attitudes,
and emotions (Helmstadter, 1970). However, business
researchers are human, so methods
are built into our research to minimize the effect of our
humanity on the outcomes of research
studies. A limitation of science is that it is not a very good
approach for understanding the
rare, unique, once-in-a-lifetime phenomenon. We’ll discuss
more on the cautions and limita-
tions of science later in this chapter.
Clearly, science is not the only approach by which to
understand the world—we have discussed
some of the other approaches (tenacity, logic, and so on). But a
scientific approach allows for
conclusions to be drawn with a certain amount of confidence.
The values of science can be
summarized as follows:
• Science places high value on theories that have the largest
explanatory power. If a
theory can explain the outcomes of a great many hypotheses, it
is highly useful.
• Science values predictive power. The more we can predict
future behavior based on
scientific data, the more useful that data will be.
• Science values fecundity—that is, fruitfulness (the generation
of new ideas). If a
theory can help us generate new ideas about the world, then it
has value. Sometimes
this characteristic is known as the heuristic value of a theory.
Lan81479_01_c01_001-032.indd 8 5/22/14 11:34 AM
Section 1.2Business Research Is Scientific Research
• Science values open-mindedness. Critical thinking and open-
mindedness are essen-
tial tools for success in science.
• Science values parsimony. When all else is held constant,
scientists prefer simpler
theories to more complex theories.
• Scientists require logical thinking in their explanations. By
making processes and
results public, science and scientists must withstand public
scrutiny and make
cogent arguments for their conclusions.
• Scientists value skepticism. Although anecdotal evidence may
be memorable (and
often entertaining), scientists want evidence that supports or
refutes a claim (Smith
& Scharmann, 1999).
• Science is self-correcting.
Through the sharing of methodology of business research
studies, erroneous findings and
mistakes can be identified and flaws in the literature can be
corrected. That is, when busi-
ness researchers publish studies in professional journals, the
details of the study are “given
away”—others are told about the participants, materials, and
procedures used during the
study. Thus, if another researcher finds the outcomes of a study
to be unbelievable, that skep-
tical researcher has the blueprint to replicate the study.
Understanding the structure of how and why we do research will
help you to become a bet-
ter, more informed business researcher. So what is the scientific
method? The word science
comes from the Latin word scientia, meaning knowledge. But
the word science has (at least)
two different implications. First, science is a method of
studying the world around us. Remem-
ber learning the five-step scientific method in your grade school
science class? This scientific
method is the same one that is used today.
The second implication for the word science involves the
production of knowledge. This may
seem redundant, but science produces scientific knowledge.
Intuitively, you already know
this. You may have seen a TV advertisement, news broadcast,
magazine article, or an Internet
blog that mentions a nonscientific survey. That disclaimer is
added because scientific sur-
vey results differ in method and outcome from nonscientific
surveys. Why is that distinction
important? Because knowledge gained through a scientific
approach has different charac-
teristics from knowledge gathered in other ways. For example,
consensus is the basis for sci-
entific knowledge. Business researchers make the results known
publicly through scholarly
articles, books, websites, conference presentations, white
papers, technical reports, and so
on. In addition, scientific conclusions are tentative and based on
the best scientific data avail-
able. Science will not always be the best method for gaining
information. For now, it is impor-
tant to note that science is both a method and a product.
Assumptions and Cautions of Science
Even though our approach throughout this text will be business
research through a scientific
lens, there are other methods by which to understand the world
that were previously men-
tioned. In fairness, although science is our preferred lens here,
the scientific approach is not a
perfect approach, and it makes sense to pause for a moment and
think about the assumptions
and cautions of science.
Lan81479_01_c01_001-032.indd 9 5/22/14 11:34 AM
Section 1.2Business Research Is Scientific Research
Assumptions
Two common assumptions of science are determinism and finite
causation (Maxwell &
Delaney, 2004; Underwood, 1957). To this traditional listing,
add a third assumption of
science—empirical evidence. The notion of determinism is
fundamental for scientists to
make sense of the world. Determinism posits that events that
occur are lawful, or predict-
able. Said another way, if all the causes were known for an
event, that event would be com-
pletely predictable. This view is summarized in three parts: (a)
nature is understandable,
(b) nature is uniform, and (c) events in nature have specific
causes (Maxwell & Delaney,
2004). If you apply this to human behavior, it makes sense.
When a person visits the doctor
for an ailment and receives a prescription, he or she expects to
resolve the ailment by tak-
ing the prescription. That person already believes in cause and
effect by believing that if the
medication is taken, he or she will get better. Students may
believe that this graduate-level
course will help them become better business researchers.
Although free will plays a role
in our lives (Baumeister, 2008), scientists depend on this idea
of determinism to help make
sense of the world. If there were not causes and effects, then
events and behaviors would
be completely random. Thus, if attitudes about a particular hair
care product are randomly
formed, then why bother with advertising?
This underlying belief in determinism is related to the second
assumption of science—finite
causation. Not only do scientists believe in cause and effect, but
they also believe there are a
finite (limited) number of causes for any effect or event, and
that they are discoverable and
understandable (Maxwell & Delaney, 2004; Underwood, 1957).
Of course, a scientist’s challenge
is to identify which causes lead to the effects and under what
conditions those cause-and-effect
relationships occur (Maxwell & Delaney, 2004). For business
researchers, this is essentially the
notion that research can make inroads to studying workplace
outcomes, even if not every aspect
of a particular behavior is perfectly understood. That is,
business researchers do not have to
completely understand leadership in large organizations in order
to identify some best practices
in developing leaders.
The third underlying assumption of science is related to the type
of knowledge it produces—
empirical evidence. The evidence produced by scientific,
research-based approaches is
labeled “empirical” evidence, and at its best produces
knowledge that is reliable and public.
Reliability (that is, consistency in measurement) occurs in the
form of self-correction because
consensus is the foundation for scientific knowledge. In
science, nothing is self-evident at first,
and scientific claims must be supported. Knowledge is acquired
through empirical (research-
based) experience, and the claims of science are tentative, based
on the best information cur-
rently available. Thus, when business researchers publish in
journals, these scientists provide
empirical evidence upon which others can continue to build our
understanding of how the
world of business works.
Cautions
Although science is the primary lens used throughout this text,
there are cautions and limi-
tations to it, and a scientific approach is not a “magic bullet”
that solves all problems and
provides all-knowing insight. First, scientists deal in
probabilities. Business researchers are
empirical, and they gather and analyze data and draw
conclusions from the data. These con-
clusions should be thought of as tentative. Scientists
acknowledge that their findings have a
high probability of being correct, but with no guarantee. They
do not prove anything; they
only disprove incorrect hypotheses. We will discuss that topic
further in a later chapter.
Lan81479_01_c01_001-032.indd 10 5/22/14 11:34 AM
Section 1.2Business Research Is Scientific Research
Second, individuals are limited to what they understand about
the world based on the phys-
ical equipment possessed. They rely on eyes to see, ears to hear,
and so on. Thus, humans
are only as accurate and precise as these sensory systems and
the tools used to amplify
sensory perceptions.
Third, science is limited to the investigation of public
knowledge—the observable and quan-
tifiable. Thus, science cannot answer questions about value
(Fancher, 2004)—for example,
which is more valuable: liberty or the pursuit of happiness?
These are opinion questions that
individuals must answer—science is not able to provide the
“right” answer, although scien-
tists can conduct polls and determine prevailing beliefs. Related
to questions of value, science
is ill-equipped to answer questions of morality. Questions like
“is capital punishment wrong?”
or “does life begin at conception or birth?” are important
questions, but they are not good
questions for science if you want the “right” answer. Science
does not tell us what is right or
wrong; we decide for ourselves what is right or wrong (Fancher,
2004).
Finally, science is also limited to the study of the natural and
physical world. It cannot answer
questions about the supernatural (e.g., the occult, clairvoyance,
witchcraft). The scientific
approach does have both strengths and limitations.
Critical Thinking and Its Characteristics
The basis of all scientific approaches, including those of
business research, is critical think-
ing. Critical thinking is defined as a set of strategies designed
to make us better consumers
of information (Wade, 1990). Although every student may not
become a business researcher,
students are and will continue to be consumers of information.
You consume information
from your classes and school experiences, but you also consume
information at the super-
market, on the Internet, in front of the television, watching a
YouTube video, and at the car
dealership. Critical thinking strategies outline an approach to
consuming information that
ideally helps a person to be less gullible. Critical thinking
applies to all aspects of decision
making, and decision making is central to the notion of business
research. Note that critical in
this sense does not mean to criticize, but it means to carefully
and meticulously examine the
points and perspectives of information presented.
The following are characteristics of critical thinking:
1. Be skeptical, ask questions, and be willing to wonder.
Critical thinkers are not fooled
into believing everything they are told; they respectfully
question the sources of
information, and ask questions when they are confronted with
details that do not
make sense. Given your interest in business, asking “what if ”
questions should come
naturally. A person’s natural curiosity about behavior,
combined with practiced and
applied research skills, can provide the framework and tools to
begin to scientifically
answer questions of interest.
2. Define the problem and examine the definition of terms.
Defining the problem (includ-
ing the generation of a research question or hypothesis) is one
of the first key steps
of the scientific method. If business researchers want to
understand or predict a
behavior, they must be able to describe and define what that
behavior is. So if a
company wants to promote brand loyalty, what does that mean
exactly? Does that
mean that the consumer automatically buys the same product, or
recommends the
product to others, or criticizes competing products through
social media channels?
Lan81479_01_c01_001-032.indd 11 5/22/14 11:34 AM
Section 1.2Business Research Is Scientific Research
What, exactly, does “brand loyalty” mean? Scientists rely on
operational definitions
to understand precisely what is being measured. An operational
definition is a clear,
precise definition of the concept being studied—for example,
how would you define
“brand loyalty” in a way that is observable and quantifiable? Of
course, business
researchers will disagree on how to measure
constructs/concepts, which makes
the necessity of more research, reviewing the published
literature, and multiple
approaches all the more valuable.
3. Examine the evidence. A critical thinker looks for and
examines the evidence on an
issue. In science, one tends to rely on empirical evidence, but
other types of evi-
dence can be useful at times. For example, anecdotal evidence
(evidence based on
a personal story or experience) can be useful in thinking about
problems to solve
or generating plausible hypotheses, but it is generally not
considered as scientific
or empirical support for a hypothesis. Scientists prefer to
examine data, and with
anecdotal evidence, there are not data to observe; anecdotes are
from stories told by
a person. In examining the evidence of others, look for the
standards of science to be
met. What are those standards? For instance, researchers want
evidence to be both
reliable (consistent) and valid (meaningful).
4. Be cautious in drawing conclusions from evidence. Two
scientists looking at the same
evidence might draw different conclusions. Often, evidence is
preliminary in nature
and decisions should be delayed until more evidence is
available. Furthermore, some
types of evidence only support some types of conclusions. For
example, evidence
from correlational studies suggests a mathematical relationship
between variables,
and not a cause-and-effect relationship. There is usually a
positive correlation
between height and weight, but it is incorrect to conclude that
height causes weight
or that weight causes height. Evidence is preferable, but one
needs to be cautious in
the types of conclusions based on the types of evidence.
5. Consider alternative explanations for research evidence. One
of our primary tasks is
to consider alternative explanations in the interpretation of
research findings. In
fact, most researchers consider alternative explanations before
conducting studies.
For example, a researcher might be interested in the relationship
between the use
of social media and buyers’ favorability toward a new product.
What if it was found
that the more time spent on Facebook, the less favorable the
buyer was toward a
new product? The task of the researcher is to consider
alternative explanations that
might account for the pattern of results.
6. Examine biases and assumptions. Critical thinkers must
examine their own biases
and assumptions as well as those of others. Information comes
to us from a source,
and this source usually has a certain slant or angle (think about
managers, employ-
ees, and competitors as possible examples). That is, the
messages we receive are
sent for a purpose, oftentimes to influence our thinking or
behavior, or to change
our attitudes. It is also important to remember that people are
not always impartial,
even when they think they are.
7. Avoid emotional reasoning as a substitute for logical
reasoning. Emotions can some-
times cloud our decision-making skills, and the available
evidence is not often
utilized fully when emotions are peaking. Sometimes one gets
caught in the trap of
believing that “since I feel this way, it must be true.” A person
may focus too much
on one element of the situation, without gaining the perspective
to understand the
multiple sides of an issue. Feelings and emotions are important,
but they should not
be substituted for careful examination of the evidence.
Lan81479_01_c01_001-032.indd 12 5/22/14 11:34 AM
Section 1.3Quantitative Versus Qualitative Approaches to
Research
8. Try not to oversimplify or overgeneralize. We live in a
complicated world, and it is
rare that one can condense an important issue down to one
accurate generalization.
Oversimplifications and overgeneralizations are mental
shortcuts that help orga-
nize and understand the world, and help take a break from
critical thinking. Some
of our prejudices and stereotypes are based on unfair
overgeneralizations. Living in
a complicated society dictates that complicated solutions must
be generated; sim-
plistic either/or thinking usually does not work well. Although
there are times when
individuals simplify and generalize for themselves and others,
trying to force the
complexity of the world into neat cubbyholes leaves individuals
with an oversimpli-
fied view that is often not that accurate.
9. Tolerate uncertainty. Science is based on tentative answers
based on the best evi-
dence available at the time. Key in on the phrase at the time.
Given the reliance
on evidence, the critical thinker may change positions on a topic
due to personal
experience or new evidence. In the scientific community, new
evidence emerges
frequently. When evidence and beliefs change, uncertainty is
present. It is easy to
become cynical and not believe in anything because evidence
changes over time. The
critical thinker must examine the evidence looking for
alternative explanations, and
if a different conclusion is warranted, a change of opinion is
necessary. Our ability
to tolerate uncertainty suggests being open-minded to change
yet still applying the
rigorous standards of critical thinking.
The desire to take a scientific approach, and to be a critical
thinker, involves the collection and
analysis of data. Much of the remainder of this text is devoted
to these key topics, but for now,
think about an important consideration—will your data be
quantitative, qualitative, or both?
1.3 Quantitative Versus Qualitative Approaches to Research
Quantitative research involves measurement with regard to a
numerical data collection
approach, and focuses on behaviors that can be quantified or
counted. Qualitative research
involves observations with regard to a verbal data collection
approach, and focuses on people
in natural settings and describing them using words (Cozby &
Bates, 2012).
For example, you might design a survey for your marketing
colleagues to ask about the effec-
tiveness of a recent campaign to look at innovative techniques
of recruiting nurses for local
hospitals. To ascertain effectiveness, a series of survey items
are developed where nurses reply
using an agreement scale from 1 = strongly disagree to 5 =
strongly agree. At the end of the
survey, however, two open-ended questions are also asked: (a)
how do you think the infor-
mation presented during the marketing campaign influenced you
to take your new job at the
hospital, and (b) what suggestions do you have for the next
nurse recruitment campaign? The
approach described here utilizes a quantitative approach using
survey items and also a qualita-
tive approach by looking at responses in the nurses’ own words.
Both types of data collection
can be insightful when answering research questions. See Figure
1.2 for one perspective on how
quantitative and qualitative data can contribute to overall
research conclusions.
Lan81479_01_c01_001-032.indd 13 5/22/14 11:34 AM
Analyzing Research Data:
Research findings are the summarized results of data analysis.
Quantitative
• Data are mostly numerical
• Analysis is statistical
• Purpose is to describe and test
Descriptive Statistics
• Central tendency
◦ Mean
◦ Median
◦ Mode
• Variability
◦ Range
◦ Variance
◦ Standard deviation
• Correlation
Inferential Statistics
• Standard error
• Confidence intervals
• Tests of significance
◦ of correlation
◦ of difference
between means
Qualitative
• Data are mostly verbal
• Analysis is logico-inductive
• Purpose is to discover patterns
Quantitative Analysis
(Statistical process: mathematical)
Qualitative Analysis
(Logico-inductive process: verbal)
• Identify topics
• Cluster topics into categories
• Form categories into patterns
• Make explanations from patterns
• Use explanations to answer
research questions
Section 1.3Quantitative Versus Qualitative Approaches to
Research
Quantitative Research
It is probably true that more researchers tend to be trained in
quantitative approaches than
qualitative approaches, as surmised by LeCompte, Preissle, and
Tesch (1993). There are a
variety of software programs available that can be used to
analyze quantitative data; per-
haps the most popular is IBM SPSS Statistics (originally known
as the Statistical Package for
the Social Sciences, or SPSS) (http://www-
01.ibm.com/software/analytics/spss/). Other
options for analyzing numerical data include:
• Microsoft Excel™ (office.microsoft.com/en-us/excel/)
• R (www.r-project.org)
• SAS® (www.sas.com)
• Minitab (www.minitab.com)
There are many more options for quantitative statistical
analysis, and this is just a small sam-
ple of the software available. Note that as with any complex
software, the overarching impor-
tance is user training; that is, if the user does not know how to
use the software, then it would
be easy to draw erroneous conclusions.
Figure 1.2: Qualitative versus quantitative approaches to
analyzing research data
Source: Mertler, C. A., & Charles, C. M. (2011). Introduction to
educational research (7th ed.). Boston, MA: Pearson. Reprinted
by
permission of Pearson Education, Inc., Upper Saddle River, NJ.
Analyzing Research Data:
Research findings are the summarized results of data analysis.
Quantitative
• Data are mostly numerical
• Analysis is statistical
• Purpose is to describe and test
Descriptive Statistics
• Central tendency
◦ Mean
◦ Median
◦ Mode
• Variability
◦ Range
◦ Variance
◦ Standard deviation
• Correlation
Inferential Statistics
• Standard error
• Confidence intervals
• Tests of significance
◦ of correlation
◦ of difference
between means
Qualitative
• Data are mostly verbal
• Analysis is logico-inductive
• Purpose is to discover patterns
Quantitative Analysis
(Statistical process: mathematical)
Qualitative Analysis
(Logico-inductive process: verbal)
• Identify topics
• Cluster topics into categories
• Form categories into patterns
• Make explanations from patterns
• Use explanations to answer
research questions
Lan81479_01_c01_001-032.indd 14 5/22/14 11:34 AM
http://www-01.ibm.com/software/analytics/spss/
office.microsoft.com/en-us/excel/
http://www.r-project.org
www.sas.com
www.minitab.com
Section 1.4How to Evaluate a Theory
Qualitative Research
Qualitative approaches are word based. They can be
challenging, as words are typically more
ambiguous than numbers and have multiple meanings, and to
understand the precise nature of
what is meant by words, the words before and after must also be
considered (Miles & Huber-
man, 1984). Just as there are a variety of computer software
programs available for quantitative
data analysis, the same is true for qualitative data analysis; a
sampling is presented here:
• NVivo (http://www.qsrinternational.com/products_nvivo.aspx)
• QDA Miner (http://provalisresearch.com/products/qualitative-
data-analysis
-software/)
• MAXQDA (http://www.maxqda.com/)
• ATLAS.ti (http://www.atlasti.com/qualitative-data-analysis-
softw.html).
The challenge for the qualitative researcher is to make sense of
verbal responses. Just as with
quantitative methods, one of the overarching goals of
qualitative data analysis is data reduc-
tion; that is, the simplification of a large volume of data so that
meaningful conclusions can be
formulated. Even though this topic is frequently couched in the
terminology of “quantitative
versus qualitative” research, there is no need for the
competitive “versus.” Both techniques
are commonly used together, and they frequently complement
one another; both approaches
have strengths and limitations. Regardless of the approach, if
you have adequately collected
data with either method, research findings are yielded. But with
these research findings
in hand, what comes next? Business researchers use the data
collected to make decisions,
whether that be to support a theoretical idea or to determine
how to proceed with a business
plan to expand the company. Through the scientific lens of
business research, what are the
criteria that are important in evaluating whether a theory is
good or not?
1.4 How to Evaluate a Theory
Theories are an attempt to explain facts that are tested as
research hypotheses, and theories
are often evaluated by collecting data. However, there are some
fundamental principles to be
aware of regarding the general consideration of any theory.
In business, theories are commonplace. They serve a number of
useful functions in think-
ing about meaningful patterns of behavior. First, tens of
thousands of journal articles, which
contribute to our knowledge of human behavior, are published
each year, and theories help to
organize these findings into more coherent groups of ideas.
Second, theories often stimulate
others to do research. A business researcher may set out to find
evidence to support or refute
a theory, but the theory may provide some motivation in this
process. There are seven criteria
to be used in evaluating theories, providing some basis for
distinguishing between good theo-
ries and not-so-good theories (Morris, 1985). The criteria are as
follows:
1. Intersubjective testability/falsifiability. Theories possess
intersubjective testability
when they generate hypotheses that are testable from an
empirical standpoint. That is,
if a theory is falsifiable, evidence can be gathered to negate or
deny the hypothesis.
2. Internal consistency. Often theories are complicated entities
that have a number of
stipulations in order to be accurately used. A theory with
internal consistency does
Lan81479_01_c01_001-032.indd 15 5/22/14 11:34 AM
http://www.qsrinternational.com/products_nvivo.aspx
http://provalisresearch.com/products/qualitative-data-analysis-
software/
http://provalisresearch.com/products/qualitative-data-analysis-
software/
http://www.maxqda.com/
http://www.atlasti.com/qualitative-data-analysis-softw.html
Section 1.4How to Evaluate a Theory
not have contradictions maintained within the body of the
theory. Predictions made
by one part of the theory should not be contradicted by other
parts of the theory.
In other words, there should be minimal contradictions in the
expected outcomes
when the theory is applied in a variety of situations.
3. Subsumptive power. A good theory has subsumptive power,
which means that it
can account for the results of prior studies while offering a
theoretical framework.
Later theories must be able to subsume (account for) the
findings of earlier research
studies. If a theory lacks this explanatory power, its benefits
may be limited. New
research that emerges needs to be able to place the context of
the past into the pres-
ent. In other words, new theories have to fit old data.
4. Parsimony. To say that a theory possesses parsimony means
that it is simple yet
complete. When a theory is said to be simple (not simplistic), it
explains the events
or phenomena of interest in the least complicated terms;
sometimes you may hear
of this idea as the principle of Occam’s razor. Occam’s razor is
the notion that when
there are multiple explanations available of varying complexity,
scientists tend to
prefer a simpler explanation to a more complex explanation.
5. Communicability. For a theory to be useful, it must be
communicated in an under-
standable fashion. This is easier said than done. You have
probably read articles
from business journals and found that they are difficult to read.
Business uses its
own terminology and style to communicate results from
research studies. This may
seem obvious, but if a theory is going to be influential, it must
be easily understood.
If your theory is not understandable and cannot be
communicated effectively to oth-
ers, how can anyone benefit from it?
6. Heuristic value. Probably one of the most important
characteristics of a theory is
its heuristic value, or its ability to motivate others to conduct
research on the topic
(also called fecundity). Often a theory can do poorly in a
number of the other areas
listed here, but if a theory has heuristic value, then even a
poorly supported theory
can have value. Sometimes a bad idea or negative beliefs can
inspire good work.
7. Modifiability. The last characteristic of evaluating a theory is
that of modifiability. In
order for a theory to stand the test of time, it must be flexible
and modifiable enough
to incorporate the studies of the future as well as the past
(subsumptive power). A
theory that is rigid and narrow and based on very situation-
specific evidence usually
does not last long.
When thinking about how managers motivate and lead
employees, one approach divides
managers into Theory X and Theory Y (Hawthorne, 2013).
Managers with a Theory X manage-
ment style think that workers lack ambition and must be
properly motivated with incentives
to improve. Managers with a Theory Y leadership style believe
that employees are inherently
motivated and assume self-responsibility for performance
improvements. The belief is that
those who believe in Theory X will be more authoritarian
leaders, and those who believe in
Theory Y will be more management-by-participation leaders.
How might Theory X/Theory Y be thought about or considered
on each of the criteria about
how to evaluate a theory?
• Intersubjective testability: Can we generate hypotheses from
Theory X/Theory Y?
Yes—for example, if Theory Y is correct, there should be less
absenteeism at work
because workers are intrinsically motivated to work compared
to workers who lack
ambition in the Theory X world.
Lan81479_01_c01_001-032.indd 16 5/22/14 11:34 AM
Section 1.5Using the Tools of Business Research
• Internal consistency: It seems that the Theory X and Theory Y
approaches are oppo-
site approaches to a large extent, so that the predictions made
by one theory should
not be contradictory or confused with the other theory.
• Subsumptive power: If this Theory X/Theory Y approach can
also explain other
management theories (such as systems theory or contingency
theory), then Theory
X/Theory Y would be said to have subsumptive power.
• Parsimony: This theory is fairly straightforward and not very
convoluted at all, so
one might conclude that Theory X/Theory Y has good
parsimony.
• Communicability: Theory X/Theory Y is often described in
easy-to-understand lan-
guage, thus it would be well-rated in its communicability.
• Heuristic value: If you are intrigued or encouraged to conduct
research in order to
support or refute Theory X/Theory Y, then the current theory
has heuristic power.
• Modifiability: If new outcomes over time lead to
modifications of Theory X/Theory Y,
but the predictions of the theory mostly remain to hold up, then
the theory would be
thought to have good modifiability.
With the big picture concepts in place—ideas such as the
philosophy of science, characteris-
tics of critical thinking, and ideas about how to evaluate a
theory—much of the remainder of
this book addresses the “nuts and bolts” of doing business
research. Those details involve the
use of various methodologies and tools to achieve those goals.
A brief introduction to some of
the tools a business researcher uses is provided in the next
section.
1.5 Using the Tools of Business Research
Like most other complex endeavors, it takes a great deal of
study and practice to become
proficient as a business researcher, and many in the field would
tell you that it is part science,
part art. This section provides a brief overview of three skills
you must apply as a business
researcher: presenting data fairly, avoiding plagiarism, and
becoming a savvy consumer of
business research.
Presenting the Data: Tips for Graphs and Charts
After gathering and analyzing data, selecting a graph, chart, or
table can be an efficient way to
display data to make an important point. In general, use
graphics sparingly; they are compli-
cated to prepare, and when used indiscriminately, they can
confuse readers. These features
should only be used to clarify a story. In general, it is easier to
write text in a paragraph than
to prepare a table or figure. But if there is a great deal of
quantitative data, a well-prepared
table can advance the discussion—see the examples included
here about the average time
required to start a business (in days) around the world. A well-
placed bar graph showing a
significant outcome can also help express results. When
choosing where and when to use a
graph, chart, or table, make sure that you present complicated
results with clarity, precision,
and efficiency (Tufte, 1983). For an excellent primer on current
data visualization techniques
(including tips on how to present data and presentation software
options), see Yau (2013)
and f lowingdata.com.
Lan81479_01_c01_001-032.indd 17 5/22/14 11:34 AM
http://flowingdata.com
Year
Quits
Layoffs and Discharges
0
20112009200720052003 201320122010200820062004
4,000
3,500
3,000
2,500
2,000
1,500
1,000
500
T
h
o
u
s
a
n
d
s
Section 1.5Using the Tools of Business Research
It is suggested that clear, precise, and efficient graphs should:
• show the data;
• encourage the viewer to think about the content of the graph
rather than focus on
the graphic design;
• avoid distortions;
• present much data in a small space, making large datasets
more coherent;
• reveal the complexity of data on broad and fine levels;
• serve a clear purpose (description, exploration, tabulation, or
decoration); and
• have close integration with the text that accompanies the
graph (Tufte, 1983).
For an example of a particularly well-designed graphic, see
Figure 1.3 (Rees, 2012):
One of the most important considerations when crafting a
graphic is the message you want to
convey about the data. You have flexibility in how your
message comes across, just by making
some important changes in displaying the data.
Using data from the World Bank (2013), look at the data from
1993 to 2012 that depict the aver-
age number of calendar days required to legally operate a
business by country (see Table 1.2).
Figure 1.3: Number of employee layoffs, discharges, and quits
A well-designed graphic focuses on content, captures the
complexity of change over time, and is
readable and understandable. This graph shows the convergence
of rising layoffs/discharges and
falling quits near the start of 2008 running through the middle
of 2009.
Source: Based on Bureau of Labor Statistics, Job Openings and
Labor Turnover Survey, January 17, 2014.
Year
Quits
Layoffs and Discharges
0
20112009200720052003 201320122010200820062004
4,000
3,500
3,000
2,500
2,000
1,500
1,000
500
T
h
o
u
s
a
n
d
s
Lan81479_01_c01_001-032.indd 18 5/22/14 11:34 AM
Year
World
25
20112009200720052003 20122010200820062004
55
50
45
40
35
30
D
a
y
s
Section 1.5Using the Tools of Business Research
Table 1.2: Average number of days required to start a business
by country
Country Year
2008 2009 2010 2011 2012
Argentina 31 26 26 26 26
Bulgaria 49 18 18 18 18
Canada 5 5 5 5 5
China 41 38 38 38 33
Greece 19 19 19 11 11
Mongolia 13 13 13 13 12
New Zealand 1 1 1 1 1
Spain 47 47 47 28 28
United States 6 6 6 6 6
Venezuela 141 141 141 141 144
Source: World Bank. (2013). Time required to start a business
(days). Retrieved from http://data.worldbank.org/indicator
/IC.REG.DURS/countries/1W?display=default
The data in Table 1.2 tell a story; if you want to start a business
quickly, where might you look? If
it takes a long period of time to establish a new business, then
perhaps a strategy in those coun-
tries is to partner with an existing business. Finding, reading,
understanding, and interpreting
the data from business research can be extremely valuable.
When looking at a figure of the world
average over time (all countries in the database), it looks like
what you see in Figure 1.4.
Figure 1.4: Average number of days required to start a business
by year
Source: World Bank. (2013). Time required to start a business
(days). Retrieved from http://data.worldbank.org/indicator/IC
.REG.DURS/countries?display=graph. Reprinted with
permission.
Year
World
25
20112009200720052003 20122010200820062004
55
50
45
40
35
30
D
a
y
s
Lan81479_01_c01_001-032.indd 19 5/22/14 11:34 AM
http://data.worldbank.org/indicator/IC.REG.DURS/countries/1
W?display=default
http://data.worldbank.org/indicator/IC.REG.DURS/countries/1
W?display=default
http://data.worldbank.org/indicator/IC.REG.DURS/countries?dis
play=graph
http://data.worldbank.org/indicator/IC.REG.DURS/countries?dis
play=graph
Section 1.5Using the Tools of Business Research
Of course, graphs are intended to communicate, but researchers
need to be fair with the data.
Try not to distort the graph to make a point—ideally, the data
are interpreted by the reader and
the reader is not influenced by misleading graphics. Here are
some useful tips to consider when
creating graphs:
1. The ordinate ( y-axis, vertical line) depicts the dependent
variable (score, measure,
or outcome), and this line should be about two-thirds the length
of the abscissa
(x-axis, horizontal line), which depicts the independent variable
(factors that are
controlled, manipulated, or arranged). For every inch up the
ordinate, the abscissa
should be 1.5 to 1.6 inches long.
2. Label both axes and provide a figure legend in the graph if
necessary.
3. In its final form, the font size on the graph should be no
smaller than 1/16th of an
inch when printed.
4. The demands of your audience (e.g., your instructor or a
professional journal) may
dictate other procedures for creating acceptable graphs. When in
doubt, consult the
source/audience.
Avoiding Plagiarism: Tips for Prevention
Another distortion to be avoided throughout the research
process is plagiarism. In this sec-
tion, you will read about types of plagiarism, why it is wrong,
and how to avoid it.
Sometimes students become frustrated with the necessity for
citation, and when they look
at their completed research paper, they see citations
everywhere. They wonder where the
creativity is if their research paper is about other researchers’
ideas. The creativity in science
is in the combination of ideas, or how the researcher puts them
together. When a researcher
shows trends in the literature or identifies common threads
across different areas of business
research, that is creative. Creativity also comes in the
development of a new method to test a
hypothesis, or an innovative approach to understanding an age-
old problem. Researchers are
creative, but they also value the intellectual property of others,
which is why it is important to
avoid plagiarism. Academic and professional writing should be
clear and effective, as it is an
important 21st-century skill, but it must also be accurate and
honest (Roig, 2008).
Essentially, plagiarism occurs when you borrow intellectual
property without crediting
the original source. There are two categories of plagiarism—
intentional and unintentional.
Intentional plagiarism means just what it sounds like—cheating
on purpose. Oftentimes
intentional plagiarism occurs due to student procrastination and
panic, when the student is
under a deadline to complete an assignment (Roig, 2008). Some
examples of intentional pla-
giarism include (a) downloading and turning in a paper from the
Web; (b) including a graph
or table from someone else’s work without proper citation; (c)
copying phrases, sentences,
or paragraphs from others’ work without using proper citation
or quotation format; (d) para-
phrasing or summarizing others’ work without citation; and (e)
turning in one’s own previ-
ously written work when prohibited to do so by the instructor
(Harris, 2005).
Unintentional plagiarism can occur through a number of
methods. For example, you might
not completely understand the rules for citation, you might be
careless when taking notes, you
might cite opinions from the Internet that are uninformed, or
you might be sloppy in following
the rules for citation (Harris, 2005). Just because you are
unaware that you plagiarized does
not mean it is acceptable to do so. The best protection you can
have is to know, understand, and
Lan81479_01_c01_001-032.indd 20 5/22/14 11:34 AM
Section 1.5Using the Tools of Business Research
apply the rules for proper citation. It has been suggested that
you should cite a source any time
information comes externally, or outside of your own
knowledge (Harris, 2005).
When deciding how to use someone else’s work in your own,
you have three options: para-
phrasing, summarizing, and quoting. Paraphrasing is to take
someone’s ideas or words and
put them into the writer’s own words, with the number of words
used being roughly equiv-
alent to the number of words from the original source.
Summarizing is taking someone’s
work and putting it into the writer’s own words, but with the
result being shorter than the
original (Harris, 2005). Quoting means using the original
author’s exact words. For all three
techniques, you must cite the work of the originators of the
ideas.
Instructors can help you distinguish between what does and
does not need to be cited. Be
careful with common knowledge, as it is not as common as you
think. This is especially true in
the business realm, because some individuals may think they are
experts when they are not.
Individuals often rely on anecdotes and personal experiences as
common knowledge (“Since
everyone I know has an iPhone, the iPhone must be the top-
selling phone”). If the information
you present as common knowledge truly is common knowledge,
then it should not be diffi-
cult to locate a source to support your claim. Although some
might not think that plagiarizing
is a big deal, it is. The following is a list of reasons why
plagiarism is wrong (modified from
Appleby, 2005, p. 9):
1. It is considered a criminal offense (i.e., the theft of
intellectual property) and can
result in fines and/or imprisonment.
2. It is academically dishonest and can lead to serious sanctions
from the university.
3. It undermines the academic integrity and ethical atmosphere
of the university.
4. It violates the mission of higher education to emphasize “a
respect for knowledge.”
5. It involves a passive learning process that obstructs the
acquisition and understand-
ing of meaningful academic material.
6. It stalls or retards intellectual, moral, and social
development.
7. It is contrary to the concept of critical thinking.
8. It promotes feelings of lowered self-esteem in those who
believe they must practice
it to survive academically.
9. It produces alumni whose inferior knowledge, abilities, and
moral standards tarnish
the public image of the college and lower the perceived value of
a degree in the eyes
of those who evaluate current students who are seeking
employment or admission
into graduate school.
10. It violates the code of ethics of professional societies that
represent business.
So what can you do to avoid plagiarism? By following a few
rules, you can avoid plagiarizing
others or being plagiarized yourself.
• Save and print all drafts and notes—having these items will
help support the origi-
nality of your written work.
• Photocopy or print all of your sources—and do not cite
something that you have not
actually read yourself.
• Seek out the advice of your instructor and/or teaching
assistants. If someone has
been reviewing your work all semester, it will be easier for you
to make the case that
your work is actually your own.
Lan81479_01_c01_001-032.indd 21 5/22/14 11:34 AM
Section 1.5Using the Tools of Business Research
• Protect your data and your computer passwords against theft.
• Do not lend any paper to others—even if a student just wants
to see what a business
research paper looks like.
• Report any theft immediately to the proper authorities, and in
the case of your
academic work, to your instructors (adapted from Harris, 2005).
Plagiarism is a form of cheating with serious consequences. If
one intends on cheating
through college, why bother? Do most people want to have life-
saving surgery performed by
a surgeon who cheated his or her way through medical school?
Would you want to consult a
lawyer who cheated through law school, or a therapist who
cheated through graduate school?
Plagiarism and cheating have the potential to be harmful to
others, but most of all, cheaters
hurt themselves.
Being a Savvy Consumer of Research
When you write, you produce information; when you conduct
business research, you are a
producer of science and business research. Although you will
read about many of the skills
necessary to be a producer of research in this text, producers of
research are also consumers
of research. A student enrolled in a business research course
may not be interested in con-
ducting research for a career, but there are at least four reasons
why knowledge of business
methods is helpful (Emory, 1985):
• a manager needs more information (either delegating the task
or conducting new
research);
• a higher-level manager may delegate the need for business
research to you;
• understanding business research can help you be a savvy
purchaser and consumer
of business research and its outcomes; and
• one’s interest in business research can change from a
peripheral interest to a major
focus, such as with business intelligence.
In some cases, someone who adopts a business research
approach to decision making may be
more of a consumer than a producer of research. By developing
a honed sense of critiquing,
this skill can be utilized to examine any type of research finding
or claim (thus, the savvy con-
sumer of research). Some of the potential pitfalls in consuming
research involve the appear-
ance of illusory correlations and the natural bias to believe what
one wants to believe. Being
a good researcher or a savvy consumer of research necessitates
a fair measure of quantitative
reasoning skills. Some specific examples of types of
inappropriate claims are presented in the
following sections.
Illusory Correlations and Confirmation Bias
Illusory correlations and confirmation biases are two ways that
common sense can mislead
us. An illusory correlation is the tendency to believe that two
variables are related when
they are not. For example, a student may be convinced that her
favorite sports team wins
only when she watches. If she were to gather the data and look
at her team’s win–loss record
when she watches and when she does not watch, she is likely to
find that her presence is not
a deciding factor. Or perhaps another friend regularly reads the
horoscope and sees this: “A
big improvement is in the works, one that you may know
nothing about, and today is the day
for the big unveiling.” A job-seeking recent college graduate
might spot some new listings for
Lan81479_01_c01_001-032.indd 22 5/22/14 11:34 AM
Section 1.5Using the Tools of Business Research
interesting positions and decide the horoscope was right. When
individuals look for an asso-
ciation, they often find it. Yet careful researchers repeatedly
fail to find evidence to support
the accuracy of astrology (Dean & Kelly, 2003). Using
quantitative reasoning helps individuals
to see past illusory correlations.
A confirmation bias is our tendency to “see” evidence that fits
our beliefs and to ignore
evidence that does not. This tendency is the main reason that we
“see” illusory correlations.
As an example, it is well documented that driving while trying
to operate a cell phone is a
dangerous distraction, but growing numbers of drivers are
calling and texting (Richtel, 2009).
Confirmation bias is the idea that if one believes it, it must be
true—so when people think
they are good drivers who can avoid accidents while using their
cell phones, they may be
under an illusion that can cause trouble for themselves and
those around them. We can know
what the right thing to do is and still ignore that information.
Coincidence and Probability
When business researchers understand the logic that underlies
the occurrence of behaviors
and events, this helps them make more accurate predictions
about future behaviors. When
attempting to understand and predict human behavior, it is
helpful to know about coinci-
dence and probability. Coincidence is when two random events
occur close in time to one
another, which lead us to believe the events are connected
somehow. A person might observe
that every time he attends a major league baseball game, his
favorite team wins. In fact, our
belief in coincidences leads to our beliefs in illusory
correlations. If that pairing of events hap-
pens enough times, one may think the events are related, but it
is just a coincidence.
Probability is the concept of how frequently an event occurs
compared to how often the
event could occur. If a person flips a quarter 100 times, it
should come up with approximately
50 heads and 50 tails. Thus, the expected probability of getting
heads is 50 out of 100, or 0.50,
meaning half the time. Quantitative reasoning shows that
coincidence is without a scientific
basis. But probability does have a scientific basis. Take this
example: A person may have won
a state lottery four times, and on two of those occasions bought
the winning ticket from the
same store. People may start to believe that there is a lucky
store, or others may ask this lot-
tery winner to buy their lottery tickets, thinking that this person
is very lucky. What are the
odds of a single store having multiple payouts, or a single
person winning the lottery multiple
times? Well, probability and statistics can help us answer that
question.
When looking at a coincidence, one has to remember the full
context, or the background.
Sometimes we are not good at understanding the base rates of
an event; we are surprised
when a new business fails even though 56% of new businesses
fail within their first 4 years
(Ask.com, 2013). Statistics requires that we look at the
background or base rate. Statistical rea-
soning keeps us from declaring that some sequence of events is
“a miracle” when the events
can be explained from a statistical perspective (and not just
relying on the convenient—and
fun—concepts of luck and magic). A scientific approach
demands a deeper investigation into
explaining the events that occur around us.
Lan81479_01_c01_001-032.indd 23 5/22/14 11:34 AM
Section 1.5Using the Tools of Business Research
Case Study: Participatory Oral Presentation of Research:
The Data Walk
Profile: Jolie Bain Pillsbury, Sherbrooke Consulting, Inc.
Oral presentations must capture the intended audience’s interest
and convey information in a
way that allows those in the audience to be savvy consumers of
research, despite different learn-
ing styles, backgrounds, and perspectives on the topic
presented. Techniques that engage learn-
ers of all kinds (kinesthetic, auditory, and visual) can create
more engagement than traditional
chalk talks and slide decks.
Dr. Jolie Pillsbury consults with governments, foundations, and
other nonprofit organizations to
develop strategy affecting public policy. Pillsbury developed
the Data Walk oral presentation tool
to immerse client groups in relevant information at the
beginning of collaborative working ses-
sions. “The Data Walk is designed to enable people to
understand their role in relation to results,
and to determine what and how they can contribute to that
result—a foundation for working
with others so that their contributions achieve more significant
impact,” Pillsbury said.
Pillsbury applied the Data Walk technique with the Maryland
Department of Education to deliver
a Leadership in Action Program (LAP) designed to achieve a
big result: All children in Baltimore
city entering school ready to learn. Describing the Data Walk
for Baltimore City, Pillsbury set the
stage: “Imagine that you are the superintendent of a school
district, and the mayor and the gover-
nor have invited you and about 30 other leaders in your city to
come together to work on improv-
ing the number and percentage of children entering school ready
to learn.” Attendees have come
from the faith community and businesses, as well as divisions of
local and state government and
school administration.
“While you are being given your nametags, you are also given a
set of questions that probe your
reactions to the data, and how you feel connected to the
results,” Pillsbury continued. Instead of
beginning the meeting with a welcome speech, the convener
introduces you to two other attend-
ees and directs you to 20 large displays of data about children
entering school, arranged around
the room. Pairs and trios walk and talk, exploring, discussing,
and reacting to the data on the wall.
The data selected and the style of presentation (charts, graphs,
etc.) have been carefully chosen
to accurately convey current statistics and trends in school
readiness. “Some of the data is about
the whole population, all the children in your city,” Pillsbury
explained. “Some is comparative of
subsets within that population—for example, by ethnicity,
geography, or other factors, such as
the success rate of a private day care provider compared to the
public Head Start program in
helping children be ready to learn.”
When the groups have finished their Data Walk, partici-
pants settle at a semi-circle of tables. Instead of the usual
introductions by name and title, each describes his or her
reaction to the data. “You are immediately immersed in a
collaborative dialogue about all the different perspectives,”
Pillsbury said. Based on that initial dialogue, the group
begins developing an action plan, setting deadlines, and
assigning accountability to make a measurable improve-
ment in the results displayed along the Data Walk.
© Monty Rakusen/cultura/Corbis
(continued)
Lan81479_01_c01_001-032.indd 24 5/22/14 11:34 AM
Summary & Resources
The Data Walk technique engages a group of consumers of
research so that they have the full
context to apply thestatistical information presented to them. By
encouraging discussion right
from the start, the process reduces the potential pitfalls of
individuals’ falling for illusory cor-
relations, natural biases, and misperceptions of coincidence and
probability. By putting people
in motion in a participatory activity, the technique achieves
high engagement. Pillsbury’s Data
Walks have achieved measurable success. “Data walks provide
an opportunity for leaders to
share very diverse perspectives from the view of public and
nonprofit sector agencies and across
disciplines,” said Pillsbury.
Sources: Interview with Jolie Bain Pillsbury conducted
February 8, 2013.
Bain Pillsbury, Results Based Facilitation, Book Two,
Advanced Skills, publication due in 2014.
Summary & Resources
Summary
• Business research is a form of scientific research, and its
ultimate goal is to provide
reliable information/data that helps to inform decision making.
The skills acquired
during deep study of business research methods overlap nicely
with many of the
skills needed for success in the 21st-century workforce.
• By utilizing a scientific approach, business researchers can
systematically identify,
formulate, and test hypotheses via the scientific method,
allowing for firm scientific
conclusions (but remembering the limitations and cautions of
science).
• Essentially, scientific thinking is a specialized form of critical
thinking, and adhering
to the suggestions about critical thinking can aid in better
decision making, includ-
ing in the context of business research and an educated
citizenry.
• Science-based tools can then be utilized to evaluate the
applicability of data and
resulting theories to specific business research scenarios.
• The chapter concludes with a brief introduction to some of the
tools of business
research trade; tips about presenting visual data, avoiding
plagiarism, and being
a smart consumer of research. Understanding and applying these
tools helps to
develop a coherent set of skills that are desirable in the realm of
business research
methods. Those key aspects of good research practices are
presented and summa-
rized in Figure 1.5.
Case Study: Participatory Oral Presentation of Research:
The Data Walk (continued)
Lan81479_01_c01_001-032.indd 25 5/22/14 11:34 AM
Check (√) Good Business Research Characteristic
Research problem is clearly identified.
Researcher prepares a complete research proposal/protocol.
Literature review is complete, with key terms defined.
Methodology is described completely, including the sampling
plan.
Procedures for data collection are identified and appropriate.
Ethical protections are in place for participants (e.g.,
individuals, organizations, clients).
Recommendations are appropriate for both the methodology
used and the
resulting outcomes.
Research limitations are clearly stated with objectivity, striving
for accurate
interpretations of data analysis outcomes.
Comparisons are made between intended study design and
actual outcomes,
with limitations noted and the impact of these limitations
detailed.
Research findings are sufficiently detailed and thorough to meet
the needs of
decision makers, with an emphasis on sufficient data collection
measures.
Research outcomes are clearly articulated with words, tables,
graphs, and/or figures.
Research outcomes are presented in a logical fashion to meet
the needs of the
manager/organization in making the decision.
Executive summary of the project and its outcomes are
included.
Data-based recommendations are congruent with the actual data
analysis results.
Researcher documents his/her credentials appropriately within
the context of the report.
Summary & Resources
Post-Test
1. The application of scientific principles to gather data for
making business decisions is
called:
a. case studies.
b. business data analysis.
c. costsversusbenefits.
d. business research.
2. Compared to scientific research, nonscientific research has
the advantage of:
a. helping answer questions about motivation or its causes.
b. using more logical methods.
c. being more subjective and open to question.
d. providinggreaterconfidenceintheoutcomesduetoobjectivity.
3. Common sense is one form of which of the following classic
“ways of knowing”?
a. tenacity
b. intuition
c. authority
d. mysticism
Figure 1.5: A checklist of good business research characteristics
Source: Adapted from Cooper, D. R., & Schindler, P. S. (2008).
Business research methods (10th ed.). Boston, MA: McGraw-
Hill.
Check (√) Good Business Research Characteristic
Research problem is clearly identified.
Researcher prepares a complete research proposal/protocol.
Literature review is complete, with key terms defined.
Methodology is described completely, including the sampling
plan.
Procedures for data collection are identified and appropriate.
Ethical protections are in place for participants (e.g.,
individuals, organizations, clients).
Recommendations are appropriate for both the methodology
used and the
resulting outcomes.
Research limitations are clearly stated with objectivity, striving
for accurate
interpretations of data analysis outcomes.
Comparisons are made between intended study design and
actual outcomes,
with limitations noted and the impact of these limitations
detailed.
Research findings are sufficiently detailed and thorough to meet
the needs of
decision makers, with an emphasis on sufficient data collection
measures.
Research outcomes are clearly articulated with words, tables,
graphs, and/or figures.
Research outcomes are presented in a logical fashion to meet
the needs of the
manager/organization in making the decision.
Executive summary of the project and its outcomes are
included.
Data-based recommendations are congruent with the actual data
analysis results.
Researcher documents his/her credentials appropriately within
the context of the report.
Lan81479_01_c01_001-032.indd 26 5/22/14 11:34 AM
Summary & Resources
4. What is critical thinking?
a. a step-by-step process for undertaking business research
b. anothernameforthescientificmethod
c.
amethodfordefiningaproblemandexaminingthedefinitionofterms
d. a group of strategies for consuming information well
5. When answering research questions, quantitative research
offers more insight than
qualitative research does.
a. true
b. false
6. Which of the following accurately describes a difference
between quantitative research
and qualitative research?
a. Quantitative research describes people in their natural
settings, while qualitative
research deals with behaviors that can be counted.
b. Quantitative research is used to discover patterns, while the
purpose of
qualitative research is to test.
c. Quantitative research uses numerical data, while qualitative
research collects
data verbally.
d. Quantitative research uses explanations to answer research
questions, while
qualitative research is statistical.
7. Theories that can be tested empirically are said to have
__________, while theories that do
not contradict themselves have __________.
a. intersubjective testability; internal consistency
b. subsumptive power; heuristic value
c. internalconsistency;modifiability
d. heuristic value; communicability
8. Which criterion of theory evaluation explains why even a
poorly supported theory can
be useful?
a. modifiability
b. parsimony
c. communicability
d. heuristic value
9. Unintentional plagiarism caused by not understanding the
rules for citation is more
acceptable than intentional plagiarism.
a. true
b. false
10. The human tendency to disregard evidence that does not fit
what we already believe is
known as:
a. confirmationbias.
b. illusory correlation.
c. coincidence bias.
d. probability correlation.
Lan81479_01_c01_001-032.indd 27 5/22/14 11:34 AM
Summary & Resources
Answers
1. d. business research. The correct answer can be found in
Section 1.1.
2. a. helping answer questions about motivation or its causes.
The correct answer can
be found in Section 1.1.
3. b. intuition. The correct answer can be found in Section 1.2.
4. d. a group of strategies for consuming information well. The
correct answer can be
found in Section 1.2.
5. b. False. The correct answer can be found in Section 1.3.
6. c. Quantitative research uses numerical data, while
qualitative research collects
data verbally. The correct answer can be found in Section 1.3.
7. a. intersubjective testability; internal consistency. The
correct answer can be found
in Section 1.4.
8. d. heuristic value. The correct answer can be found in Section
1.4.
9. b. False. The correct answer can be found in Section 1.5.
10. a.
confirmationbias.ThecorrectanswercanbefoundinSection1.5.
Questions for Critical Thinking
1. Either as a businessperson or as a consumer, you have had
experiences with the world
of business. How do the ideas presented in this chapter fit with
your current practices?
Were there strategies presented here that you are excited to
implement in your own
life? Explain. Were there ideas presented that, although they
make sense “in theory,”
you doubt that you would ever implement or follow? Why not?
2. How much of the scientific method do you remember from
your past? Many students
are exposed to the tenets of the scientific method in grade
school. Depending on your
undergraduate education, your major, and how your professors
were trained, you
may or may not have had a heavy dose of the scientific method
in the recent past.
How well do your recollections map onto the materials
presented in this chapter?
Do you see the connections between a scientific approach and a
business research
methods approach? Explain why or why not.
3. Business inherently involves risk, and there are occasions
when neither time nor
resources will allow for thorough business research methods to
be followed in order
to yield information to assist in decision making. It has been
said that faith is the belief
in an idea in the absence of data. Are there some types of
decisions where intuitions
and “gut” feelings are enough to make business decisions?
Explore this idea a bit—in
what situations would you conduct your own business research
(or hire someone to
do so), compared to those business decisions where no
additional research is neces-
sary? Some managers tend to rely on their own experienced
past—where might that
approach lead a manager to poor decision making, and how
might the application of
business research method help?
Lan81479_01_c01_001-032.indd 28 5/22/14 11:34 AM
Summary & Resources
Key Terms
abscissa The x-axis or horizontal line/plane
in a line graph.
anecdotal evidence Evidence based on
a personal story or experience that is gen-
erally not considered to be scientific or
empirical support for a hypothesis, but could
contribute to hypothesis development.
authority An expert or highly regarded
individual consulted for his or her learned
opinions.
business research The application of sci-
entific principles to gather relevant data that
aids in business decision making.
cause-and-effect relationship A direct
relationship where an event occurs as a con-
sequence of a previous event taking place.
coincidence When two random events
occur in close proximity of one another;
because of this proximity a causal link is
erroneously believed to exist.
confirmation bias Individuals tend to seek
out and believe evidence that is consistent
with their already held beliefs.
determinism The theory that all events
are predictable and that if all causes were
known for an event, that event would be
completely predictable. Also known as the
“lawfulness of nature.”
empirical evidence Evidence produced by
science.
fecundity The generation of new ideas;
fruitfulness.
finite causation The concept that there are
a limited number of causes for any effect or
event, and that these causes are discoverable
and understandable.
heuristic value A theory’s ability to moti-
vate others to conduct research on the topic
and generate new ideas about the world.
illusory correlation The tendency to
believe that two variables or events are con-
nected in a meaningful fashion when in fact
there is no connection (akin to superstition).
inattentional blindness Sometimes when
asked to concentrate on the details of one
situation, pertinent events that occur are not
“seen” by the observer due to a lack of atten-
tion or divided attention.
intentional plagiarism Purposeful cheat-
ing often due to procrastination and panic
about assignment deadlines; not giving
credit for ideas and work that has been pre-
viously produced from other sources.
internal consistency A characteristic of a
theory that does not present contradictions
within its body.
intersubjective testability When a theory
generates hypotheses that are testable from
an empirical standpoint.
intuition A person’s internal or “gut” feel-
ing that a belief is true in the absence of
empirical evidence.
logic Understanding human behavior
through reasoning, such as philosophical logic.
modifiability The characteristic a theory has
when it is flexible enough to incorporate stud-
ies of the future as well as studies of the past.
mysticism Types of beliefs that are typi-
cally formed through unique and unpredict-
able events that are difficult to recreate and
study in a scientific context.
Lan81479_01_c01_001-032.indd 29 5/22/14 11:34 AM
Summary & Resources
operational definitions Concise defini-
tions that exhibit precisely what is being
measured.
ordinate The y-axis or vertical line/plane
in a line graph.
paraphrasing Translating the words of
another into your own words, with the
length of both statements about the same.
parsimony A simpler, more conservative
approach to deciding which theories to utilize.
plagiarism Claiming the ideas of oth-
ers as your own without providing proper
attribution.
probability The frequency of an event
occurring in comparison to the frequency
that an event could occur.
qualitative research A variable/research
approach where responses differ in kind or
type and can be expressed in words.
quantitative research A variable/research
approach where responses differ in amount
and are usually described by numbers.
quoting The use of the exact words that the
original author used.
science A method of understanding events
in the world based on the hallmarks of
observation and objectivity, as well as the
product of outcomes from application of the
scientific method.
scientific method A method of studying
the world by observing and developing theo-
ries through scientific hypotheses.
skepticism A belief that persuasive evi-
dence must be collected and evaluated prior
to drawing conclusions about phenomena.
subsumptive power The ability of a theory
to account for the results of prior studies
while offering a theoretical framework.
summarizing Translating the words of
another into your own words, but using
fewer words in your new description.
syllogism A philosophical statement involv-
ing two premises and a conclusion in which
some or all parts can be correct or incorrect.
tenacity Persistently holding to a belief,
often in the form of a superstition formed
due to coincidence.
uncertainty A lack of confidence in existing
data or conclusions due to the emergence of
new data or beliefs that may trigger a reex-
amination of previously held beliefs.
unintentional plagiarism Sloppiness or
misunderstandings on the writer’s behalf
that leads to the use of others’ ideas without
proper attribution.
values of science Outlined values that
state: science places high value on theories
that have the largest explanatory power; sci-
ence values fecundity; science values open-
mindedness; scientists require logical think-
ing in their explanations; science values
skepticism; and science is self-correcting.
Lan81479_01_c01_001-032.indd 30 5/22/14 11:34 AM
Summary & Resources
Additional Resources
• For a more complete description of 21st-century skills, see
this resource.
http://www.skills21.org/
• This is the homepage for the Journal of Business Research—
browse recent journal
article titles.
http://www.journals.elsevier.com/journal-of-business-research/
• A brief article about the notion of “scientific proof.”
http://www.psychologytoday.com/blog/the-scientific-
fundamentalist/200811
/common-misconceptions-about-science-i-scientific-proof
• A brief article about scientific versus unscientific methods in
business research.
http://smallbusiness.chron.com/scientific-vs-unscientific-
methods-business
-research-42828.html
• An informative blog entry that discusses skills that
entrepreneurs need.
http://blogs.hbr.org/cs/2012/12/new_research_the_skills_that_m
.html
Lan81479_01_c01_001-032.indd 31 5/22/14 11:34 AM
http://www.skills21.org/
http://www.journals.elsevier.com/journal-of-business-research/
http://www.psychologytoday.com/blog/the-scientific-
fundamentalist/200811/common-misconceptions-about-science-
i-scientific-proof
http://www.psychologytoday.com/blog/the-scientific-
fundamentalist/200811/common-misconceptions-about-science-
i-scientific-proof
http://smallbusiness.chron.com/scientific-vs-unscientific-
methods-business-research-42828.html
http://smallbusiness.chron.com/scientific-vs-unscientific-
methods-business-research-42828.html
http://blogs.hbr.org/cs/2012/12/new_research_the_skills_that_m
.html
Lan81479_01_c01_001-032.indd 32 5/22/14 11:34 AM
02CH_Landrum_Bus
iness.pdf
33
2Finding and Reading Research:
Turning Information
Into Knowledge
John Lamb/Digital Vision/Getty Images
Learning Objectives
After reading this chapter, you should be able to:
• Identify and differentiate between three major types of
research evidence.
• Describe how to conduct a database search for relevant
literature.
• Understand how to read a research article and identify its key
components.
• Explain how to critique sources.
• Differentiate the nuances between different types of data
presented in research studies, realizing
that the type and kind of data collected are related to the
veracity of the conclusions drawn.
co-photo
co-intro
co-cn
co-box
co-cr
co-ct
CO_CRD
CT
CN
CO_H1
CO_TX
CO_NL
Lan81479_02_c02_033-068.indd 33 5/22/14 11:35 AM
Introduction
Pre-Test
1. Which type of research is most useful when researchers know
little about a
phenomenon?
a. relational research
b. correlational research
c. descriptive research
d. causal research
2. In which section of a formal research paper is a literature
review most often found?
a. Introduction
b. Method
c. Results
d. References
3. Because currency is essential to credibility, research studies
more than 10 years old
should not be cited.
a. true
b. false
4. Asking whether the independent and dependent variables are
clearly defined is useful
for critiquing which part of a research journal article?
a. methodology
b. thesis statement or hypothesis
c. problem and purpose of the study
d. analyses and results
5. The goal of review articles is to compare and evaluate
published literature on a
particular area.
a. true
b. false
Answers
1. c. descriptive research. The correct answer can be found in
Section 2.1.
2. a. introduction. The correct answer can be found in Section
2.2.
3. b. false. The correct answer can be found in Section 2.3.
4. a. methodology. The correct answer can be found in Section
2.4.
5. a. true. The correct answer can be found in Section 2.5.
Introduction
In a blog post, Lurie (2012) made the simple yet profound
observation that information is
free, and knowledge is not. That is, information is the raw data
that exists in the world, and
can only get a person so far. The valued commodity is
knowledge, or the combined infor-
mation and skills acquired through experience or education. The
path from information
to knowledge begins with the topics presented in this chapter.
Another conceptualization
of this issue is known as the DIKW hierarchy, which is
shorthand for data-information-
knowledge-wisdom (Rowley, 2007). Although the implicit
assumption is often that data
are used to create information, information is used to create
knowledge, and knowledge is
photo-caption
photo-box-right-thin
photo
box-1
BX1_H1
BX_TX
PT
PT_NLF
PT_NL
PT_ANS
PT_ANS_NLF
PT_ANS_NL
PT_ANS_NLL
sec_t
kt
i
Ethics and impact of internet research

Más contenido relacionado

Similar a Ethics and impact of internet research

Similar a Ethics and impact of internet research (10)

RCH 7301, Critical Thinking for Doctoral Learners 1
  RCH 7301, Critical Thinking for Doctoral Learners 1   RCH 7301, Critical Thinking for Doctoral Learners 1
RCH 7301, Critical Thinking for Doctoral Learners 1
 
Research process by Dr.T.V.Rao MD
Research process by Dr.T.V.Rao MDResearch process by Dr.T.V.Rao MD
Research process by Dr.T.V.Rao MD
 
Collaborative Action Research 2003
Collaborative Action Research 2003Collaborative Action Research 2003
Collaborative Action Research 2003
 
A Qualitative Research Question Paper
A Qualitative Research Question PaperA Qualitative Research Question Paper
A Qualitative Research Question Paper
 
Research Essay Questions
Research Essay QuestionsResearch Essay Questions
Research Essay Questions
 
Types of exploratory research design
Types of exploratory research designTypes of exploratory research design
Types of exploratory research design
 
Research design
Research designResearch design
Research design
 
Research design
Research designResearch design
Research design
 
Lecture 1-05.01.15
Lecture 1-05.01.15Lecture 1-05.01.15
Lecture 1-05.01.15
 
Research questions and research design
Research questions and research design Research questions and research design
Research questions and research design
 

Más de ambersalomon88660

1. Lists crimes and crime involvement on the Mendez brothers.2.I.docx
1. Lists crimes and crime involvement on the Mendez brothers.2.I.docx1. Lists crimes and crime involvement on the Mendez brothers.2.I.docx
1. Lists crimes and crime involvement on the Mendez brothers.2.I.docxambersalomon88660
 
1. Lists and analyzes strengths and weaknesses based on each of th.docx
1. Lists and analyzes strengths and weaknesses based on each of th.docx1. Lists and analyzes strengths and weaknesses based on each of th.docx
1. Lists and analyzes strengths and weaknesses based on each of th.docxambersalomon88660
 
1. List eight basic initiatives that companies can use to gain c.docx
1. List eight basic initiatives that companies can use to gain c.docx1. List eight basic initiatives that companies can use to gain c.docx
1. List eight basic initiatives that companies can use to gain c.docxambersalomon88660
 
1. Koffman Corporation is trying to raise capital. What method wou.docx
1. Koffman Corporation is trying to raise capital. What method wou.docx1. Koffman Corporation is trying to raise capital. What method wou.docx
1. Koffman Corporation is trying to raise capital. What method wou.docxambersalomon88660
 
1. List all the entities that interact with the TIMS system. Start b.docx
1. List all the entities that interact with the TIMS system. Start b.docx1. List all the entities that interact with the TIMS system. Start b.docx
1. List all the entities that interact with the TIMS system. Start b.docxambersalomon88660
 
1. Know the terminology flash cards.2. Know the hist.docx
1. Know the terminology flash cards.2. Know the hist.docx1. Know the terminology flash cards.2. Know the hist.docx
1. Know the terminology flash cards.2. Know the hist.docxambersalomon88660
 
1. Journal Entry The attached (BUROS Center for Testing).docx
1. Journal Entry  The attached (BUROS Center for Testing).docx1. Journal Entry  The attached (BUROS Center for Testing).docx
1. Journal Entry The attached (BUROS Center for Testing).docxambersalomon88660
 
1. Introduction and thesisThrough extensive research I hope to f.docx
1. Introduction and thesisThrough extensive research I hope to f.docx1. Introduction and thesisThrough extensive research I hope to f.docx
1. Introduction and thesisThrough extensive research I hope to f.docxambersalomon88660
 
1. Is it important the hospital to have a licensure to ensure that.docx
1. Is it important the hospital to have a licensure to ensure that.docx1. Is it important the hospital to have a licensure to ensure that.docx
1. Is it important the hospital to have a licensure to ensure that.docxambersalomon88660
 
1. INTRODUCTION In recent years, energy harvesting fro.docx
1. INTRODUCTION In recent years, energy harvesting fro.docx1. INTRODUCTION In recent years, energy harvesting fro.docx
1. INTRODUCTION In recent years, energy harvesting fro.docxambersalomon88660
 
1. INTRODUCTIONThe rapid of economic growth in China, is a fou.docx
1. INTRODUCTIONThe rapid of economic growth in China, is a fou.docx1. INTRODUCTIONThe rapid of economic growth in China, is a fou.docx
1. INTRODUCTIONThe rapid of economic growth in China, is a fou.docxambersalomon88660
 
1. Introduction to the Topica. What is outsourcingi. Ty.docx
1. Introduction to the Topica. What is outsourcingi. Ty.docx1. Introduction to the Topica. What is outsourcingi. Ty.docx
1. Introduction to the Topica. What is outsourcingi. Ty.docxambersalomon88660
 
1. Introduction 1. Technology and communication 1. Technology .docx
1. Introduction 1. Technology and communication 1. Technology .docx1. Introduction 1. Technology and communication 1. Technology .docx
1. Introduction 1. Technology and communication 1. Technology .docxambersalomon88660
 
1. In your definition of a well-run company, how important a.docx
1. In your definition of a well-run company, how important a.docx1. In your definition of a well-run company, how important a.docx
1. In your definition of a well-run company, how important a.docxambersalomon88660
 
1. In Chapter four titled Academy Training you learned about academi.docx
1. In Chapter four titled Academy Training you learned about academi.docx1. In Chapter four titled Academy Training you learned about academi.docx
1. In Chapter four titled Academy Training you learned about academi.docxambersalomon88660
 
1. In 200 words, describe how Hamlet promotes andor subverts th.docx
1. In 200 words, describe how Hamlet promotes andor subverts th.docx1. In 200 words, describe how Hamlet promotes andor subverts th.docx
1. In 200 words, describe how Hamlet promotes andor subverts th.docxambersalomon88660
 
1. Image 1 courtesy of httpswww.virginiahospitalcenter.com.docx
1. Image 1 courtesy of httpswww.virginiahospitalcenter.com.docx1. Image 1 courtesy of httpswww.virginiahospitalcenter.com.docx
1. Image 1 courtesy of httpswww.virginiahospitalcenter.com.docxambersalomon88660
 
1. If I were to create an SEL program, I would focus on self-awar.docx
1. If I were to create an SEL program, I would focus on self-awar.docx1. If I were to create an SEL program, I would focus on self-awar.docx
1. If I were to create an SEL program, I would focus on self-awar.docxambersalomon88660
 
1. Identify and discuss the factors that contribute to heritage cons.docx
1. Identify and discuss the factors that contribute to heritage cons.docx1. Identify and discuss the factors that contribute to heritage cons.docx
1. Identify and discuss the factors that contribute to heritage cons.docxambersalomon88660
 
1. I think that the top three management positions in a health pla.docx
1. I think that the top three management positions in a health pla.docx1. I think that the top three management positions in a health pla.docx
1. I think that the top three management positions in a health pla.docxambersalomon88660
 

Más de ambersalomon88660 (20)

1. Lists crimes and crime involvement on the Mendez brothers.2.I.docx
1. Lists crimes and crime involvement on the Mendez brothers.2.I.docx1. Lists crimes and crime involvement on the Mendez brothers.2.I.docx
1. Lists crimes and crime involvement on the Mendez brothers.2.I.docx
 
1. Lists and analyzes strengths and weaknesses based on each of th.docx
1. Lists and analyzes strengths and weaknesses based on each of th.docx1. Lists and analyzes strengths and weaknesses based on each of th.docx
1. Lists and analyzes strengths and weaknesses based on each of th.docx
 
1. List eight basic initiatives that companies can use to gain c.docx
1. List eight basic initiatives that companies can use to gain c.docx1. List eight basic initiatives that companies can use to gain c.docx
1. List eight basic initiatives that companies can use to gain c.docx
 
1. Koffman Corporation is trying to raise capital. What method wou.docx
1. Koffman Corporation is trying to raise capital. What method wou.docx1. Koffman Corporation is trying to raise capital. What method wou.docx
1. Koffman Corporation is trying to raise capital. What method wou.docx
 
1. List all the entities that interact with the TIMS system. Start b.docx
1. List all the entities that interact with the TIMS system. Start b.docx1. List all the entities that interact with the TIMS system. Start b.docx
1. List all the entities that interact with the TIMS system. Start b.docx
 
1. Know the terminology flash cards.2. Know the hist.docx
1. Know the terminology flash cards.2. Know the hist.docx1. Know the terminology flash cards.2. Know the hist.docx
1. Know the terminology flash cards.2. Know the hist.docx
 
1. Journal Entry The attached (BUROS Center for Testing).docx
1. Journal Entry  The attached (BUROS Center for Testing).docx1. Journal Entry  The attached (BUROS Center for Testing).docx
1. Journal Entry The attached (BUROS Center for Testing).docx
 
1. Introduction and thesisThrough extensive research I hope to f.docx
1. Introduction and thesisThrough extensive research I hope to f.docx1. Introduction and thesisThrough extensive research I hope to f.docx
1. Introduction and thesisThrough extensive research I hope to f.docx
 
1. Is it important the hospital to have a licensure to ensure that.docx
1. Is it important the hospital to have a licensure to ensure that.docx1. Is it important the hospital to have a licensure to ensure that.docx
1. Is it important the hospital to have a licensure to ensure that.docx
 
1. INTRODUCTION In recent years, energy harvesting fro.docx
1. INTRODUCTION In recent years, energy harvesting fro.docx1. INTRODUCTION In recent years, energy harvesting fro.docx
1. INTRODUCTION In recent years, energy harvesting fro.docx
 
1. INTRODUCTIONThe rapid of economic growth in China, is a fou.docx
1. INTRODUCTIONThe rapid of economic growth in China, is a fou.docx1. INTRODUCTIONThe rapid of economic growth in China, is a fou.docx
1. INTRODUCTIONThe rapid of economic growth in China, is a fou.docx
 
1. Introduction to the Topica. What is outsourcingi. Ty.docx
1. Introduction to the Topica. What is outsourcingi. Ty.docx1. Introduction to the Topica. What is outsourcingi. Ty.docx
1. Introduction to the Topica. What is outsourcingi. Ty.docx
 
1. Introduction 1. Technology and communication 1. Technology .docx
1. Introduction 1. Technology and communication 1. Technology .docx1. Introduction 1. Technology and communication 1. Technology .docx
1. Introduction 1. Technology and communication 1. Technology .docx
 
1. In your definition of a well-run company, how important a.docx
1. In your definition of a well-run company, how important a.docx1. In your definition of a well-run company, how important a.docx
1. In your definition of a well-run company, how important a.docx
 
1. In Chapter four titled Academy Training you learned about academi.docx
1. In Chapter four titled Academy Training you learned about academi.docx1. In Chapter four titled Academy Training you learned about academi.docx
1. In Chapter four titled Academy Training you learned about academi.docx
 
1. In 200 words, describe how Hamlet promotes andor subverts th.docx
1. In 200 words, describe how Hamlet promotes andor subverts th.docx1. In 200 words, describe how Hamlet promotes andor subverts th.docx
1. In 200 words, describe how Hamlet promotes andor subverts th.docx
 
1. Image 1 courtesy of httpswww.virginiahospitalcenter.com.docx
1. Image 1 courtesy of httpswww.virginiahospitalcenter.com.docx1. Image 1 courtesy of httpswww.virginiahospitalcenter.com.docx
1. Image 1 courtesy of httpswww.virginiahospitalcenter.com.docx
 
1. If I were to create an SEL program, I would focus on self-awar.docx
1. If I were to create an SEL program, I would focus on self-awar.docx1. If I were to create an SEL program, I would focus on self-awar.docx
1. If I were to create an SEL program, I would focus on self-awar.docx
 
1. Identify and discuss the factors that contribute to heritage cons.docx
1. Identify and discuss the factors that contribute to heritage cons.docx1. Identify and discuss the factors that contribute to heritage cons.docx
1. Identify and discuss the factors that contribute to heritage cons.docx
 
1. I think that the top three management positions in a health pla.docx
1. I think that the top three management positions in a health pla.docx1. I think that the top three management positions in a health pla.docx
1. I think that the top three management positions in a health pla.docx
 

Último

How to do quick user assign in kanban in Odoo 17 ERP
How to do quick user assign in kanban in Odoo 17 ERPHow to do quick user assign in kanban in Odoo 17 ERP
How to do quick user assign in kanban in Odoo 17 ERPCeline George
 
Influencing policy (training slides from Fast Track Impact)
Influencing policy (training slides from Fast Track Impact)Influencing policy (training slides from Fast Track Impact)
Influencing policy (training slides from Fast Track Impact)Mark Reed
 
Concurrency Control in Database Management system
Concurrency Control in Database Management systemConcurrency Control in Database Management system
Concurrency Control in Database Management systemChristalin Nelson
 
GRADE 4 - SUMMATIVE TEST QUARTER 4 ALL SUBJECTS
GRADE 4 - SUMMATIVE TEST QUARTER 4 ALL SUBJECTSGRADE 4 - SUMMATIVE TEST QUARTER 4 ALL SUBJECTS
GRADE 4 - SUMMATIVE TEST QUARTER 4 ALL SUBJECTSJoshuaGantuangco2
 
Virtual-Orientation-on-the-Administration-of-NATG12-NATG6-and-ELLNA.pdf
Virtual-Orientation-on-the-Administration-of-NATG12-NATG6-and-ELLNA.pdfVirtual-Orientation-on-the-Administration-of-NATG12-NATG6-and-ELLNA.pdf
Virtual-Orientation-on-the-Administration-of-NATG12-NATG6-and-ELLNA.pdfErwinPantujan2
 
Integumentary System SMP B. Pharm Sem I.ppt
Integumentary System SMP B. Pharm Sem I.pptIntegumentary System SMP B. Pharm Sem I.ppt
Integumentary System SMP B. Pharm Sem I.pptshraddhaparab530
 
Activity 2-unit 2-update 2024. English translation
Activity 2-unit 2-update 2024. English translationActivity 2-unit 2-update 2024. English translation
Activity 2-unit 2-update 2024. English translationRosabel UA
 
ROLES IN A STAGE PRODUCTION in arts.pptx
ROLES IN A STAGE PRODUCTION in arts.pptxROLES IN A STAGE PRODUCTION in arts.pptx
ROLES IN A STAGE PRODUCTION in arts.pptxVanesaIglesias10
 
TEACHER REFLECTION FORM (NEW SET........).docx
TEACHER REFLECTION FORM (NEW SET........).docxTEACHER REFLECTION FORM (NEW SET........).docx
TEACHER REFLECTION FORM (NEW SET........).docxruthvilladarez
 
Active Learning Strategies (in short ALS).pdf
Active Learning Strategies (in short ALS).pdfActive Learning Strategies (in short ALS).pdf
Active Learning Strategies (in short ALS).pdfPatidar M
 
Expanded definition: technical and operational
Expanded definition: technical and operationalExpanded definition: technical and operational
Expanded definition: technical and operationalssuser3e220a
 
How to Add Barcode on PDF Report in Odoo 17
How to Add Barcode on PDF Report in Odoo 17How to Add Barcode on PDF Report in Odoo 17
How to Add Barcode on PDF Report in Odoo 17Celine George
 
USPS® Forced Meter Migration - How to Know if Your Postage Meter Will Soon be...
USPS® Forced Meter Migration - How to Know if Your Postage Meter Will Soon be...USPS® Forced Meter Migration - How to Know if Your Postage Meter Will Soon be...
USPS® Forced Meter Migration - How to Know if Your Postage Meter Will Soon be...Postal Advocate Inc.
 
Presentation Activity 2. Unit 3 transv.pptx
Presentation Activity 2. Unit 3 transv.pptxPresentation Activity 2. Unit 3 transv.pptx
Presentation Activity 2. Unit 3 transv.pptxRosabel UA
 
4.16.24 21st Century Movements for Black Lives.pptx
4.16.24 21st Century Movements for Black Lives.pptx4.16.24 21st Century Movements for Black Lives.pptx
4.16.24 21st Century Movements for Black Lives.pptxmary850239
 
Keynote by Prof. Wurzer at Nordex about IP-design
Keynote by Prof. Wurzer at Nordex about IP-designKeynote by Prof. Wurzer at Nordex about IP-design
Keynote by Prof. Wurzer at Nordex about IP-designMIPLM
 

Último (20)

Paradigm shift in nursing research by RS MEHTA
Paradigm shift in nursing research by RS MEHTAParadigm shift in nursing research by RS MEHTA
Paradigm shift in nursing research by RS MEHTA
 
How to do quick user assign in kanban in Odoo 17 ERP
How to do quick user assign in kanban in Odoo 17 ERPHow to do quick user assign in kanban in Odoo 17 ERP
How to do quick user assign in kanban in Odoo 17 ERP
 
FINALS_OF_LEFT_ON_C'N_EL_DORADO_2024.pptx
FINALS_OF_LEFT_ON_C'N_EL_DORADO_2024.pptxFINALS_OF_LEFT_ON_C'N_EL_DORADO_2024.pptx
FINALS_OF_LEFT_ON_C'N_EL_DORADO_2024.pptx
 
Influencing policy (training slides from Fast Track Impact)
Influencing policy (training slides from Fast Track Impact)Influencing policy (training slides from Fast Track Impact)
Influencing policy (training slides from Fast Track Impact)
 
Concurrency Control in Database Management system
Concurrency Control in Database Management systemConcurrency Control in Database Management system
Concurrency Control in Database Management system
 
GRADE 4 - SUMMATIVE TEST QUARTER 4 ALL SUBJECTS
GRADE 4 - SUMMATIVE TEST QUARTER 4 ALL SUBJECTSGRADE 4 - SUMMATIVE TEST QUARTER 4 ALL SUBJECTS
GRADE 4 - SUMMATIVE TEST QUARTER 4 ALL SUBJECTS
 
LEFT_ON_C'N_ PRELIMS_EL_DORADO_2024.pptx
LEFT_ON_C'N_ PRELIMS_EL_DORADO_2024.pptxLEFT_ON_C'N_ PRELIMS_EL_DORADO_2024.pptx
LEFT_ON_C'N_ PRELIMS_EL_DORADO_2024.pptx
 
Virtual-Orientation-on-the-Administration-of-NATG12-NATG6-and-ELLNA.pdf
Virtual-Orientation-on-the-Administration-of-NATG12-NATG6-and-ELLNA.pdfVirtual-Orientation-on-the-Administration-of-NATG12-NATG6-and-ELLNA.pdf
Virtual-Orientation-on-the-Administration-of-NATG12-NATG6-and-ELLNA.pdf
 
Integumentary System SMP B. Pharm Sem I.ppt
Integumentary System SMP B. Pharm Sem I.pptIntegumentary System SMP B. Pharm Sem I.ppt
Integumentary System SMP B. Pharm Sem I.ppt
 
YOUVE GOT EMAIL_FINALS_EL_DORADO_2024.pptx
YOUVE GOT EMAIL_FINALS_EL_DORADO_2024.pptxYOUVE GOT EMAIL_FINALS_EL_DORADO_2024.pptx
YOUVE GOT EMAIL_FINALS_EL_DORADO_2024.pptx
 
Activity 2-unit 2-update 2024. English translation
Activity 2-unit 2-update 2024. English translationActivity 2-unit 2-update 2024. English translation
Activity 2-unit 2-update 2024. English translation
 
ROLES IN A STAGE PRODUCTION in arts.pptx
ROLES IN A STAGE PRODUCTION in arts.pptxROLES IN A STAGE PRODUCTION in arts.pptx
ROLES IN A STAGE PRODUCTION in arts.pptx
 
TEACHER REFLECTION FORM (NEW SET........).docx
TEACHER REFLECTION FORM (NEW SET........).docxTEACHER REFLECTION FORM (NEW SET........).docx
TEACHER REFLECTION FORM (NEW SET........).docx
 
Active Learning Strategies (in short ALS).pdf
Active Learning Strategies (in short ALS).pdfActive Learning Strategies (in short ALS).pdf
Active Learning Strategies (in short ALS).pdf
 
Expanded definition: technical and operational
Expanded definition: technical and operationalExpanded definition: technical and operational
Expanded definition: technical and operational
 
How to Add Barcode on PDF Report in Odoo 17
How to Add Barcode on PDF Report in Odoo 17How to Add Barcode on PDF Report in Odoo 17
How to Add Barcode on PDF Report in Odoo 17
 
USPS® Forced Meter Migration - How to Know if Your Postage Meter Will Soon be...
USPS® Forced Meter Migration - How to Know if Your Postage Meter Will Soon be...USPS® Forced Meter Migration - How to Know if Your Postage Meter Will Soon be...
USPS® Forced Meter Migration - How to Know if Your Postage Meter Will Soon be...
 
Presentation Activity 2. Unit 3 transv.pptx
Presentation Activity 2. Unit 3 transv.pptxPresentation Activity 2. Unit 3 transv.pptx
Presentation Activity 2. Unit 3 transv.pptx
 
4.16.24 21st Century Movements for Black Lives.pptx
4.16.24 21st Century Movements for Black Lives.pptx4.16.24 21st Century Movements for Black Lives.pptx
4.16.24 21st Century Movements for Black Lives.pptx
 
Keynote by Prof. Wurzer at Nordex about IP-design
Keynote by Prof. Wurzer at Nordex about IP-designKeynote by Prof. Wurzer at Nordex about IP-design
Keynote by Prof. Wurzer at Nordex about IP-design
 

Ethics and impact of internet research

  • 1. WK 2 DQ 1 Read the journal article “The Ethics of Internet Research” (Williams, 2012) and this week’s lecture. In your own words, provide a summary of the article and add your own thoughts on how the Internet can affect the research process, including, but not limited to, ethics concerns. Reference Williams, S. G. (2012). The Ethics of Internet Research. Online Journal Of Nursing Informatics, 16(2), 38-48. Week Two Lecture Business Research Methods and Tools Week 2: Research ethics and research design Hypothesis testing This week, you’ll learn more about the building blocks of business research. Last week’s readings and guidance introduced you to the concept of hypotheses and research questions. Let’s go into hypothesis testing a bit further. Let’s reconsider last week’s sample research question: “Why are some of Ashford University’s students not successful in school?” Assume that Ashford’s management noticed that not all students are as successful as they would like them to be: some students fail courses, others drop out, and so on. This is considered the problem they would like to solve with the research. After some background evaluation, the administration develops a hypothesis about the problem and the question: “Ashford students don’t succeed when they have old computers.” The hypothesis states the problem (lack of student success) and an “educated guess” about why the problem is
  • 2. happening (students have old computers). In the research, Ashford’s administrators need to operationalize the study and test the hypothesis; this means they need to do the research to find out whether their hypothesis is correct. They could study it by sending a survey to students in order to find out how old their computer is. They could give a new computer to some of the students with an old computer, and they could not give a new computer to students with an old computer. Then, the researchers could observe whether there is a difference between the old-computer students and the new- computer students. In this study, the “null hypothesis” would be: “There is no statistically significant difference between the success of students with old computers and students with new computers.” If the study found there is, in fact, no difference in the success of the two groups, the researchers would fail to reject the null hypothesis. If there is a difference between the two groups, the researchers would reject the null hypothesis. The process of collecting data to observe differences might be new to you. Remember that if you are not collecting data to answer a research question, you are not doing original research. You might have thought previously that if you write a paper in which you summarize what other researchers have done, then you are “doing research.” That’s not true in this class. In business research, you go beyond summarizing others’ work; you’re making observations from data that are your own. Research ethics It’s important to make sure that whatever research you do that involves people, or data from or about them, is conducted ethically. If research is ethical, it means (among other things) that the researchers are protecting the privacy of the
  • 3. participants and any research data collected about them. In business settings, companies conduct research all the time to learn how to serve customers better, how to increase profits, and so on. If you surveyed your customers about their experience in your store using an online survey, it wouldn’t be ethical to force them to provide their names and addresses. They might choose to provide their names and contact information if they wanted you to follow up with them about a negative experience in the store, but to protect their privacy, you should not demand that information. In university settings, ethics boards (also called Institutional Review Boards or IRBs) review the plans for all the studies that involve human participants, such as people who complete surveys or participate in interviews. The IRB’s main objective is to ensure the safety, privacy, and confidentiality of participants. You can read about Ashford’s IRB at http://www.ashford.edu/about/institutional-review-board.htm. For viewing: Ty, R. (2009, June 16). Types of research & research designs [Video file]. Retrieved from https://www.youtube.com/watch?v=49_u-pXwx7g Marianne102. (2009, December 8). Unethical research methods [Video file]. Retrieved from https://www.youtube.com/watch?v=fmEDdVEwkHc WK 2 DQ 2 Google’s business model includes state-of-the art research. Pick a research study that Google’s researchers have done from their list of Research Areas & Publications (2014). What do you think about this research? Find details about related research to support your argument. Cite the studies in your post, and document it in APA style as outlined in the Ashford Writing
  • 4. Center. Google. (2014). Research areas & publications. Retrieved from http://research.google.com/pubs/papers.html Text · Landrum, R. E. (2014). Research methods for business: Tools and applications. San Diego, CA: Bridgepoint Education, Inc. 01CH_Landrum_Bus iness.pdf 1 1The Business of Business Research © Adrian Weinbrecht/cultura/Corbis Learning Objectives After reading this chapter, you should be able to: • Describe the importance of decision-making skills and how studying business research methods allows students to hone those skills. • Place business research in the context of scientific research.
  • 5. • Explain the differences between quantitative and qualitative research approaches. • Communicate the criteria used to evaluate scientific/business theories. • Explain the benefits of systematically following a business research approach, including the proper presentation of data, avoiding plagiarism, and being an educated consumer of research. co-photo co-intro co-cn co-box co-cr co-ct CO_CRD CT CN CO_H1 CO_TX CO_NL Lan81479_01_c01_001-032.indd 1 5/22/14 11:34 AM
  • 6. Introduction Pre-Test 1. The application of scientific principles to gather data for making business decisions is called: a. case studies. b. business data analysis. c. costs versus benefits. d. business research. 2. Common sense is one form of which of the following classic “ways of knowing”? a. tenacity b. intuition c. authority d. mysticism 3. When answering research questions, quantitative research offers more insight than qualitative research does. a. true b. false 4. Theories that can be tested empirically are said to have __________, while theories that do not contradict themselves have __________. a. intersubjective testability; internal consistency b. subsumptive power; heuristic value c. internal consistency; modifiability d. heuristic value; communicability
  • 7. 5. Unintentional plagiarism caused by not understanding the rules for citation is more acceptable than intentional plagiarism. a. true b. false Answers 1. d. business research. The correct answer can be found in Section 1.1. 2. b. intuition. The correct answer can be found in Section 1.2. 3. b. false. The correct answer can be found in Section 1.3. 4. a. intersubjective testability; internal consistency. The correct answer can be found in Section 1.4. 5. b. false. The correct answer can be found in Section 1.5. Introduction If you have ever used Google Maps (or other map/navigation apps), you know that there are multiple types of views, such as street views, satellite views, and so on. A user can zoom out for the big picture or zoom in to see finer details. This chapter is akin to this navigation process, but with business research methods rather than map locations. Understanding big picture ideas like skills, critical thinking, science, and theories is an important motivator and foundational piece for the details that will come later, and some of those details are previewed photo-caption photo-box-right-thin
  • 8. photo box-1 BX1_H1 BX_TX PT PT_NLF PT_NL PT_ANS PT_ANS_NLF PT_ANS_NL PT_ANS_NLL sec_t kt i bi Lan81479_01_c01_001-032.indd 2 5/22/14 11:34 AM Section 1.1Skills for a 21st-Century Worker in this chapter as tools (presenting data visually, avoiding
  • 9. plagiarism, and being a smart con- sumer of research). This chapter presents conceptual scaffolding by which more detailed and finer-grained business research methodologies will be examined. With an understanding of the intended destination, setting the foundation in this chapter will help when the future details become more complex. 1.1 Skills for a 21st-Century Worker Our lives are consumed by decision making. You can think about this from a daily perspec- tive, career perspective, lifetime perspective, and so on. Think about the number of decisions you have made today, including what time to wake up, what clothes to wear, what to eat for breakfast, and so on. These are routine decisions that you make, probably without much thought. You made a decision to continue your education to better your life and enhance your career; this probably commanded more consideration than your typical breakfast choice. Some decisions require more thought—more research, more data—because the stakes are higher. The availability of data in today’s world makes decision making all the more compli- cated. In an attempt to understand just how much information Americans consume, using multiple approaches and data sources, experts have estimated that the average person con- sumes information almost 12 hours a day (Bohn & Short, 2009). This is about 100,500 words per day on average, or 34 gigabytes of information per day on average. In the business world, decisions must be made about whether the data needed already exists, or if additional efforts
  • 10. should be expended to gather new data. Decision making is at the heart of business research. Business research involves the appli- cation of scientific principles to gather relevant data to aid in decision making. Businesses obtain and analyze data in order to manage the company; that data might involve financials, consumer feedback, market analysis, or product research (Miranda, 2013). Business research is the story of scientific research, with specific applications and tools for the workplace and all the aspects of the business world. At first blush it may seem that conducting research is always preferred, but there are indicators that should be considered when making this deci- sion (Zikmund, 1994). These key indicators include: 1. Time—is there enough time to allow for the appropriate application of business research methods, or is the decision needed so quickly as to prevent having the time for adequate research? 2. Data availability—if the data are readily available in a useable form, then business research is facilitated; if not readily available, then the cost of gathering that data (financial cost, time constraints, person-power) must be considered. 3. Importance—decisions that impact the organization greatly or have high risk may warrant more research attention in comparison to daily business decisions; con- ducting research on every decision would be tedious and
  • 11. unwieldy. 4. Costs versus benefits—for any type of business activity, there are costs (of time, of resources, of expertise, and so on); will the knowledge gained from research be worth the investment, will the decision quality improve, and is the investment of resources into business research the best investment of those collective efforts? Lan81479_01_c01_001-032.indd 3 5/22/14 11:34 AM Section 1.1Skills for a 21st-Century Worker For a quick comparison of the advantages and disadvantages of scientific versus nonscientific approaches to business research, see Table 1.1. Table 1.1: Advantages and disadvantages to scientific versus nonscientific business research Business Research Approach Advantages Disadvantages Scientific Methods are logical, and measured outcomes can be replicated by others; greater confidence in the outcomes due to objectivity. The entire story may not be captured due to the imprecise nature of mea- suring behavior; likely to be able to
  • 12. describe behaviors, but not to under- stand the cause of the behaviors. Nonscientific Case studies and anecdotes are vivid and descriptive, allowing researchers to seek better understanding of motiva- tors and causes; can help answer “why” questions. The results are often open to ques- tion with case studies and anecdotes because of their subjectivity. If someone else were to review the same materials, reliable outcomes may be challenging to find. Source: Data from Johnston, K. (2013). Scientific vs. unscientific methods in business research. Demand Media, Inc. Retrieved from http://www.ehow.com/info_8512344_scientific-unscientific- methods-business-research.html Just as business research can be seen as a specialized approach of scientific research, the skills gained by learning about and applying business research are complementary to the skills neces- sary for workplace success in the 21st century. There are a myriad of organizations, think tanks, and government agencies that have offered suggestions about the key skills and abilities neces- sary, and there is some overlap in the skills provided. Two exemplar lists are provided below; one list is from the Partnership for 21st Century Skills (2009) and the other from a recent Gallup (2013) poll conducted on behalf of Microsoft® and the Pearson Foundation.
  • 13. Partnership for 21st Century Skills (2009) • Core Subjects and 21st Century Themes • Core Subjects: English/reading/language arts, world languages, arts, mathematics, economics, science, geography, history, government/civics • Themes: global awareness, financial/business/entrepreneurial literacy, civic literacy, health literacy, environmental literacy • Learning and Innovation Skills • Creativity and innovation, Critical thinking and Problem solving, Communication and collaboration • Information, Media, and Technology Skills • Information literacy, Media literacy, Information/Communications/Technology literacy • Life and Career Skills • Flexibility and adaptability, Initiative and self-direction, Social and cross-cultural skills, Productivity and accountability, Leadership and responsibility Source: Excerpted from Partnership for 21st Century Skills. (2009). P21 Framework Definitions. Retrieved from http://www.p21 .org/storage/documents/P21_Framework _Definitions.pdf
  • 14. Lan81479_01_c01_001-032.indd 4 5/22/14 11:34 AM http://www.ehow.com/info_8512344_scientific-unscientific- methods-business-research.html http://www.p21.org/storage/documents/P21_Framework_Definit ions.pdf http://www.p21.org/storage/documents/P21_Framework_Definit ions.pdf Section 1.2Business Research Is Scientific Research Gallup Poll (2013) • 21st Century Skills in Education • Technology • Collaboration • Knowledge construction • Skilled communication • Real-world application • Self-regulation • Problem-solving Source: Gallup, Inc. (2013). 21st Century Skills and the Workplace. Retrieved from http://www.gallup.com/strategicconsulting /162821/21st-century-skills-workplace.aspx Consider how you can practice these skills throughout this course, other courses, and in everyday life. Acquiring these types of skills can give you an added advantage, especially in a tight economy or when the competition increases for highly desirable jobs. Understanding and possessing the skills and abilities of a business researcher can help prepare for career
  • 15. transitions, including unexpected twists and turns. Thus, to launch into an exploration of business research, the story begins with an understanding of science, the scientific method, and a critical thinking approach. 1.2 Business Research Is Scientific Research The methodologies used by business researchers emerge from the basic and applied approaches of scientific researchers. Thus, the foundations of business research are the foundations of sci- ence. The benefits of a more scientific approach to business research are reaped when research- ers have a clearly defined goal, utilize neutral wording when using survey methodology, imple- ment research controls, use proper sampling, and strive for statistical significance (Knickelbine, 2013)—you’ll learn more about each of these topics throughout this text. The scientific story can be a long and complex one, but in this context the key ideas include how we know what we know, the basic assumptions and cautions of science, and the characteristics of critical thinking. How Do We Know What We Know? Scientist and logician Charles Peirce (1877) provided a framework for how we decide what we know and believe. That is, how do individuals come to know what they know? Are some methods of learning about the world better than others? Is the type of evidence used to estab- lish beliefs important? Peirce called this the “methods of fixing beliefs” and offered examples such as tenacity, authority, a priori logic, and science (Helmstadter, 1970). Reviewed here are the classic “ways of knowing.”
  • 16. Authority Gaining a greater understanding via authority can be an efficient method for learning. Authority figures are often experts or highly regarded sources. For example, recall your first introduction to business course. You probably had a thick textbook containing hundreds of Lan81479_01_c01_001-032.indd 5 5/22/14 11:34 AM http://www.gallup.com/strategicconsulting/162821/21st- century-skills-workplace.aspx http://www.gallup.com/strategicconsulting/162821/21st- century-skills-workplace.aspx Section 1.2Business Research Is Scientific Research pages, with hundreds of references cited. It would not be efficient for you to read all of those original sources, so your textbook author read those materials and extracted the relevant information. He or she provided a valuable service for you. The problem is that sometimes authority figures get it wrong and transmit incorrect informa- tion to us (Beins, 2005). And sometimes, because authority figures are often experts, they do not all agree and may change their minds. Occasionally, authority figures may use their status to mislead us, because throughout history, authority figures have not always had the greater good as their primary interest—this could be political figures, religious leaders, social activ- ists, and yes, even authors.
  • 17. Logic Logic can be a valuable tool in helping to understand behavior as well. Logic in this con- text means the ability to understand behavior through reasoning (i.e., philosophical logic). Scientists often make logical deductions about the world. For instance, consider the classic syllogism (Shirky, 2003): Humans are mortal. Greeks are human. Therefore, Greeks are mortal. In this syllogism, the first two premises are true, and as it happens, so is the conclusion. But sometimes our logic is flawed because humans do not always behave in logical ways (and syllo- gisms are often more complex than the example above). For example, a person could reason that: Truly exciting books are rare. Rare books are expensive. Therefore, truly exciting books are expensive. The premises are not necessarily completely true, although the “logic” of the syllogism does follow in the conclusion. Logic can be a helpful method of understanding the world around us, but there are flaws in this approach as well. Take, for example, the notion of inattentional blindness—the idea that a person might not “see” an event
  • 18. happening right in front of them (Simons & Chabris, 1999). In a series of classic “gorillas in our midst” studies, researchers determined that when participants were asked to count the number of passes made by a team in white jerseys, over half of the time they failed to see a gorilla move through the scene being viewed (for a YouTube example, see http://www.youtube.com/watch?v=vJG698U2Mvo). Sometimes our human limitations impact our ability to be completely logical. Lan81479_01_c01_001-032.indd 6 5/22/14 11:34 AM http://www.youtube.com/watch?v=vJG698U2Mvo Section 1.2Business Research Is Scientific Research Intuition Sometimes individuals “know” something through intuition, a gut feeling or hunch. This feel- ing does not come about through evidence; instead, one simply believes something to be true. Sometimes our gut is correct and sometimes not. Consider Figure 1.1. Imagine the movement of the ball out of the curved tube (Bloom & Weisberg, 2007)— will it follow the straight path of Option 1 or the curved path of Option 2? Many college students believe that the ball will follow the curved path (2), when that is not the case. Two types of intuition commonly described are common sense and mysticism (Salinas, n.d.). Common sense typically refers to the everyday decisions that we make when relying on our
  • 19. current store of knowledge, without adding more informational data. Part of the problem with common sense is that it changes over time, so that practices from 150 years ago (e.g., slavery) might have been common sense then but are no longer so today. Also, common sense is usually applied after the fact. That is, after the event has occurred, a person has an “I-knew-it-all-along” reaction. It is easy to be right after the fact. Another concern about common sense is that not everyone’s common sense can be right (Beins, 2005). For example, think about relationships and the saying “absence makes the heart grow fonder.” If you have been in a long-distance relationship, you may feel that there is some truth to that. But also think about the phrase “out of sight, out of mind.” This would not yield a positive prediction about your long-distance rela- tionship. Considering these two common sense ideas together (Salinas, n.d.), it seems improb- able that they could both be true at the same time. Thus, although common sense may be com- mon, it may not always make sense. Mysticism is a type of intuitive experience that occurs because a person experiences an altered state of consciousness, perhaps through meditation or chemical assistance (Salinas, n.d.). These can be profound experiences, but they are unique in that they cannot be repli- cated in a laboratory setting and are not typically predictable. This type of insight into human Figure 1.1: Which route? Rolling a ball through a curved tube Source: Adapted from Figure 1 (A and B) Alternative intuitions
  • 20. about the movement of a ball out of a curved tube. Adapted from Bloom, P., & Weisberg, D. S. (2007, May 18). Childhood origins of adult resistance to science. Science, 316, 996–997. doi:10.1126 /science.1133398 Lan81479_01_c01_001-032.indd 7 5/22/14 11:34 AM Section 1.2Business Research Is Scientific Research behavior may not be reliable because of the uniqueness and individuality of the experience. For example, Aunt Bertha may claim that she saw an alien spacecraft land in her backyard. You check her backyard and see no evidence of a landing. You speak to the neighbors and no one else saw or heard anything. Aunt Bertha’s unique experience is difficult to confirm; she does not think she is lying, but you might not know what to believe. Tenacity Sometimes individuals hold to certain beliefs about the world because they have tenacity, or persistence. People believe in ideas based on superstition or habit, and continue to believe because it has always been that way (e.g., the Earth is flat). For example, have you ever had a lucky pen or lucky shirt for test taking? Was your successful performance on that test due to your lucky pen, or you? Superstitions and habits are not always healthy or efficient, but understanding the tenacity of beliefs is important to consider as we study human behavior,
  • 21. especially when we are interested in behavior change, as business researchers often are. Science The hallmarks of science are observation and objectivity. Scientists have precise rules and procedures for gathering scientific data. Business researchers typically use a measurement approach, and those measurements may be qualitative (with words) or quantitative (with numbers). This scientific approach was summarized nicely in two statements made some time ago (McCall, 1939, p. 15): Whatever exists at all, exists in some amount. Anything that exists in some amount can be measured. Scientists strive to understand behavior without regard to personal beliefs, biases, attitudes, and emotions (Helmstadter, 1970). However, business researchers are human, so methods are built into our research to minimize the effect of our humanity on the outcomes of research studies. A limitation of science is that it is not a very good approach for understanding the rare, unique, once-in-a-lifetime phenomenon. We’ll discuss more on the cautions and limita- tions of science later in this chapter. Clearly, science is not the only approach by which to understand the world—we have discussed some of the other approaches (tenacity, logic, and so on). But a scientific approach allows for conclusions to be drawn with a certain amount of confidence. The values of science can be
  • 22. summarized as follows: • Science places high value on theories that have the largest explanatory power. If a theory can explain the outcomes of a great many hypotheses, it is highly useful. • Science values predictive power. The more we can predict future behavior based on scientific data, the more useful that data will be. • Science values fecundity—that is, fruitfulness (the generation of new ideas). If a theory can help us generate new ideas about the world, then it has value. Sometimes this characteristic is known as the heuristic value of a theory. Lan81479_01_c01_001-032.indd 8 5/22/14 11:34 AM Section 1.2Business Research Is Scientific Research • Science values open-mindedness. Critical thinking and open- mindedness are essen- tial tools for success in science. • Science values parsimony. When all else is held constant, scientists prefer simpler theories to more complex theories. • Scientists require logical thinking in their explanations. By making processes and results public, science and scientists must withstand public scrutiny and make cogent arguments for their conclusions.
  • 23. • Scientists value skepticism. Although anecdotal evidence may be memorable (and often entertaining), scientists want evidence that supports or refutes a claim (Smith & Scharmann, 1999). • Science is self-correcting. Through the sharing of methodology of business research studies, erroneous findings and mistakes can be identified and flaws in the literature can be corrected. That is, when busi- ness researchers publish studies in professional journals, the details of the study are “given away”—others are told about the participants, materials, and procedures used during the study. Thus, if another researcher finds the outcomes of a study to be unbelievable, that skep- tical researcher has the blueprint to replicate the study. Understanding the structure of how and why we do research will help you to become a bet- ter, more informed business researcher. So what is the scientific method? The word science comes from the Latin word scientia, meaning knowledge. But the word science has (at least) two different implications. First, science is a method of studying the world around us. Remem- ber learning the five-step scientific method in your grade school science class? This scientific method is the same one that is used today. The second implication for the word science involves the production of knowledge. This may seem redundant, but science produces scientific knowledge.
  • 24. Intuitively, you already know this. You may have seen a TV advertisement, news broadcast, magazine article, or an Internet blog that mentions a nonscientific survey. That disclaimer is added because scientific sur- vey results differ in method and outcome from nonscientific surveys. Why is that distinction important? Because knowledge gained through a scientific approach has different charac- teristics from knowledge gathered in other ways. For example, consensus is the basis for sci- entific knowledge. Business researchers make the results known publicly through scholarly articles, books, websites, conference presentations, white papers, technical reports, and so on. In addition, scientific conclusions are tentative and based on the best scientific data avail- able. Science will not always be the best method for gaining information. For now, it is impor- tant to note that science is both a method and a product. Assumptions and Cautions of Science Even though our approach throughout this text will be business research through a scientific lens, there are other methods by which to understand the world that were previously men- tioned. In fairness, although science is our preferred lens here, the scientific approach is not a perfect approach, and it makes sense to pause for a moment and think about the assumptions and cautions of science. Lan81479_01_c01_001-032.indd 9 5/22/14 11:34 AM
  • 25. Section 1.2Business Research Is Scientific Research Assumptions Two common assumptions of science are determinism and finite causation (Maxwell & Delaney, 2004; Underwood, 1957). To this traditional listing, add a third assumption of science—empirical evidence. The notion of determinism is fundamental for scientists to make sense of the world. Determinism posits that events that occur are lawful, or predict- able. Said another way, if all the causes were known for an event, that event would be com- pletely predictable. This view is summarized in three parts: (a) nature is understandable, (b) nature is uniform, and (c) events in nature have specific causes (Maxwell & Delaney, 2004). If you apply this to human behavior, it makes sense. When a person visits the doctor for an ailment and receives a prescription, he or she expects to resolve the ailment by tak- ing the prescription. That person already believes in cause and effect by believing that if the medication is taken, he or she will get better. Students may believe that this graduate-level course will help them become better business researchers. Although free will plays a role in our lives (Baumeister, 2008), scientists depend on this idea of determinism to help make sense of the world. If there were not causes and effects, then events and behaviors would be completely random. Thus, if attitudes about a particular hair care product are randomly formed, then why bother with advertising? This underlying belief in determinism is related to the second
  • 26. assumption of science—finite causation. Not only do scientists believe in cause and effect, but they also believe there are a finite (limited) number of causes for any effect or event, and that they are discoverable and understandable (Maxwell & Delaney, 2004; Underwood, 1957). Of course, a scientist’s challenge is to identify which causes lead to the effects and under what conditions those cause-and-effect relationships occur (Maxwell & Delaney, 2004). For business researchers, this is essentially the notion that research can make inroads to studying workplace outcomes, even if not every aspect of a particular behavior is perfectly understood. That is, business researchers do not have to completely understand leadership in large organizations in order to identify some best practices in developing leaders. The third underlying assumption of science is related to the type of knowledge it produces— empirical evidence. The evidence produced by scientific, research-based approaches is labeled “empirical” evidence, and at its best produces knowledge that is reliable and public. Reliability (that is, consistency in measurement) occurs in the form of self-correction because consensus is the foundation for scientific knowledge. In science, nothing is self-evident at first, and scientific claims must be supported. Knowledge is acquired through empirical (research- based) experience, and the claims of science are tentative, based on the best information cur- rently available. Thus, when business researchers publish in journals, these scientists provide empirical evidence upon which others can continue to build our
  • 27. understanding of how the world of business works. Cautions Although science is the primary lens used throughout this text, there are cautions and limi- tations to it, and a scientific approach is not a “magic bullet” that solves all problems and provides all-knowing insight. First, scientists deal in probabilities. Business researchers are empirical, and they gather and analyze data and draw conclusions from the data. These con- clusions should be thought of as tentative. Scientists acknowledge that their findings have a high probability of being correct, but with no guarantee. They do not prove anything; they only disprove incorrect hypotheses. We will discuss that topic further in a later chapter. Lan81479_01_c01_001-032.indd 10 5/22/14 11:34 AM Section 1.2Business Research Is Scientific Research Second, individuals are limited to what they understand about the world based on the phys- ical equipment possessed. They rely on eyes to see, ears to hear, and so on. Thus, humans are only as accurate and precise as these sensory systems and the tools used to amplify sensory perceptions. Third, science is limited to the investigation of public knowledge—the observable and quan- tifiable. Thus, science cannot answer questions about value
  • 28. (Fancher, 2004)—for example, which is more valuable: liberty or the pursuit of happiness? These are opinion questions that individuals must answer—science is not able to provide the “right” answer, although scien- tists can conduct polls and determine prevailing beliefs. Related to questions of value, science is ill-equipped to answer questions of morality. Questions like “is capital punishment wrong?” or “does life begin at conception or birth?” are important questions, but they are not good questions for science if you want the “right” answer. Science does not tell us what is right or wrong; we decide for ourselves what is right or wrong (Fancher, 2004). Finally, science is also limited to the study of the natural and physical world. It cannot answer questions about the supernatural (e.g., the occult, clairvoyance, witchcraft). The scientific approach does have both strengths and limitations. Critical Thinking and Its Characteristics The basis of all scientific approaches, including those of business research, is critical think- ing. Critical thinking is defined as a set of strategies designed to make us better consumers of information (Wade, 1990). Although every student may not become a business researcher, students are and will continue to be consumers of information. You consume information from your classes and school experiences, but you also consume information at the super- market, on the Internet, in front of the television, watching a YouTube video, and at the car dealership. Critical thinking strategies outline an approach to
  • 29. consuming information that ideally helps a person to be less gullible. Critical thinking applies to all aspects of decision making, and decision making is central to the notion of business research. Note that critical in this sense does not mean to criticize, but it means to carefully and meticulously examine the points and perspectives of information presented. The following are characteristics of critical thinking: 1. Be skeptical, ask questions, and be willing to wonder. Critical thinkers are not fooled into believing everything they are told; they respectfully question the sources of information, and ask questions when they are confronted with details that do not make sense. Given your interest in business, asking “what if ” questions should come naturally. A person’s natural curiosity about behavior, combined with practiced and applied research skills, can provide the framework and tools to begin to scientifically answer questions of interest. 2. Define the problem and examine the definition of terms. Defining the problem (includ- ing the generation of a research question or hypothesis) is one of the first key steps of the scientific method. If business researchers want to understand or predict a behavior, they must be able to describe and define what that behavior is. So if a company wants to promote brand loyalty, what does that mean exactly? Does that mean that the consumer automatically buys the same product, or
  • 30. recommends the product to others, or criticizes competing products through social media channels? Lan81479_01_c01_001-032.indd 11 5/22/14 11:34 AM Section 1.2Business Research Is Scientific Research What, exactly, does “brand loyalty” mean? Scientists rely on operational definitions to understand precisely what is being measured. An operational definition is a clear, precise definition of the concept being studied—for example, how would you define “brand loyalty” in a way that is observable and quantifiable? Of course, business researchers will disagree on how to measure constructs/concepts, which makes the necessity of more research, reviewing the published literature, and multiple approaches all the more valuable. 3. Examine the evidence. A critical thinker looks for and examines the evidence on an issue. In science, one tends to rely on empirical evidence, but other types of evi- dence can be useful at times. For example, anecdotal evidence (evidence based on a personal story or experience) can be useful in thinking about problems to solve or generating plausible hypotheses, but it is generally not considered as scientific or empirical support for a hypothesis. Scientists prefer to examine data, and with
  • 31. anecdotal evidence, there are not data to observe; anecdotes are from stories told by a person. In examining the evidence of others, look for the standards of science to be met. What are those standards? For instance, researchers want evidence to be both reliable (consistent) and valid (meaningful). 4. Be cautious in drawing conclusions from evidence. Two scientists looking at the same evidence might draw different conclusions. Often, evidence is preliminary in nature and decisions should be delayed until more evidence is available. Furthermore, some types of evidence only support some types of conclusions. For example, evidence from correlational studies suggests a mathematical relationship between variables, and not a cause-and-effect relationship. There is usually a positive correlation between height and weight, but it is incorrect to conclude that height causes weight or that weight causes height. Evidence is preferable, but one needs to be cautious in the types of conclusions based on the types of evidence. 5. Consider alternative explanations for research evidence. One of our primary tasks is to consider alternative explanations in the interpretation of research findings. In fact, most researchers consider alternative explanations before conducting studies. For example, a researcher might be interested in the relationship between the use of social media and buyers’ favorability toward a new product. What if it was found
  • 32. that the more time spent on Facebook, the less favorable the buyer was toward a new product? The task of the researcher is to consider alternative explanations that might account for the pattern of results. 6. Examine biases and assumptions. Critical thinkers must examine their own biases and assumptions as well as those of others. Information comes to us from a source, and this source usually has a certain slant or angle (think about managers, employ- ees, and competitors as possible examples). That is, the messages we receive are sent for a purpose, oftentimes to influence our thinking or behavior, or to change our attitudes. It is also important to remember that people are not always impartial, even when they think they are. 7. Avoid emotional reasoning as a substitute for logical reasoning. Emotions can some- times cloud our decision-making skills, and the available evidence is not often utilized fully when emotions are peaking. Sometimes one gets caught in the trap of believing that “since I feel this way, it must be true.” A person may focus too much on one element of the situation, without gaining the perspective to understand the multiple sides of an issue. Feelings and emotions are important, but they should not be substituted for careful examination of the evidence. Lan81479_01_c01_001-032.indd 12 5/22/14 11:34 AM
  • 33. Section 1.3Quantitative Versus Qualitative Approaches to Research 8. Try not to oversimplify or overgeneralize. We live in a complicated world, and it is rare that one can condense an important issue down to one accurate generalization. Oversimplifications and overgeneralizations are mental shortcuts that help orga- nize and understand the world, and help take a break from critical thinking. Some of our prejudices and stereotypes are based on unfair overgeneralizations. Living in a complicated society dictates that complicated solutions must be generated; sim- plistic either/or thinking usually does not work well. Although there are times when individuals simplify and generalize for themselves and others, trying to force the complexity of the world into neat cubbyholes leaves individuals with an oversimpli- fied view that is often not that accurate. 9. Tolerate uncertainty. Science is based on tentative answers based on the best evi- dence available at the time. Key in on the phrase at the time. Given the reliance on evidence, the critical thinker may change positions on a topic due to personal experience or new evidence. In the scientific community, new evidence emerges frequently. When evidence and beliefs change, uncertainty is present. It is easy to become cynical and not believe in anything because evidence
  • 34. changes over time. The critical thinker must examine the evidence looking for alternative explanations, and if a different conclusion is warranted, a change of opinion is necessary. Our ability to tolerate uncertainty suggests being open-minded to change yet still applying the rigorous standards of critical thinking. The desire to take a scientific approach, and to be a critical thinker, involves the collection and analysis of data. Much of the remainder of this text is devoted to these key topics, but for now, think about an important consideration—will your data be quantitative, qualitative, or both? 1.3 Quantitative Versus Qualitative Approaches to Research Quantitative research involves measurement with regard to a numerical data collection approach, and focuses on behaviors that can be quantified or counted. Qualitative research involves observations with regard to a verbal data collection approach, and focuses on people in natural settings and describing them using words (Cozby & Bates, 2012). For example, you might design a survey for your marketing colleagues to ask about the effec- tiveness of a recent campaign to look at innovative techniques of recruiting nurses for local hospitals. To ascertain effectiveness, a series of survey items are developed where nurses reply using an agreement scale from 1 = strongly disagree to 5 = strongly agree. At the end of the survey, however, two open-ended questions are also asked: (a) how do you think the infor-
  • 35. mation presented during the marketing campaign influenced you to take your new job at the hospital, and (b) what suggestions do you have for the next nurse recruitment campaign? The approach described here utilizes a quantitative approach using survey items and also a qualita- tive approach by looking at responses in the nurses’ own words. Both types of data collection can be insightful when answering research questions. See Figure 1.2 for one perspective on how quantitative and qualitative data can contribute to overall research conclusions. Lan81479_01_c01_001-032.indd 13 5/22/14 11:34 AM Analyzing Research Data: Research findings are the summarized results of data analysis. Quantitative • Data are mostly numerical • Analysis is statistical • Purpose is to describe and test Descriptive Statistics • Central tendency ◦ Mean ◦ Median ◦ Mode • Variability ◦ Range ◦ Variance ◦ Standard deviation • Correlation
  • 36. Inferential Statistics • Standard error • Confidence intervals • Tests of significance ◦ of correlation ◦ of difference between means Qualitative • Data are mostly verbal • Analysis is logico-inductive • Purpose is to discover patterns Quantitative Analysis (Statistical process: mathematical) Qualitative Analysis (Logico-inductive process: verbal) • Identify topics • Cluster topics into categories • Form categories into patterns • Make explanations from patterns • Use explanations to answer research questions Section 1.3Quantitative Versus Qualitative Approaches to Research Quantitative Research It is probably true that more researchers tend to be trained in quantitative approaches than qualitative approaches, as surmised by LeCompte, Preissle, and Tesch (1993). There are a variety of software programs available that can be used to analyze quantitative data; per-
  • 37. haps the most popular is IBM SPSS Statistics (originally known as the Statistical Package for the Social Sciences, or SPSS) (http://www- 01.ibm.com/software/analytics/spss/). Other options for analyzing numerical data include: • Microsoft Excel™ (office.microsoft.com/en-us/excel/) • R (www.r-project.org) • SAS® (www.sas.com) • Minitab (www.minitab.com) There are many more options for quantitative statistical analysis, and this is just a small sam- ple of the software available. Note that as with any complex software, the overarching impor- tance is user training; that is, if the user does not know how to use the software, then it would be easy to draw erroneous conclusions. Figure 1.2: Qualitative versus quantitative approaches to analyzing research data Source: Mertler, C. A., & Charles, C. M. (2011). Introduction to educational research (7th ed.). Boston, MA: Pearson. Reprinted by permission of Pearson Education, Inc., Upper Saddle River, NJ. Analyzing Research Data: Research findings are the summarized results of data analysis. Quantitative • Data are mostly numerical • Analysis is statistical • Purpose is to describe and test
  • 38. Descriptive Statistics • Central tendency ◦ Mean ◦ Median ◦ Mode • Variability ◦ Range ◦ Variance ◦ Standard deviation • Correlation Inferential Statistics • Standard error • Confidence intervals • Tests of significance ◦ of correlation ◦ of difference between means Qualitative • Data are mostly verbal • Analysis is logico-inductive • Purpose is to discover patterns Quantitative Analysis (Statistical process: mathematical) Qualitative Analysis (Logico-inductive process: verbal) • Identify topics • Cluster topics into categories • Form categories into patterns • Make explanations from patterns • Use explanations to answer research questions
  • 39. Lan81479_01_c01_001-032.indd 14 5/22/14 11:34 AM http://www-01.ibm.com/software/analytics/spss/ office.microsoft.com/en-us/excel/ http://www.r-project.org www.sas.com www.minitab.com Section 1.4How to Evaluate a Theory Qualitative Research Qualitative approaches are word based. They can be challenging, as words are typically more ambiguous than numbers and have multiple meanings, and to understand the precise nature of what is meant by words, the words before and after must also be considered (Miles & Huber- man, 1984). Just as there are a variety of computer software programs available for quantitative data analysis, the same is true for qualitative data analysis; a sampling is presented here: • NVivo (http://www.qsrinternational.com/products_nvivo.aspx) • QDA Miner (http://provalisresearch.com/products/qualitative- data-analysis -software/) • MAXQDA (http://www.maxqda.com/) • ATLAS.ti (http://www.atlasti.com/qualitative-data-analysis- softw.html). The challenge for the qualitative researcher is to make sense of verbal responses. Just as with quantitative methods, one of the overarching goals of qualitative data analysis is data reduc-
  • 40. tion; that is, the simplification of a large volume of data so that meaningful conclusions can be formulated. Even though this topic is frequently couched in the terminology of “quantitative versus qualitative” research, there is no need for the competitive “versus.” Both techniques are commonly used together, and they frequently complement one another; both approaches have strengths and limitations. Regardless of the approach, if you have adequately collected data with either method, research findings are yielded. But with these research findings in hand, what comes next? Business researchers use the data collected to make decisions, whether that be to support a theoretical idea or to determine how to proceed with a business plan to expand the company. Through the scientific lens of business research, what are the criteria that are important in evaluating whether a theory is good or not? 1.4 How to Evaluate a Theory Theories are an attempt to explain facts that are tested as research hypotheses, and theories are often evaluated by collecting data. However, there are some fundamental principles to be aware of regarding the general consideration of any theory. In business, theories are commonplace. They serve a number of useful functions in think- ing about meaningful patterns of behavior. First, tens of thousands of journal articles, which contribute to our knowledge of human behavior, are published each year, and theories help to organize these findings into more coherent groups of ideas. Second, theories often stimulate
  • 41. others to do research. A business researcher may set out to find evidence to support or refute a theory, but the theory may provide some motivation in this process. There are seven criteria to be used in evaluating theories, providing some basis for distinguishing between good theo- ries and not-so-good theories (Morris, 1985). The criteria are as follows: 1. Intersubjective testability/falsifiability. Theories possess intersubjective testability when they generate hypotheses that are testable from an empirical standpoint. That is, if a theory is falsifiable, evidence can be gathered to negate or deny the hypothesis. 2. Internal consistency. Often theories are complicated entities that have a number of stipulations in order to be accurately used. A theory with internal consistency does Lan81479_01_c01_001-032.indd 15 5/22/14 11:34 AM http://www.qsrinternational.com/products_nvivo.aspx http://provalisresearch.com/products/qualitative-data-analysis- software/ http://provalisresearch.com/products/qualitative-data-analysis- software/ http://www.maxqda.com/ http://www.atlasti.com/qualitative-data-analysis-softw.html Section 1.4How to Evaluate a Theory not have contradictions maintained within the body of the theory. Predictions made
  • 42. by one part of the theory should not be contradicted by other parts of the theory. In other words, there should be minimal contradictions in the expected outcomes when the theory is applied in a variety of situations. 3. Subsumptive power. A good theory has subsumptive power, which means that it can account for the results of prior studies while offering a theoretical framework. Later theories must be able to subsume (account for) the findings of earlier research studies. If a theory lacks this explanatory power, its benefits may be limited. New research that emerges needs to be able to place the context of the past into the pres- ent. In other words, new theories have to fit old data. 4. Parsimony. To say that a theory possesses parsimony means that it is simple yet complete. When a theory is said to be simple (not simplistic), it explains the events or phenomena of interest in the least complicated terms; sometimes you may hear of this idea as the principle of Occam’s razor. Occam’s razor is the notion that when there are multiple explanations available of varying complexity, scientists tend to prefer a simpler explanation to a more complex explanation. 5. Communicability. For a theory to be useful, it must be communicated in an under- standable fashion. This is easier said than done. You have probably read articles from business journals and found that they are difficult to read. Business uses its
  • 43. own terminology and style to communicate results from research studies. This may seem obvious, but if a theory is going to be influential, it must be easily understood. If your theory is not understandable and cannot be communicated effectively to oth- ers, how can anyone benefit from it? 6. Heuristic value. Probably one of the most important characteristics of a theory is its heuristic value, or its ability to motivate others to conduct research on the topic (also called fecundity). Often a theory can do poorly in a number of the other areas listed here, but if a theory has heuristic value, then even a poorly supported theory can have value. Sometimes a bad idea or negative beliefs can inspire good work. 7. Modifiability. The last characteristic of evaluating a theory is that of modifiability. In order for a theory to stand the test of time, it must be flexible and modifiable enough to incorporate the studies of the future as well as the past (subsumptive power). A theory that is rigid and narrow and based on very situation- specific evidence usually does not last long. When thinking about how managers motivate and lead employees, one approach divides managers into Theory X and Theory Y (Hawthorne, 2013). Managers with a Theory X manage- ment style think that workers lack ambition and must be properly motivated with incentives to improve. Managers with a Theory Y leadership style believe
  • 44. that employees are inherently motivated and assume self-responsibility for performance improvements. The belief is that those who believe in Theory X will be more authoritarian leaders, and those who believe in Theory Y will be more management-by-participation leaders. How might Theory X/Theory Y be thought about or considered on each of the criteria about how to evaluate a theory? • Intersubjective testability: Can we generate hypotheses from Theory X/Theory Y? Yes—for example, if Theory Y is correct, there should be less absenteeism at work because workers are intrinsically motivated to work compared to workers who lack ambition in the Theory X world. Lan81479_01_c01_001-032.indd 16 5/22/14 11:34 AM Section 1.5Using the Tools of Business Research • Internal consistency: It seems that the Theory X and Theory Y approaches are oppo- site approaches to a large extent, so that the predictions made by one theory should not be contradictory or confused with the other theory. • Subsumptive power: If this Theory X/Theory Y approach can also explain other management theories (such as systems theory or contingency theory), then Theory X/Theory Y would be said to have subsumptive power.
  • 45. • Parsimony: This theory is fairly straightforward and not very convoluted at all, so one might conclude that Theory X/Theory Y has good parsimony. • Communicability: Theory X/Theory Y is often described in easy-to-understand lan- guage, thus it would be well-rated in its communicability. • Heuristic value: If you are intrigued or encouraged to conduct research in order to support or refute Theory X/Theory Y, then the current theory has heuristic power. • Modifiability: If new outcomes over time lead to modifications of Theory X/Theory Y, but the predictions of the theory mostly remain to hold up, then the theory would be thought to have good modifiability. With the big picture concepts in place—ideas such as the philosophy of science, characteris- tics of critical thinking, and ideas about how to evaluate a theory—much of the remainder of this book addresses the “nuts and bolts” of doing business research. Those details involve the use of various methodologies and tools to achieve those goals. A brief introduction to some of the tools a business researcher uses is provided in the next section. 1.5 Using the Tools of Business Research Like most other complex endeavors, it takes a great deal of study and practice to become proficient as a business researcher, and many in the field would
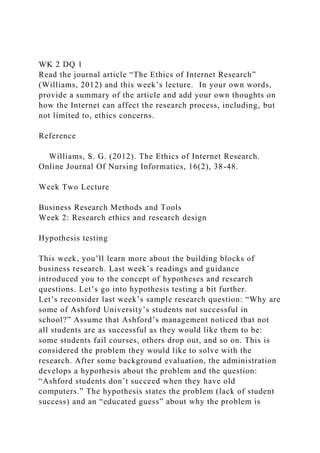
  • 46. tell you that it is part science, part art. This section provides a brief overview of three skills you must apply as a business researcher: presenting data fairly, avoiding plagiarism, and becoming a savvy consumer of business research. Presenting the Data: Tips for Graphs and Charts After gathering and analyzing data, selecting a graph, chart, or table can be an efficient way to display data to make an important point. In general, use graphics sparingly; they are compli- cated to prepare, and when used indiscriminately, they can confuse readers. These features should only be used to clarify a story. In general, it is easier to write text in a paragraph than to prepare a table or figure. But if there is a great deal of quantitative data, a well-prepared table can advance the discussion—see the examples included here about the average time required to start a business (in days) around the world. A well- placed bar graph showing a significant outcome can also help express results. When choosing where and when to use a graph, chart, or table, make sure that you present complicated results with clarity, precision, and efficiency (Tufte, 1983). For an excellent primer on current data visualization techniques (including tips on how to present data and presentation software options), see Yau (2013) and f lowingdata.com. Lan81479_01_c01_001-032.indd 17 5/22/14 11:34 AM http://flowingdata.com
  • 47. Year Quits Layoffs and Discharges 0 20112009200720052003 201320122010200820062004 4,000 3,500 3,000 2,500 2,000 1,500 1,000 500 T h o u s a n
  • 48. d s Section 1.5Using the Tools of Business Research It is suggested that clear, precise, and efficient graphs should: • show the data; • encourage the viewer to think about the content of the graph rather than focus on the graphic design; • avoid distortions; • present much data in a small space, making large datasets more coherent; • reveal the complexity of data on broad and fine levels; • serve a clear purpose (description, exploration, tabulation, or decoration); and • have close integration with the text that accompanies the graph (Tufte, 1983). For an example of a particularly well-designed graphic, see Figure 1.3 (Rees, 2012): One of the most important considerations when crafting a graphic is the message you want to convey about the data. You have flexibility in how your message comes across, just by making some important changes in displaying the data. Using data from the World Bank (2013), look at the data from 1993 to 2012 that depict the aver- age number of calendar days required to legally operate a business by country (see Table 1.2).
  • 49. Figure 1.3: Number of employee layoffs, discharges, and quits A well-designed graphic focuses on content, captures the complexity of change over time, and is readable and understandable. This graph shows the convergence of rising layoffs/discharges and falling quits near the start of 2008 running through the middle of 2009. Source: Based on Bureau of Labor Statistics, Job Openings and Labor Turnover Survey, January 17, 2014. Year Quits Layoffs and Discharges 0 20112009200720052003 201320122010200820062004 4,000 3,500 3,000 2,500 2,000 1,500 1,000 500
  • 50. T h o u s a n d s Lan81479_01_c01_001-032.indd 18 5/22/14 11:34 AM Year World 25 20112009200720052003 20122010200820062004 55 50 45 40 35
  • 51. 30 D a y s Section 1.5Using the Tools of Business Research Table 1.2: Average number of days required to start a business by country Country Year 2008 2009 2010 2011 2012 Argentina 31 26 26 26 26 Bulgaria 49 18 18 18 18 Canada 5 5 5 5 5 China 41 38 38 38 33 Greece 19 19 19 11 11 Mongolia 13 13 13 13 12 New Zealand 1 1 1 1 1 Spain 47 47 47 28 28 United States 6 6 6 6 6 Venezuela 141 141 141 141 144 Source: World Bank. (2013). Time required to start a business (days). Retrieved from http://data.worldbank.org/indicator /IC.REG.DURS/countries/1W?display=default The data in Table 1.2 tell a story; if you want to start a business quickly, where might you look? If it takes a long period of time to establish a new business, then perhaps a strategy in those coun- tries is to partner with an existing business. Finding, reading,
  • 52. understanding, and interpreting the data from business research can be extremely valuable. When looking at a figure of the world average over time (all countries in the database), it looks like what you see in Figure 1.4. Figure 1.4: Average number of days required to start a business by year Source: World Bank. (2013). Time required to start a business (days). Retrieved from http://data.worldbank.org/indicator/IC .REG.DURS/countries?display=graph. Reprinted with permission. Year World 25 20112009200720052003 20122010200820062004 55 50 45 40 35 30 D a y
  • 53. s Lan81479_01_c01_001-032.indd 19 5/22/14 11:34 AM http://data.worldbank.org/indicator/IC.REG.DURS/countries/1 W?display=default http://data.worldbank.org/indicator/IC.REG.DURS/countries/1 W?display=default http://data.worldbank.org/indicator/IC.REG.DURS/countries?dis play=graph http://data.worldbank.org/indicator/IC.REG.DURS/countries?dis play=graph Section 1.5Using the Tools of Business Research Of course, graphs are intended to communicate, but researchers need to be fair with the data. Try not to distort the graph to make a point—ideally, the data are interpreted by the reader and the reader is not influenced by misleading graphics. Here are some useful tips to consider when creating graphs: 1. The ordinate ( y-axis, vertical line) depicts the dependent variable (score, measure, or outcome), and this line should be about two-thirds the length of the abscissa (x-axis, horizontal line), which depicts the independent variable (factors that are controlled, manipulated, or arranged). For every inch up the ordinate, the abscissa should be 1.5 to 1.6 inches long. 2. Label both axes and provide a figure legend in the graph if necessary.
  • 54. 3. In its final form, the font size on the graph should be no smaller than 1/16th of an inch when printed. 4. The demands of your audience (e.g., your instructor or a professional journal) may dictate other procedures for creating acceptable graphs. When in doubt, consult the source/audience. Avoiding Plagiarism: Tips for Prevention Another distortion to be avoided throughout the research process is plagiarism. In this sec- tion, you will read about types of plagiarism, why it is wrong, and how to avoid it. Sometimes students become frustrated with the necessity for citation, and when they look at their completed research paper, they see citations everywhere. They wonder where the creativity is if their research paper is about other researchers’ ideas. The creativity in science is in the combination of ideas, or how the researcher puts them together. When a researcher shows trends in the literature or identifies common threads across different areas of business research, that is creative. Creativity also comes in the development of a new method to test a hypothesis, or an innovative approach to understanding an age- old problem. Researchers are creative, but they also value the intellectual property of others, which is why it is important to avoid plagiarism. Academic and professional writing should be clear and effective, as it is an important 21st-century skill, but it must also be accurate and
  • 55. honest (Roig, 2008). Essentially, plagiarism occurs when you borrow intellectual property without crediting the original source. There are two categories of plagiarism— intentional and unintentional. Intentional plagiarism means just what it sounds like—cheating on purpose. Oftentimes intentional plagiarism occurs due to student procrastination and panic, when the student is under a deadline to complete an assignment (Roig, 2008). Some examples of intentional pla- giarism include (a) downloading and turning in a paper from the Web; (b) including a graph or table from someone else’s work without proper citation; (c) copying phrases, sentences, or paragraphs from others’ work without using proper citation or quotation format; (d) para- phrasing or summarizing others’ work without citation; and (e) turning in one’s own previ- ously written work when prohibited to do so by the instructor (Harris, 2005). Unintentional plagiarism can occur through a number of methods. For example, you might not completely understand the rules for citation, you might be careless when taking notes, you might cite opinions from the Internet that are uninformed, or you might be sloppy in following the rules for citation (Harris, 2005). Just because you are unaware that you plagiarized does not mean it is acceptable to do so. The best protection you can have is to know, understand, and Lan81479_01_c01_001-032.indd 20 5/22/14 11:34 AM
  • 56. Section 1.5Using the Tools of Business Research apply the rules for proper citation. It has been suggested that you should cite a source any time information comes externally, or outside of your own knowledge (Harris, 2005). When deciding how to use someone else’s work in your own, you have three options: para- phrasing, summarizing, and quoting. Paraphrasing is to take someone’s ideas or words and put them into the writer’s own words, with the number of words used being roughly equiv- alent to the number of words from the original source. Summarizing is taking someone’s work and putting it into the writer’s own words, but with the result being shorter than the original (Harris, 2005). Quoting means using the original author’s exact words. For all three techniques, you must cite the work of the originators of the ideas. Instructors can help you distinguish between what does and does not need to be cited. Be careful with common knowledge, as it is not as common as you think. This is especially true in the business realm, because some individuals may think they are experts when they are not. Individuals often rely on anecdotes and personal experiences as common knowledge (“Since everyone I know has an iPhone, the iPhone must be the top- selling phone”). If the information you present as common knowledge truly is common knowledge, then it should not be diffi-
  • 57. cult to locate a source to support your claim. Although some might not think that plagiarizing is a big deal, it is. The following is a list of reasons why plagiarism is wrong (modified from Appleby, 2005, p. 9): 1. It is considered a criminal offense (i.e., the theft of intellectual property) and can result in fines and/or imprisonment. 2. It is academically dishonest and can lead to serious sanctions from the university. 3. It undermines the academic integrity and ethical atmosphere of the university. 4. It violates the mission of higher education to emphasize “a respect for knowledge.” 5. It involves a passive learning process that obstructs the acquisition and understand- ing of meaningful academic material. 6. It stalls or retards intellectual, moral, and social development. 7. It is contrary to the concept of critical thinking. 8. It promotes feelings of lowered self-esteem in those who believe they must practice it to survive academically. 9. It produces alumni whose inferior knowledge, abilities, and moral standards tarnish the public image of the college and lower the perceived value of a degree in the eyes of those who evaluate current students who are seeking employment or admission into graduate school.
  • 58. 10. It violates the code of ethics of professional societies that represent business. So what can you do to avoid plagiarism? By following a few rules, you can avoid plagiarizing others or being plagiarized yourself. • Save and print all drafts and notes—having these items will help support the origi- nality of your written work. • Photocopy or print all of your sources—and do not cite something that you have not actually read yourself. • Seek out the advice of your instructor and/or teaching assistants. If someone has been reviewing your work all semester, it will be easier for you to make the case that your work is actually your own. Lan81479_01_c01_001-032.indd 21 5/22/14 11:34 AM Section 1.5Using the Tools of Business Research • Protect your data and your computer passwords against theft. • Do not lend any paper to others—even if a student just wants to see what a business research paper looks like. • Report any theft immediately to the proper authorities, and in the case of your academic work, to your instructors (adapted from Harris, 2005).
  • 59. Plagiarism is a form of cheating with serious consequences. If one intends on cheating through college, why bother? Do most people want to have life- saving surgery performed by a surgeon who cheated his or her way through medical school? Would you want to consult a lawyer who cheated through law school, or a therapist who cheated through graduate school? Plagiarism and cheating have the potential to be harmful to others, but most of all, cheaters hurt themselves. Being a Savvy Consumer of Research When you write, you produce information; when you conduct business research, you are a producer of science and business research. Although you will read about many of the skills necessary to be a producer of research in this text, producers of research are also consumers of research. A student enrolled in a business research course may not be interested in con- ducting research for a career, but there are at least four reasons why knowledge of business methods is helpful (Emory, 1985): • a manager needs more information (either delegating the task or conducting new research); • a higher-level manager may delegate the need for business research to you; • understanding business research can help you be a savvy purchaser and consumer of business research and its outcomes; and
  • 60. • one’s interest in business research can change from a peripheral interest to a major focus, such as with business intelligence. In some cases, someone who adopts a business research approach to decision making may be more of a consumer than a producer of research. By developing a honed sense of critiquing, this skill can be utilized to examine any type of research finding or claim (thus, the savvy con- sumer of research). Some of the potential pitfalls in consuming research involve the appear- ance of illusory correlations and the natural bias to believe what one wants to believe. Being a good researcher or a savvy consumer of research necessitates a fair measure of quantitative reasoning skills. Some specific examples of types of inappropriate claims are presented in the following sections. Illusory Correlations and Confirmation Bias Illusory correlations and confirmation biases are two ways that common sense can mislead us. An illusory correlation is the tendency to believe that two variables are related when they are not. For example, a student may be convinced that her favorite sports team wins only when she watches. If she were to gather the data and look at her team’s win–loss record when she watches and when she does not watch, she is likely to find that her presence is not a deciding factor. Or perhaps another friend regularly reads the horoscope and sees this: “A big improvement is in the works, one that you may know nothing about, and today is the day
  • 61. for the big unveiling.” A job-seeking recent college graduate might spot some new listings for Lan81479_01_c01_001-032.indd 22 5/22/14 11:34 AM Section 1.5Using the Tools of Business Research interesting positions and decide the horoscope was right. When individuals look for an asso- ciation, they often find it. Yet careful researchers repeatedly fail to find evidence to support the accuracy of astrology (Dean & Kelly, 2003). Using quantitative reasoning helps individuals to see past illusory correlations. A confirmation bias is our tendency to “see” evidence that fits our beliefs and to ignore evidence that does not. This tendency is the main reason that we “see” illusory correlations. As an example, it is well documented that driving while trying to operate a cell phone is a dangerous distraction, but growing numbers of drivers are calling and texting (Richtel, 2009). Confirmation bias is the idea that if one believes it, it must be true—so when people think they are good drivers who can avoid accidents while using their cell phones, they may be under an illusion that can cause trouble for themselves and those around them. We can know what the right thing to do is and still ignore that information. Coincidence and Probability When business researchers understand the logic that underlies the occurrence of behaviors
  • 62. and events, this helps them make more accurate predictions about future behaviors. When attempting to understand and predict human behavior, it is helpful to know about coinci- dence and probability. Coincidence is when two random events occur close in time to one another, which lead us to believe the events are connected somehow. A person might observe that every time he attends a major league baseball game, his favorite team wins. In fact, our belief in coincidences leads to our beliefs in illusory correlations. If that pairing of events hap- pens enough times, one may think the events are related, but it is just a coincidence. Probability is the concept of how frequently an event occurs compared to how often the event could occur. If a person flips a quarter 100 times, it should come up with approximately 50 heads and 50 tails. Thus, the expected probability of getting heads is 50 out of 100, or 0.50, meaning half the time. Quantitative reasoning shows that coincidence is without a scientific basis. But probability does have a scientific basis. Take this example: A person may have won a state lottery four times, and on two of those occasions bought the winning ticket from the same store. People may start to believe that there is a lucky store, or others may ask this lot- tery winner to buy their lottery tickets, thinking that this person is very lucky. What are the odds of a single store having multiple payouts, or a single person winning the lottery multiple times? Well, probability and statistics can help us answer that question.
  • 63. When looking at a coincidence, one has to remember the full context, or the background. Sometimes we are not good at understanding the base rates of an event; we are surprised when a new business fails even though 56% of new businesses fail within their first 4 years (Ask.com, 2013). Statistics requires that we look at the background or base rate. Statistical rea- soning keeps us from declaring that some sequence of events is “a miracle” when the events can be explained from a statistical perspective (and not just relying on the convenient—and fun—concepts of luck and magic). A scientific approach demands a deeper investigation into explaining the events that occur around us. Lan81479_01_c01_001-032.indd 23 5/22/14 11:34 AM Section 1.5Using the Tools of Business Research Case Study: Participatory Oral Presentation of Research: The Data Walk Profile: Jolie Bain Pillsbury, Sherbrooke Consulting, Inc. Oral presentations must capture the intended audience’s interest and convey information in a way that allows those in the audience to be savvy consumers of research, despite different learn- ing styles, backgrounds, and perspectives on the topic presented. Techniques that engage learn- ers of all kinds (kinesthetic, auditory, and visual) can create more engagement than traditional chalk talks and slide decks.
  • 64. Dr. Jolie Pillsbury consults with governments, foundations, and other nonprofit organizations to develop strategy affecting public policy. Pillsbury developed the Data Walk oral presentation tool to immerse client groups in relevant information at the beginning of collaborative working ses- sions. “The Data Walk is designed to enable people to understand their role in relation to results, and to determine what and how they can contribute to that result—a foundation for working with others so that their contributions achieve more significant impact,” Pillsbury said. Pillsbury applied the Data Walk technique with the Maryland Department of Education to deliver a Leadership in Action Program (LAP) designed to achieve a big result: All children in Baltimore city entering school ready to learn. Describing the Data Walk for Baltimore City, Pillsbury set the stage: “Imagine that you are the superintendent of a school district, and the mayor and the gover- nor have invited you and about 30 other leaders in your city to come together to work on improv- ing the number and percentage of children entering school ready to learn.” Attendees have come from the faith community and businesses, as well as divisions of local and state government and school administration. “While you are being given your nametags, you are also given a set of questions that probe your reactions to the data, and how you feel connected to the results,” Pillsbury continued. Instead of beginning the meeting with a welcome speech, the convener introduces you to two other attend-
  • 65. ees and directs you to 20 large displays of data about children entering school, arranged around the room. Pairs and trios walk and talk, exploring, discussing, and reacting to the data on the wall. The data selected and the style of presentation (charts, graphs, etc.) have been carefully chosen to accurately convey current statistics and trends in school readiness. “Some of the data is about the whole population, all the children in your city,” Pillsbury explained. “Some is comparative of subsets within that population—for example, by ethnicity, geography, or other factors, such as the success rate of a private day care provider compared to the public Head Start program in helping children be ready to learn.” When the groups have finished their Data Walk, partici- pants settle at a semi-circle of tables. Instead of the usual introductions by name and title, each describes his or her reaction to the data. “You are immediately immersed in a collaborative dialogue about all the different perspectives,” Pillsbury said. Based on that initial dialogue, the group begins developing an action plan, setting deadlines, and assigning accountability to make a measurable improve- ment in the results displayed along the Data Walk. © Monty Rakusen/cultura/Corbis (continued) Lan81479_01_c01_001-032.indd 24 5/22/14 11:34 AM Summary & Resources
  • 66. The Data Walk technique engages a group of consumers of research so that they have the full context to apply thestatistical information presented to them. By encouraging discussion right from the start, the process reduces the potential pitfalls of individuals’ falling for illusory cor- relations, natural biases, and misperceptions of coincidence and probability. By putting people in motion in a participatory activity, the technique achieves high engagement. Pillsbury’s Data Walks have achieved measurable success. “Data walks provide an opportunity for leaders to share very diverse perspectives from the view of public and nonprofit sector agencies and across disciplines,” said Pillsbury. Sources: Interview with Jolie Bain Pillsbury conducted February 8, 2013. Bain Pillsbury, Results Based Facilitation, Book Two, Advanced Skills, publication due in 2014. Summary & Resources Summary • Business research is a form of scientific research, and its ultimate goal is to provide reliable information/data that helps to inform decision making. The skills acquired during deep study of business research methods overlap nicely with many of the skills needed for success in the 21st-century workforce. • By utilizing a scientific approach, business researchers can systematically identify,
  • 67. formulate, and test hypotheses via the scientific method, allowing for firm scientific conclusions (but remembering the limitations and cautions of science). • Essentially, scientific thinking is a specialized form of critical thinking, and adhering to the suggestions about critical thinking can aid in better decision making, includ- ing in the context of business research and an educated citizenry. • Science-based tools can then be utilized to evaluate the applicability of data and resulting theories to specific business research scenarios. • The chapter concludes with a brief introduction to some of the tools of business research trade; tips about presenting visual data, avoiding plagiarism, and being a smart consumer of research. Understanding and applying these tools helps to develop a coherent set of skills that are desirable in the realm of business research methods. Those key aspects of good research practices are presented and summa- rized in Figure 1.5. Case Study: Participatory Oral Presentation of Research: The Data Walk (continued) Lan81479_01_c01_001-032.indd 25 5/22/14 11:34 AM Check (√) Good Business Research Characteristic
  • 68. Research problem is clearly identified. Researcher prepares a complete research proposal/protocol. Literature review is complete, with key terms defined. Methodology is described completely, including the sampling plan. Procedures for data collection are identified and appropriate. Ethical protections are in place for participants (e.g., individuals, organizations, clients). Recommendations are appropriate for both the methodology used and the resulting outcomes. Research limitations are clearly stated with objectivity, striving for accurate interpretations of data analysis outcomes. Comparisons are made between intended study design and actual outcomes, with limitations noted and the impact of these limitations detailed. Research findings are sufficiently detailed and thorough to meet the needs of decision makers, with an emphasis on sufficient data collection measures. Research outcomes are clearly articulated with words, tables, graphs, and/or figures.
  • 69. Research outcomes are presented in a logical fashion to meet the needs of the manager/organization in making the decision. Executive summary of the project and its outcomes are included. Data-based recommendations are congruent with the actual data analysis results. Researcher documents his/her credentials appropriately within the context of the report. Summary & Resources Post-Test 1. The application of scientific principles to gather data for making business decisions is called: a. case studies. b. business data analysis. c. costsversusbenefits. d. business research. 2. Compared to scientific research, nonscientific research has the advantage of: a. helping answer questions about motivation or its causes. b. using more logical methods. c. being more subjective and open to question. d. providinggreaterconfidenceintheoutcomesduetoobjectivity. 3. Common sense is one form of which of the following classic “ways of knowing”? a. tenacity
  • 70. b. intuition c. authority d. mysticism Figure 1.5: A checklist of good business research characteristics Source: Adapted from Cooper, D. R., & Schindler, P. S. (2008). Business research methods (10th ed.). Boston, MA: McGraw- Hill. Check (√) Good Business Research Characteristic Research problem is clearly identified. Researcher prepares a complete research proposal/protocol. Literature review is complete, with key terms defined. Methodology is described completely, including the sampling plan. Procedures for data collection are identified and appropriate. Ethical protections are in place for participants (e.g., individuals, organizations, clients). Recommendations are appropriate for both the methodology used and the resulting outcomes. Research limitations are clearly stated with objectivity, striving for accurate interpretations of data analysis outcomes. Comparisons are made between intended study design and actual outcomes,
  • 71. with limitations noted and the impact of these limitations detailed. Research findings are sufficiently detailed and thorough to meet the needs of decision makers, with an emphasis on sufficient data collection measures. Research outcomes are clearly articulated with words, tables, graphs, and/or figures. Research outcomes are presented in a logical fashion to meet the needs of the manager/organization in making the decision. Executive summary of the project and its outcomes are included. Data-based recommendations are congruent with the actual data analysis results. Researcher documents his/her credentials appropriately within the context of the report. Lan81479_01_c01_001-032.indd 26 5/22/14 11:34 AM Summary & Resources 4. What is critical thinking? a. a step-by-step process for undertaking business research b. anothernameforthescientificmethod c. amethodfordefiningaproblemandexaminingthedefinitionofterms d. a group of strategies for consuming information well
  • 72. 5. When answering research questions, quantitative research offers more insight than qualitative research does. a. true b. false 6. Which of the following accurately describes a difference between quantitative research and qualitative research? a. Quantitative research describes people in their natural settings, while qualitative research deals with behaviors that can be counted. b. Quantitative research is used to discover patterns, while the purpose of qualitative research is to test. c. Quantitative research uses numerical data, while qualitative research collects data verbally. d. Quantitative research uses explanations to answer research questions, while qualitative research is statistical. 7. Theories that can be tested empirically are said to have __________, while theories that do not contradict themselves have __________. a. intersubjective testability; internal consistency b. subsumptive power; heuristic value c. internalconsistency;modifiability d. heuristic value; communicability
  • 73. 8. Which criterion of theory evaluation explains why even a poorly supported theory can be useful? a. modifiability b. parsimony c. communicability d. heuristic value 9. Unintentional plagiarism caused by not understanding the rules for citation is more acceptable than intentional plagiarism. a. true b. false 10. The human tendency to disregard evidence that does not fit what we already believe is known as: a. confirmationbias. b. illusory correlation. c. coincidence bias. d. probability correlation. Lan81479_01_c01_001-032.indd 27 5/22/14 11:34 AM Summary & Resources Answers 1. d. business research. The correct answer can be found in Section 1.1. 2. a. helping answer questions about motivation or its causes. The correct answer can
  • 74. be found in Section 1.1. 3. b. intuition. The correct answer can be found in Section 1.2. 4. d. a group of strategies for consuming information well. The correct answer can be found in Section 1.2. 5. b. False. The correct answer can be found in Section 1.3. 6. c. Quantitative research uses numerical data, while qualitative research collects data verbally. The correct answer can be found in Section 1.3. 7. a. intersubjective testability; internal consistency. The correct answer can be found in Section 1.4. 8. d. heuristic value. The correct answer can be found in Section 1.4. 9. b. False. The correct answer can be found in Section 1.5. 10. a. confirmationbias.ThecorrectanswercanbefoundinSection1.5. Questions for Critical Thinking 1. Either as a businessperson or as a consumer, you have had experiences with the world of business. How do the ideas presented in this chapter fit with your current practices? Were there strategies presented here that you are excited to implement in your own life? Explain. Were there ideas presented that, although they make sense “in theory,” you doubt that you would ever implement or follow? Why not? 2. How much of the scientific method do you remember from
  • 75. your past? Many students are exposed to the tenets of the scientific method in grade school. Depending on your undergraduate education, your major, and how your professors were trained, you may or may not have had a heavy dose of the scientific method in the recent past. How well do your recollections map onto the materials presented in this chapter? Do you see the connections between a scientific approach and a business research methods approach? Explain why or why not. 3. Business inherently involves risk, and there are occasions when neither time nor resources will allow for thorough business research methods to be followed in order to yield information to assist in decision making. It has been said that faith is the belief in an idea in the absence of data. Are there some types of decisions where intuitions and “gut” feelings are enough to make business decisions? Explore this idea a bit—in what situations would you conduct your own business research (or hire someone to do so), compared to those business decisions where no additional research is neces- sary? Some managers tend to rely on their own experienced past—where might that approach lead a manager to poor decision making, and how might the application of business research method help? Lan81479_01_c01_001-032.indd 28 5/22/14 11:34 AM
  • 76. Summary & Resources Key Terms abscissa The x-axis or horizontal line/plane in a line graph. anecdotal evidence Evidence based on a personal story or experience that is gen- erally not considered to be scientific or empirical support for a hypothesis, but could contribute to hypothesis development. authority An expert or highly regarded individual consulted for his or her learned opinions. business research The application of sci- entific principles to gather relevant data that aids in business decision making. cause-and-effect relationship A direct relationship where an event occurs as a con- sequence of a previous event taking place. coincidence When two random events occur in close proximity of one another; because of this proximity a causal link is erroneously believed to exist. confirmation bias Individuals tend to seek out and believe evidence that is consistent with their already held beliefs. determinism The theory that all events
  • 77. are predictable and that if all causes were known for an event, that event would be completely predictable. Also known as the “lawfulness of nature.” empirical evidence Evidence produced by science. fecundity The generation of new ideas; fruitfulness. finite causation The concept that there are a limited number of causes for any effect or event, and that these causes are discoverable and understandable. heuristic value A theory’s ability to moti- vate others to conduct research on the topic and generate new ideas about the world. illusory correlation The tendency to believe that two variables or events are con- nected in a meaningful fashion when in fact there is no connection (akin to superstition). inattentional blindness Sometimes when asked to concentrate on the details of one situation, pertinent events that occur are not “seen” by the observer due to a lack of atten- tion or divided attention. intentional plagiarism Purposeful cheat- ing often due to procrastination and panic about assignment deadlines; not giving credit for ideas and work that has been pre- viously produced from other sources.
  • 78. internal consistency A characteristic of a theory that does not present contradictions within its body. intersubjective testability When a theory generates hypotheses that are testable from an empirical standpoint. intuition A person’s internal or “gut” feel- ing that a belief is true in the absence of empirical evidence. logic Understanding human behavior through reasoning, such as philosophical logic. modifiability The characteristic a theory has when it is flexible enough to incorporate stud- ies of the future as well as studies of the past. mysticism Types of beliefs that are typi- cally formed through unique and unpredict- able events that are difficult to recreate and study in a scientific context. Lan81479_01_c01_001-032.indd 29 5/22/14 11:34 AM Summary & Resources operational definitions Concise defini- tions that exhibit precisely what is being measured. ordinate The y-axis or vertical line/plane
  • 79. in a line graph. paraphrasing Translating the words of another into your own words, with the length of both statements about the same. parsimony A simpler, more conservative approach to deciding which theories to utilize. plagiarism Claiming the ideas of oth- ers as your own without providing proper attribution. probability The frequency of an event occurring in comparison to the frequency that an event could occur. qualitative research A variable/research approach where responses differ in kind or type and can be expressed in words. quantitative research A variable/research approach where responses differ in amount and are usually described by numbers. quoting The use of the exact words that the original author used. science A method of understanding events in the world based on the hallmarks of observation and objectivity, as well as the product of outcomes from application of the scientific method. scientific method A method of studying the world by observing and developing theo-
  • 80. ries through scientific hypotheses. skepticism A belief that persuasive evi- dence must be collected and evaluated prior to drawing conclusions about phenomena. subsumptive power The ability of a theory to account for the results of prior studies while offering a theoretical framework. summarizing Translating the words of another into your own words, but using fewer words in your new description. syllogism A philosophical statement involv- ing two premises and a conclusion in which some or all parts can be correct or incorrect. tenacity Persistently holding to a belief, often in the form of a superstition formed due to coincidence. uncertainty A lack of confidence in existing data or conclusions due to the emergence of new data or beliefs that may trigger a reex- amination of previously held beliefs. unintentional plagiarism Sloppiness or misunderstandings on the writer’s behalf that leads to the use of others’ ideas without proper attribution. values of science Outlined values that state: science places high value on theories that have the largest explanatory power; sci- ence values fecundity; science values open-
  • 81. mindedness; scientists require logical think- ing in their explanations; science values skepticism; and science is self-correcting. Lan81479_01_c01_001-032.indd 30 5/22/14 11:34 AM Summary & Resources Additional Resources • For a more complete description of 21st-century skills, see this resource. http://www.skills21.org/ • This is the homepage for the Journal of Business Research— browse recent journal article titles. http://www.journals.elsevier.com/journal-of-business-research/ • A brief article about the notion of “scientific proof.” http://www.psychologytoday.com/blog/the-scientific- fundamentalist/200811 /common-misconceptions-about-science-i-scientific-proof • A brief article about scientific versus unscientific methods in business research. http://smallbusiness.chron.com/scientific-vs-unscientific- methods-business -research-42828.html • An informative blog entry that discusses skills that entrepreneurs need. http://blogs.hbr.org/cs/2012/12/new_research_the_skills_that_m .html
  • 82. Lan81479_01_c01_001-032.indd 31 5/22/14 11:34 AM http://www.skills21.org/ http://www.journals.elsevier.com/journal-of-business-research/ http://www.psychologytoday.com/blog/the-scientific- fundamentalist/200811/common-misconceptions-about-science- i-scientific-proof http://www.psychologytoday.com/blog/the-scientific- fundamentalist/200811/common-misconceptions-about-science- i-scientific-proof http://smallbusiness.chron.com/scientific-vs-unscientific- methods-business-research-42828.html http://smallbusiness.chron.com/scientific-vs-unscientific- methods-business-research-42828.html http://blogs.hbr.org/cs/2012/12/new_research_the_skills_that_m .html Lan81479_01_c01_001-032.indd 32 5/22/14 11:34 AM 02CH_Landrum_Bus iness.pdf 33 2Finding and Reading Research: Turning Information Into Knowledge John Lamb/Digital Vision/Getty Images Learning Objectives After reading this chapter, you should be able to:
  • 83. • Identify and differentiate between three major types of research evidence. • Describe how to conduct a database search for relevant literature. • Understand how to read a research article and identify its key components. • Explain how to critique sources. • Differentiate the nuances between different types of data presented in research studies, realizing that the type and kind of data collected are related to the veracity of the conclusions drawn. co-photo co-intro co-cn co-box co-cr co-ct CO_CRD CT CN CO_H1
  • 84. CO_TX CO_NL Lan81479_02_c02_033-068.indd 33 5/22/14 11:35 AM Introduction Pre-Test 1. Which type of research is most useful when researchers know little about a phenomenon? a. relational research b. correlational research c. descriptive research d. causal research 2. In which section of a formal research paper is a literature review most often found? a. Introduction b. Method c. Results d. References 3. Because currency is essential to credibility, research studies more than 10 years old should not be cited. a. true b. false 4. Asking whether the independent and dependent variables are clearly defined is useful
  • 85. for critiquing which part of a research journal article? a. methodology b. thesis statement or hypothesis c. problem and purpose of the study d. analyses and results 5. The goal of review articles is to compare and evaluate published literature on a particular area. a. true b. false Answers 1. c. descriptive research. The correct answer can be found in Section 2.1. 2. a. introduction. The correct answer can be found in Section 2.2. 3. b. false. The correct answer can be found in Section 2.3. 4. a. methodology. The correct answer can be found in Section 2.4. 5. a. true. The correct answer can be found in Section 2.5. Introduction In a blog post, Lurie (2012) made the simple yet profound observation that information is free, and knowledge is not. That is, information is the raw data that exists in the world, and can only get a person so far. The valued commodity is knowledge, or the combined infor- mation and skills acquired through experience or education. The path from information to knowledge begins with the topics presented in this chapter. Another conceptualization of this issue is known as the DIKW hierarchy, which is shorthand for data-information-
  • 86. knowledge-wisdom (Rowley, 2007). Although the implicit assumption is often that data are used to create information, information is used to create knowledge, and knowledge is photo-caption photo-box-right-thin photo box-1 BX1_H1 BX_TX PT PT_NLF PT_NL PT_ANS PT_ANS_NLF PT_ANS_NL PT_ANS_NLL sec_t kt i