Introduction to Soil Mechanics
•
5 recomendaciones•325 vistas

Introduction to soil mechanics, examples of geotechnical engineering applications. Description of assemblage and individual particles, classification, etc. Soil types.

Recomendados
Recomendados
Más contenido relacionado
La actualidad más candente
La actualidad más candente (20)
Similar a Introduction to Soil Mechanics
Similar a Introduction to Soil Mechanics (20)
Más de AMIE(I) Study Circle
Más de AMIE(I) Study Circle (20)
Último
Último (20)
Introduction to Soil Mechanics
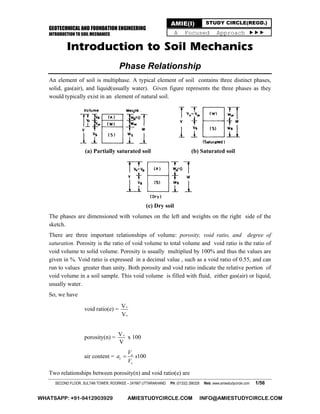
- 1. GEOTECHNICAL AND FOUNDATION ENGINEERING INTRODUCTION TO SOIL MECHANICS SECOND FLOOR, SULTAN TOWER, ROORKEE – 247667 UTTARAKHAND PH: (01332) 266328 Web: www.amiestudycircle.com 1/56 AMIE(I) STUDY CIRCLE(REGD.) A Focused Approach Introduction to Soil Mechanics Phase Relationship An element of soil is multiphase. A typical element of soil contains three distinct phases, solid, gas(air), and liquid(usually water). Given figure represents the three phases as they would typically exist in an element of natural soil. (a) Partially saturated soil (b) Saturated soil (c) Dry soil The phases are dimensioned with volumes on the left and weights on the right side of the sketch. There are three important relationships of volume: porosity, void ratio, and degree of saturation. Porosity is the ratio of void volume to total volume and void ratio is the ratio of void volume to solid volume. Porosity is usually multiplied by 100% and thus the values are given in %. Void ratio is expressed in a decimal value , such as a void ratio of 0.55, and can run to values greater than unity. Both porosity and void ratio indicate the relative portion of void volume in a soil sample. This void volume is filled with fluid, either gas(air) or liquid, usually water. So, we have void ratio(e) = v s V V porosity(n) = vV V x 100 air content = 100a c v V a x V Two relationships between porosity(n) and void ratio(e) are WHATSAPP: +91-9412903929 AMIESTUDYCIRCLE.COM INFO@AMIESTUDYCIRCLE.COM
- 2. GEOTECHNICAL AND FOUNDATION ENGINEERING INTRODUCTION TO SOIL MECHANICS SECOND FLOOR, SULTAN TOWER, ROORKEE – 247667 UTTARAKHAND PH: (01332) 266328 Web: www.amiestudycircle.com 2/56 AMIE(I) STUDY CIRCLE(REGD.) A Focused Approach n = e 1+ e Degree of saturation(S) = w v V V The degree of saturation indicates the percentage of the void volume which is filled with water. Thus, a value of S = 0 indicates a dry soil, S = 100% indicates a saturate soil, and a value between 0 and 100% indicates a partially saturated soil. The most useful relationship between phase weights is water content, which is the weight of water divided by the weight of solid in a soil element. Water content w = w s W W Ws is weight of solid in soil content. The bulk unit weight(γ) is the weight of entire soil element divided by the volume of entire element. Bulk density(or bulk unit weight or moist unit weight or total unit weight) t = W V = wG (1+ w) 1+ e Where G is specific gravity(unit weight per unit weight of water), w is water content (also referred to as “m” in few books) and γw (also written as rw) unit weight of water at 40 C. For all practical purposes γw is taken as 1 g/cc or 9.8 kN/m3 . The dry unit weight, often called dry density, is the weight of solid matter divided by the volume of the entire element. Dry density(dry unit weight) γd = s wW G V 1 e as w = 0 Void ratio e = wG S Saturated unit weight γsat = w(G + e) 1+ e (as e = wG because S = 1) Submerged(buoyant) unit weight w w sub sat w w (G e) (G 1) 1 e 1 e You should understand the meanings of these relationships, and add these terms to your active vocabulary. These relationships are basic to most computations in soil mechanics. WHATSAPP: +91-9412903929 AMIESTUDYCIRCLE.COM INFO@AMIESTUDYCIRCLE.COM
- 3. GEOTECHNICAL AND FOUNDATION ENGINEERING INTRODUCTION TO SOIL MECHANICS SECOND FLOOR, SULTAN TOWER, ROORKEE – 247667 UTTARAKHAND PH: (01332) 266328 Web: www.amiestudycircle.com 3/56 AMIE(I) STUDY CIRCLE(REGD.) A Focused Approach Example (AMIE S07, 10, W10, 11, 5 marks) Prove the relationship Se = wG Solution We know w v V S V And v s V e V Hence w v w v s s V V V Se x V V V Also we know w s W w W And s s w W G V Hence w s w w s s w s w s W W W V wG x W V V V Hence Se = wG Example (AMIE W08, 7 marks) Prove that w t (G Se) 1 e Solution w s ss w t s v v s s W W 1 WW WW V V V V V 1 V = s s W (1 w) V (1 e) [Ww/Ws = w and Vv/Vs = e] = w w Se G 1 G SeG 1 e 1 e Hence Proved WHATSAPP: +91-9412903929 AMIESTUDYCIRCLE.COM INFO@AMIESTUDYCIRCLE.COM
- 4. GEOTECHNICAL AND FOUNDATION ENGINEERING INTRODUCTION TO SOIL MECHANICS SECOND FLOOR, SULTAN TOWER, ROORKEE – 247667 UTTARAKHAND PH: (01332) 266328 Web: www.amiestudycircle.com 4/56 AMIE(I) STUDY CIRCLE(REGD.) A Focused Approach Example Prove that 1 s w d G e Solution (1 ) 1 1 s s s s s w d s v sv s s W W W W G V V V V e eV V V Example At a certain construction site the natural moisture content is 25%, and void ratio is 0.7. If specific gravity is 2.66, calculate the porosity, moist unit weight, dry unit weight and degree of saturation. Solution w = 25% = 0.25; e = 0.7; G = 2.66, n = ?, t = ?, d = ?, S = ? We know wG Se 0.25x2.66 Sx0.7 S 0.95 95% e 0.7 n 0.41 1 e 1 0.7 3w t G (1 w) 2.66x9.81(1 0.25) 19.19kN / m 1 e 1 0.7 Example A soil is saturated at 52% moisture content and has a unit weight of 16.5 KN/m3 . Calculate its soil ratio, specific gravity, dry unit weight and submerged unit weight. Solution w = 0.52 S = 1 t = 16.5 kN/m3 We know t t d d 16.5 1 w 10.85 l w 1 0.52 KN/m3 Se= wG 1 x e = 0.52 x G e = 0.52 G (1) Also w wG G d 10.85 1 e 1 e WHATSAPP: +91-9412903929 AMIESTUDYCIRCLE.COM INFO@AMIESTUDYCIRCLE.COM
- 5. GEOTECHNICAL AND FOUNDATION ENGINEERING INTRODUCTION TO SOIL MECHANICS SECOND FLOOR, SULTAN TOWER, ROORKEE – 247667 UTTARAKHAND PH: (01332) 266328 Web: www.amiestudycircle.com 5/56 AMIE(I) STUDY CIRCLE(REGD.) A Focused Approach wG 9.81G 10.85 1 0.52G 1 0.52G 10-85 + 10.85 x 0.52 G = 9.81G 4.168G = 10.85 G = 2.60 from (1) e = 0.52 G = 0.52 x 2.60 = 1.352 sub = sat - w = 16.5 – 9.81 = 6.7 KN/m3 Example The porosity of a sand sample is 0.4. Assuming a specific gravity of 2.68, compute void ratio, dry unit weight and moist unit weight at 60% saturation. Solution Take t as 9.8 kN/m3 . Given S = 0.6. 0.4 0.667 1 1 1 0.4 e n n e e n 32.68 9.81 15.77 / 1 (1 0.667) s w d G x kN m e 3( ) (2.68 0.6 0.667) (9.81) 18.13 / 1 (1 0.667) s t w G Se x kN m e Example For a sand soil with soil grains spherical and uniform in size, determine maximum void ratio. Solution The loosest possible arrangement for round particles of uniform diameter d is shown in Fig. (a), which is its plan view. This is known as simple packing. Each sphere makes contact with six adjacent spheres-four from sides, one from bottom and one from top. Each of the spheres may be assumed to fit within a cube of side dimension dt as shown in Fig.(b). (a) (b) Thus, the volume V of the cube is d3 and the volume of the sphere Vs is d3 /6. Thus, the maximum void ratio (loosest state) is 3 3 max 3 ( / 6) 0.91 / 6 v s V d d e V d WHATSAPP: +91-9412903929 AMIESTUDYCIRCLE.COM INFO@AMIESTUDYCIRCLE.COM
- 6. GEOTECHNICAL AND FOUNDATION ENGINEERING INTRODUCTION TO SOIL MECHANICS SECOND FLOOR, SULTAN TOWER, ROORKEE – 247667 UTTARAKHAND PH: (01332) 266328 Web: www.amiestudycircle.com 6/56 AMIE(I) STUDY CIRCLE(REGD.) A Focused Approach Problem The porosity of a sand sample is 0.4. Assuming a specific gravity of 2.68, compute void ratio, dry unit weight and moist unit weight at 60% saturation. Unit weight of water is 9.8 kN/m3 . Answer: e = 0.667, d = 15.77 kN/m3 , t = 18.13 kN/m3 at 60% saturation Example The unit weight of a slightly most soil is 17.15 KN/m3 and its moisture content as determined in the laboratory is 8%. On adding some water to 10 m3 of the soil its water content rises to 17%. Let the specific gravity be 2.65. Determine the qty. of water required. Solution Before adding water t1 = 17.15 KN/m3 3t1 d 1 17.15 15.884kN / m 1 w 1 .08 After adding water 3 t2 2 d(1 w ) (1 0.17)x15.884 18.57kN / m Water added 3 t2 t1 18.57 17.15 1.42kN / m Hence water added per 10 m3 = 1.42 x 10 = 14.2 kN Problem1 A soil sample in its natural state, when fully saturated, has a water content of 32.5 percent. Determine the void ratio, dry and total unit weights. Calculate the total weight of water required to saturate a soil mass of volume 10 m3 . Assume G = 2.69. Answer: e = 0.874, t = 18.7 kN/m3 , d = 14.08 kN/m3 , weight of water required = 46.2 kN Example The undisturbed soil at a borrow pit has a water content of 15 %, void ratio of 0.60 and specific gravity of soil 2.70. The soil from the borrow pit is to be used for construction of an embankment with a finished volume of 40,000 cu m. The specifications for the embankment require a water content of 18% and dry unit weight of 1.76 g/cc. Calculate the quantity of soil required to be excavated for the embankment. 1 If unit weight of water is not given in the problem, then take it as w = 9.8 kN/m3 . WHATSAPP: +91-9412903929 AMIESTUDYCIRCLE.COM INFO@AMIESTUDYCIRCLE.COM
- 7. GEOTECHNICAL AND FOUNDATION ENGINEERING INTRODUCTION TO SOIL MECHANICS SECOND FLOOR, SULTAN TOWER, ROORKEE – 247667 UTTARAKHAND PH: (01332) 266328 Web: www.amiestudycircle.com 7/56 AMIE(I) STUDY CIRCLE(REGD.) A Focused Approach Solution It is best to solve such problems by determining the volume of solids/weights of solids that will be present in the finished embankment at the specified void ratio. This volume of solids will have to come out of the soil mass in the borrow area. Naturally, the volume of soil needed will be a function of void ratio of the soil in the borrow pit. Dry unit weight of the embankment soil = sW V = 1.76 g/cc (Or 1.76 t/m3 ) Or if V = 1 cu m Ws = 1.76 t Hence for V = 40,000 cu m, Ws = 40,000 x 1.76 = 70400 t Dry unit weight of the soil in the borrow pit, γd = G 1 + e .γw = 2.7 1 + 0.6 .1.0 = 1.6875 t/m3 γd = Ws/V = 1.6875 t/m3 for Ws = 70,400 t, the volume of soil that has to be taken out V = Ws/γd = 70400/1.6875 = 41718 cu m Example While boring was being done, the soil sample was found to be saturated with kerosene oil. The saturated unit weight of soil was found to be 2.4 gm/cc. Determine the void ratio and dry unit weight if the specific gravity of soil grains and kerosene oil be 2.65 and 0.89, respectively. Solution γ = kkG (1 + )w 1 + e where γk is unit weight of soil. wk is oil content of soil. but e = wkG/Sr for saturated sample S = 1 e = wkG γsat = k e G 1+ G 1 + e where γsat = 2.4 gm/cc, γk = 0.89 gm/cc G = 2.65 with reference to water i.e. 2.65/0.89 = 2.98 with reference to oil. 2.4 = 2.98 x 0.89[1 + (e/2.98)] 1 + e Solving e = 0.188 WHATSAPP: +91-9412903929 AMIESTUDYCIRCLE.COM INFO@AMIESTUDYCIRCLE.COM
- 8. GEOTECHNICAL AND FOUNDATION ENGINEERING INTRODUCTION TO SOIL MECHANICS SECOND FLOOR, SULTAN TOWER, ROORKEE – 247667 UTTARAKHAND PH: (01332) 266328 Web: www.amiestudycircle.com 8/56 AMIE(I) STUDY CIRCLE(REGD.) A Focused Approach also γd = k1 + w = 2.4 e 1 + G = 2.4 0.166 1 + 2.98 = 2.27 gm/cc Example How many cubic meters of fill can be constructed at a void ratio of 0.7 from 191000 m3 of borrow material that has a void ratio of 1.2 ? Solution Vs = 1, V = 1+e.The sectional area of the block 1x1 units. When the soil is in the borrow pit, Vs = 1 m3 , V = 1+1.2 = 2.2 m3 .When the soil is put in the fill, Vs = 1 m3 ,V=1+0.7 = 1.7 m3 . This means that for every 2.2 m3 of material excavated we can construct a fill of 1.7 m3 .Therefore, the total quantity of fill that can be constructed is = 2.2 1.7 x 191000 = 1,47,591 m3 RELATIVE DENSITY A usual way to characterize the density of a natural granular soil is with relative density Dr , defined as Dr = max max min - ee -e e x 100 % = d,max d x d d,min d,max d,min - - x 100 % where emin = void ratio of soil in densest condition; emax = void ratio of soil in loosest condition; e = in place void ratio; γd max= dry unit weight of soil in densest condition; γd min= dry unit weight of soil in loosest condition; γd = in place dry unit weight Example The natural dry density (d) of a soil sample is 20 kN/m3 . Laboratory tests give the max. dry density of 25 kN/m3 and minimum dry density of 19 kN/m3 . Find relative density. Take Gs = 2.70. Solution Given 3 3 3 , max min20 / ; 25 / ; 19 /d nat kN m kN m kN m We know max min min min 2.70(9.8) 25 0.059 1 1 s wG e e e min max max max 2.70(9.8) 19 0.39 1 1 s wG e e e max 2.70(9.8) 20 0.32 1 1 s w nat nat nat G e e e WHATSAPP: +91-9412903929 AMIESTUDYCIRCLE.COM INFO@AMIESTUDYCIRCLE.COM
- 9. GEOTECHNICAL AND FOUNDATION ENGINEERING INTRODUCTION TO SOIL MECHANICS SECOND FLOOR, SULTAN TOWER, ROORKEE – 247667 UTTARAKHAND PH: (01332) 266328 Web: www.amiestudycircle.com 9/56 AMIE(I) STUDY CIRCLE(REGD.) A Focused Approach Hence max max min 0.39 0.32 100 100 21.21% 0.39 0.059 nat r - ee D x x -e e (Or you can use direct formula) Problem The dry unit weight of a sand sample in the loosest state is 13.34 kN/m3 and in the densest state, it is 21.19 kN/m3 . Determine the density index of this sand when it has a porosity of 33%. Assume the grain specific gravity as 2.68. min (loosest state) = 13.34 kN/m3 max (densest state) = 21.19 kN/m3 Porosity, n = 33% Answer: 65.8% Example A field density test was conducted by core-cutter method and the following data was obtained: Weight of empty core-cutter = 22.80 N Weight of soil and core-cutter = 50.05 N Inside diameter of the core-cutter = 90.0 mm Height of core-cutter = 180.0 mm Weight or wet sample for moisture determination = 0.5405 N Weight of oven-dry sample = 0.5112 N Specific gravity so soil grains = 2.72 Determine (a) dry density, (b) void-ratio, and (c) degree of saturation. Solution Weight of soil in the core-cutter (W) = (50.05 – 22.80) = 27.25 N Volume of core-cutter (V) = (π/4) × 92 × 18 cm3 = 1145.11 cm3 Wet unit weight of soil (γ) = W/V = 27.25/1145.11 N/cm3 = 23.34 kN/m3 Weight of oven-dry sample = 0.5112 N Weight of moisture = (0.5405 – 0.5112) = 0.0293 N Moisture content, w = 0.0293/0.5112 = 5.73% Dry density d = /(1 + w) = 23.34/(1 + 0.0573) = 22.075 kN/m3 WHATSAPP: +91-9412903929 AMIESTUDYCIRCLE.COM INFO@AMIESTUDYCIRCLE.COM
- 10. GEOTECHNICAL AND FOUNDATION ENGINEERING INTRODUCTION TO SOIL MECHANICS SECOND FLOOR, SULTAN TOWER, ROORKEE – 247667 UTTARAKHAND PH: (01332) 266328 Web: www.amiestudycircle.com 10/56 AMIE(I) STUDY CIRCLE(REGD.) A Focused Approach Grain specific gravity, G = 2.72 Now 2.72 9.81 22.075 0.21 1 1 w d G x e e e Degree of saturation = S = wG/e = 0.0573 x 2.72/0.21 = 74.2% WHATSAPP: +91-9412903929 AMIESTUDYCIRCLE.COM INFO@AMIESTUDYCIRCLE.COM
- 11. GEOTECHNICAL AND FOUNDATION ENGINEERING INTRODUCTION TO SOIL MECHANICS SECOND FLOOR, SULTAN TOWER, ROORKEE – 247667 UTTARAKHAND PH: (01332) 266328 Web: www.amiestudycircle.com 11/56 AMIE(I) STUDY CIRCLE(REGD.) A Focused Approach Grain Size Distribution Particle size distribution of a soil as obtained from sieve and hydrometer analysis is represented in the of graph known as particle size distribution curve. The particle diameters are plotted on x – axis (log scale) and % finer are plotted on y – axis (natural scale). The diameter in the particle distribution curve corresponding to 10% finer is called effective size and is denoted as D10. Similar definitions are given to D30 and D60. Now uniformity coefficient 60 u 10 D C D and coefficient of gradation or coefficient of curvature 2 30 c 60 10 D C D xD The soil will be well graded if Cc lies between 1 and 3. In addition to this, Cu must be greater than 4 for gravels and greater than 6 for sands. SIEVE ANALYSIS Sieve analysis is carried out by using a set of standard sieves. In sieve analysis, the size of the particle is side dimension of the square opening in the sieve through which it just passes. Indian Standard Code (2720:1975) suggests a set of sieves containing 32 sieves from sizes 5.66 mm to 0.044 mm (5.66 mm, 4.76 mm, 4.00 mm, …… 0.064 mm, 0.053 mm, 0.044 mm). The sieve analysis is carried out by sieving a known dry weight of sample through the sieve set (sieve with max size opening at top). The whole set of sieves is shaked for about 10 minutes. The portion of the soil sample retained on each sieve is weighed. The percentage of soil retained on each sieve is calculated on the basis of total weight of soil sample taken. From these results, percentage passing through each sieve is calculated. This is called percentage finer. These percentages are plotted against the sieve sizes to obtain grain distribution curve (also called particle size distribution curve). WHATSAPP: +91-9412903929 AMIESTUDYCIRCLE.COM INFO@AMIESTUDYCIRCLE.COM
- 12. GEOTECHNICAL AND FOUNDATION ENGINEERING INTRODUCTION TO SOIL MECHANICS SECOND FLOOR, SULTAN TOWER, ROORKEE – 247667 UTTARAKHAND PH: (01332) 266328 Web: www.amiestudycircle.com 12/56 AMIE(I) STUDY CIRCLE(REGD.) A Focused Approach Particle diameter is plotted on log scale on x-axis and percentage finer is plotted on y-axis on natural scale. Example Results of sieve analysis for a soil are given in following table. Weight of oven dry sample used for the analysis is 482 g. Compute percent finer for each case. Sieve diameter (mm) 2.032 1.000 0.592 0.420 0.211 0.104 0.075 Wt. of soil retained (g) 40.97 13.01 32.05 13.26 29.89 41.45 24.68 Solution Calculations are done in following table. Diameter (mm) Wt. of soil retained (g) Wt. of soil retained in % Percent finer (i.e. percent passed) 2.032 40.97 8.50* 91.50** 1.000 13.01 2.70 88.80*** 0.592 32.05 6.65 82.15**** 0.420 13.26 2.75 79.40 0.211 29.89 6.20 73.30 0.104 41.45 8.60 64.60 0.075 24.68 5.12 59.48 * (40.97/482) x 100 = 8.50 ** 100 – 8.50 = 91.50 8 *** 91.50 – 2.70 = 88.80 **** 88.80 – 6.65 = 82.15 Now plot particle diameter (mm) on x-axis on log scale and percent finer (%) on y-axis on natural scale. Example 500 g of dry soil was used for a sieve analysis. The masses of soil retained on each sieve are given below: % finer WHATSAPP: +91-9412903929 AMIESTUDYCIRCLE.COM INFO@AMIESTUDYCIRCLE.COM
- 13. GEOTECHNICAL AND FOUNDATION ENGINEERING INTRODUCTION TO SOIL MECHANICS SECOND FLOOR, SULTAN TOWER, ROORKEE – 247667 UTTARAKHAND PH: (01332) 266328 Web: www.amiestudycircle.com 13/56 AMIE(I) STUDY CIRCLE(REGD.) A Focused Approach Sieve size Mass in gm 2.00 mm 10 1.40 mm 18 1.00 mm 60 500 135 250 145 125 56 75 45 Plot a grain size distribution curve and compute the following: (a) Percentages of gravel, coarse sand, medium sand, fine sand and silt, as per the Unified Soil Classification System, (b) uniformity coefficient (c) coefficient of curvature. Comment on the type of soil. Solution Sieve size Mass retained in gm % retained Cumulative % retained % finer 2.00 mm 10 2 2.0 98.0 1.40 mm 18 3.6 5.6 94.4 1.00 mm 60 12.0 17.6 82.4 500 =0.500 mm 135 27.0 44.6 55.4 250 = 0.250 mm 145 29.0 73.6 26.4 125 = 0.125 mm 56 11.2 84.8 15.2 75 = 0.075 mm 45 9.0 93.8 6.2 (a) Percentage coarse to medium sand = 98 - 48 = 50 percent Percentage fine sand = 48 - 6.2 = 41.8 percent Percentage silt and clay = 6.2 percent. (b) Uniformity coefficient Cu = D60/D10 = 0.58/0.098 = 5.92 (c) Coefficient of curvature Cc = D30 2 /D10D60 = 0.282 /(0.098 x 0.58) = 1.38 The soil is just on the border line of well graded sand. WHATSAPP: +91-9412903929 AMIESTUDYCIRCLE.COM INFO@AMIESTUDYCIRCLE.COM
- 14. GEOTECHNICAL AND FOUNDATION ENGINEERING INTRODUCTION TO SOIL MECHANICS SECOND FLOOR, SULTAN TOWER, ROORKEE – 247667 UTTARAKHAND PH: (01332) 266328 Web: www.amiestudycircle.com 14/56 AMIE(I) STUDY CIRCLE(REGD.) A Focused Approach HYDROMETER METHOD The soil particles less than 75 size can be further analysed for the distribution of the various grain-sizes of the order of silt and clay be 'sedimentation analysis’ or 'wet analysis'. The soil fraction is kept in suspension in a liquid medium, usually water. The particles descend at velocities, related to their sizes, among other things. The analysis is based on 'Stokes Law' for what is known as the 'terminal velocity' of a sphere falling through an infinite liquid medium. If a single sphere is allowed to fall in an infinite liquid medium without interference, its velocity first increases under the influence of gravity, but soon attains a constant value. This constant velocity, which is maintained indefinitely unless the boundary conditions change, is known as the 'terminal velocity'. The principle is obvious: coarser particles tend to settle faster than finer ones. By Stokes' law, the terminal velocity of the spherical particle is given by 2 (1/18)[( ) / ]sv D Thus, if s = unit weight of the material of falling sphere in g/cm3 , = unit weight of the liquid medium in g/cm3 = viscosity of the liquid medium in g sec/cm2 , and WHATSAPP: +91-9412903929 AMIESTUDYCIRCLE.COM INFO@AMIESTUDYCIRCLE.COM
- 15. GEOTECHNICAL AND FOUNDATION ENGINEERING INTRODUCTION TO SOIL MECHANICS SECOND FLOOR, SULTAN TOWER, ROORKEE – 247667 UTTARAKHAND PH: (01332) 266328 Web: www.amiestudycircle.com 15/56 AMIE(I) STUDY CIRCLE(REGD.) A Focused Approach D = diameter of the spherical particle in cm, v, the terminal velocity, is obtained in cm/s. In S.I. units, if s and are expressed in kN/m3 , in kN sec/m2 , D in metres, v will be obtained in m/sec. This method depends upon variations in the density of soil suspension contained in a graduated jar (1000 c.c.). The density of the suspension is measured with a hydrometer at determined time intervals; then the coarsest diameter of particles in suspension at a given time and the percentage of particles finer than that coarsest (suspended) diameter are computed. Description of hydrometer: Given figure shows a hydrometer that is generally used in hydrometer analysis. The hydrometer possesses a long stem and a bulb. The total length of the hydrometer varies from 30 cm to 40 cm. The stem is graduated to give specific gravity of soil suspension. Test procedure. In this test, about 50 gm of oven dry soil is put into 1000 cm3 of distilled water in a graduated measuring cylinder. A dispersing agent such as Hydrogen peroxide is added to disperse soil better. As particles of different sizes begin to settle with different velocities, the density of suspension starts varying with time and depth. When the hydrometer is gently introduced into such a suspension it comes to equilibrium at a depth where the density is such as to produce a buoyant force which will balance the weight of hydrometer. Thus, the hydrometer will come to equilibrium at different depths as time progresses. This depth h (or z) of the level of the centre of its bulb is measured by introducing the hydrometer at different values of time (t). Now corresponding to this height and time (t), there is a diameter (D) such that all particles of size equal to or greater than this diameter would have settled through the depth h, while particles finer than D will be in suspension within depth h. This diameter is calculated as (i) s w 18 h D t where = viscosity of water, kN – s/m2 s = unit weight of soil particles, kN/m3 w = unit weight of water kN/m3 D = diameter of soil particle at height h (m) (ii) s 18 h D 10 981x60t G 1 where D is in mm, n in Poise (1P = 10-4 kN/m2 ), h in cm and t in minutes. Now from hydrometer stem reading and diameter(D) we can find percent of particles finer than this diameter (D). WHATSAPP: +91-9412903929 AMIESTUDYCIRCLE.COM INFO@AMIESTUDYCIRCLE.COM
- 16. GEOTECHNICAL AND FOUNDATION ENGINEERING INTRODUCTION TO SOIL MECHANICS SECOND FLOOR, SULTAN TOWER, ROORKEE – 247667 UTTARAKHAND PH: (01332) 266328 Web: www.amiestudycircle.com 16/56 AMIE(I) STUDY CIRCLE(REGD.) A Focused Approach Percent finer C s RG N% x x100 G 1 W where RC is hydrometer reading. Having known the values of particle diameter (D) and % finer, we can obtain particle distribution curve, as in sieve analysis. The limitations of sedimentation analysis, based on Stokes' law, or the assumptions are as follows: The finer soil particles are never perfectly spherical. Their shape is flake-like or needle-like. However, the particles are assumed to be spheres, with equivalent diameters, the basis of equivalence being the attainment of the same terminal velocity as that in the case of a perfect sphere. Stokes' law is applicable to a sphere falling freely without any interference, in an infinite liquid medium. The sedimentation analysis is conducted in a one-litre jar, the depth being finite: the walls of the jar could provide a source of interference to the free fall of particles near it. The fall of any particle may be affected by the presence of adjacent particles; thus, the fall may not be really free. However, it is assumed that the effect of these sources of interference is insignificant if suspension is prepared with about 50 g of soil per litre of water. All the soil grains may not have the same specific gravity. However, an average value is considered all right, since the variation may be insignificant in the case of particles constituting the fine fraction. Particles constituting to fine soil fraction may carry surface electric charges, which have a tendency to create 'flocs'. Unless these flocs are broken, the sizes calculated may be those of the floes. Flocs can be a source of erroneous results. A deflocculating agent, such as sodium silicate, sodium oxalate, or sodium hexa-metaphosphate, is used to get over this difficulty. Example In a hydrometer analysis 50 g of oven dry soil passing 0.075 mm sieve is dispersed in 1000 cm3 of water. For a reading of 70 taken after 120 minutes, the depth of centre of the hydrometer bulb is 145 mm. Specific gravity of soil grains is 2.65 and viscosity of water is 0.01 Poise. What is the particle size whose percentage can be estimated from this reading and what is this percentage? Solution Given t = 120 min, h = 145 mm = 14.5 cm, = 0.01 P Now 18 h 18x0.01x14.5 D(mm) 10 10 0.0047mm 981x60xt(G 1) 981x60x120(2.65 1) WHATSAPP: +91-9412903929 AMIESTUDYCIRCLE.COM INFO@AMIESTUDYCIRCLE.COM
- 17. GEOTECHNICAL AND FOUNDATION ENGINEERING INTRODUCTION TO SOIL MECHANICS SECOND FLOOR, SULTAN TOWER, ROORKEE – 247667 UTTARAKHAND PH: (01332) 266328 Web: www.amiestudycircle.com 17/56 AMIE(I) STUDY CIRCLE(REGD.) A Focused Approach Now % finer C s RG N x x100 G 1 W = 2.65 70 x x100 22.48% 2.65 1 50 Note: If in this question hydrometer reading was given as 1.070 then it will be taken as (1.070 – 1) x 1000 = 70. Problem During a sedimentation test for a grain analysis, the corrected hydrometer reading in a 1000 c.c. uniformly mixed soil suspension at the instant of starting of sedimentation (t = 0) was 1.030. After 30 min., the corrected hydrometer reading at an effective depth of 10 cm was noted to be 1.015. If the specific gravity of solids is 2.65 and viscosity of water is 0.01 P. Find (i) the total weight of soil solids placed in the 1000 cc suspension (ii) diameter corresponding to the 30 min reading and the percentage finer. Answer: 48.2, 0.00786 mm, 50% WHATSAPP: +91-9412903929 AMIESTUDYCIRCLE.COM INFO@AMIESTUDYCIRCLE.COM
- 18. GEOTECHNICAL AND FOUNDATION ENGINEERING INTRODUCTION TO SOIL MECHANICS SECOND FLOOR, SULTAN TOWER, ROORKEE – 247667 UTTARAKHAND PH: (01332) 266328 Web: www.amiestudycircle.com 18/56 AMIE(I) STUDY CIRCLE(REGD.) A Focused Approach Consistency of Soil ATTERBERG LIMITS The limits are based on the concept that a fine grained soil can exist in any four states depending on its water content. Thus a soil is solid when dry, and upon the addition of water proceeds through the semi solid, plastic, and finally liquid states. The water content at the boundaries between adjacent states are termed shrinkage limit, plastic limit, and liquid limit. In liquid state, shear strength of soil is zero. If water is reduced to liquid limit, then soil starts showing plasticity and some shear strength. In this state(plastic state) soil can be moulded to any desired shape. As the water is further reduced to plastic limit, soil starts crumbling. In this state( semi solid state) soil looses its plasticity. Also, in this semi solid state, when water content is reduced, water spaces diminish and soil grains approach each other. At shrinkage limit they come closer to each other with an extent which is physically possible. When water content is reduced further, voids are filled up with air without any reduction in volume. Plasticity Index(P.I. or IP) = wl - wp When a graph is plotted on semi log paper between number of blows(N) on log scale on x axis and water content on y axis on ordinary scale. A straight line is obtained which is called flow curve. Now, slope of this curve is called “flow index(If)”. If = 2 1 1 210 10 -w w -log logN N Toughness Index = P f Plasticity index(I ) Flow index( )I Liquidity Index(LI) = IL = pn p w - w I On flow curve, liquid limit is water content corresponding to 25 blows. Determination of liquid limit test. The device used to determine liquid limit is called Casagrande’s liquid limit test. It consist of a hard rubber base (150 mm x 125 mm) on which a brass dish is mounted. This brass cup is raised by to mm and dropped. A soil pat is made inside the cup and a groove is cut in it with a grooving tool. The cup is raised & dropped till the groove closes along its bottom along a distance of 10 mm. The moisture content at which the closure in 25 blows is defined as the liquid limit (L. L.). In order to determine this moisture content, about four or move tests are conducted with varying moisture contents and corresponding number of blows required for closure of groove are noted. WHATSAPP: +91-9412903929 AMIESTUDYCIRCLE.COM INFO@AMIESTUDYCIRCLE.COM
- 19. GEOTECHNICAL AND FOUNDATION ENGINEERING INTRODUCTION TO SOIL MECHANICS SECOND FLOOR, SULTAN TOWER, ROORKEE – 247667 UTTARAKHAND PH: (01332) 266328 Web: www.amiestudycircle.com 19/56 AMIE(I) STUDY CIRCLE(REGD.) A Focused Approach A curve, called flow curve is plotted between number of blows (x-axis, log scale) and moisture content (y-axis, natural scale). The graph is plotted as a straight line. The moisture content against 25 blows will be liquid limit. Shrinkage limit. Shrinkage limit is water content at boundary between semi solid state and solid state. There will be no further reduction of volume by reducing water content. The space left behind due to reduction of water content will be filled by air. ws = 1 2 1 2w 2 ( - ) - ( - )W W V V W x 100 where ws = shrinkage limit; W1 = weight of ordinary sample; W2 = weight of dried sample; V1 = Original Volume; V2 = Vd = Volume of dried sample at shrinkage limit. Also, ws = 2 w 2 V 1 x100 W G Shrinkage ratio. Shrinkage ratio is defined as ratio of given change in volume expressed as percentage of dry volume, to the corresponding change in water content.( In the region of water content above the shrinkage limit) SR = 1 2 S 1 2 -V V x 100 V -w w where V1 = volume of soil mass at water content w1, V2 = volume of soil mass at water content w2, Vs = volume of dry soil mass. w1, w2 are water contents expressed as percentages. Degree of Shrinkage. This is change in volume per unit original volume. 1 2 r 1 V V S V Sr % Quality of soil < 5 Good 5 - 10 Medium good 10-15 Poor > 15 Very poor WHATSAPP: +91-9412903929 AMIESTUDYCIRCLE.COM INFO@AMIESTUDYCIRCLE.COM
- 20. GEOTECHNICAL AND FOUNDATION ENGINEERING INTRODUCTION TO SOIL MECHANICS SECOND FLOOR, SULTAN TOWER, ROORKEE – 247667 UTTARAKHAND PH: (01332) 266328 Web: www.amiestudycircle.com 20/56 AMIE(I) STUDY CIRCLE(REGD.) A Focused Approach Example Tests on a clay sample indicated the following properties of the soil: (i) natural water content = 45.6 % (ii) liquid limit = 49.1 % (iii) plastic limit = 26.5 % (iv) dia of 60 % size = 0.0060 mm and dia of 10 % size = 0.0005 mm Calculate (i) liquidity index (ii) uniformity coefficient Solution Liquidity index = pn p w - w I = pn L p w - w -w w = 45.6 - 26.5 49.1 - 26.5 = 0.845 Uniformity coefficient = D60/D10 = 0.0060/0.0005 = 12 Example The laboratory tests on sample of soil gave the following results : wn = 24% , wl= 62 %, wp = 28 %, Percentage of particle less than 2μ = 23 %. Determine (a) The liquidity index (b) Activity number (c) Consistency and nature of soil. Solution (a) Plasticity index Ip = wn-wp = 62 - 28 = 34 % Liquidity Index IL = l p p -w w I = 24- 28 34 = -0.12 (b) Activity Number Ac = pI % of particles < 2 = 34 23 = 1.48 Comments : Since the IL is negative, the consistency of the soil is very stiff to extremely stiff(semi solid state). Since the Ip is greater than 17 % it is highly plastic. Since Ac value is greater than 1.40, the soil is active and is subjected to significant volume change(shrinking and swelling) just like black cotton soil in India. WHATSAPP: +91-9412903929 AMIESTUDYCIRCLE.COM INFO@AMIESTUDYCIRCLE.COM
- 21. GEOTECHNICAL AND FOUNDATION ENGINEERING INTRODUCTION TO SOIL MECHANICS SECOND FLOOR, SULTAN TOWER, ROORKEE – 247667 UTTARAKHAND PH: (01332) 266328 Web: www.amiestudycircle.com 21/56 AMIE(I) STUDY CIRCLE(REGD.) A Focused Approach Example Two soil samples tested in soil mechanics laboratory gave the following results : Sample No. 1 Sample No. 2 Liquid Limit 50 % 40 % Plastic limit 30 % 20 % Flow Indices, If 27 17 Determine (a) The toughness Indices It (b) Comment on the types of soils. Solution (a) Toughness Index It = l p f -w w I Sample 1 : It = 50 - 30 27 = 0.74 Sample 2 : It = 40- 20 17 = 17 20 = 1.18 (b) Comment Both the soils are clay soils, as their toughness indices lie between 0 and 3. Soil one is friable at the plastic limit since its It value is less than one. Soil two is stiffer than soil one at the plastic limit since It value of the latter is higher. Example The natural moisture content of an excavated soil is 32 %. Its liquid limit is 60 % and plastic limit is 27 %. Determine the plasticity index of the soil and comment about the nature of the soil. Solution Plasticity index = Ip = wl - wp = 60 - 27 = 33 % The nature of the soil can be judged by determining its liquidity index, Il IL = n p p -w w I = 32- 27 33 = 0.15 Since the value of Il is very close to 0, the nature of the soil according to following table is very stiff. Consistency IL Semisolid or solid state Negative Very stiff state (wn = wp) 0 Very soft state (wn = wl) 1 Liquid state (when disturbed) > 1 WHATSAPP: +91-9412903929 AMIESTUDYCIRCLE.COM INFO@AMIESTUDYCIRCLE.COM
- 22. GEOTECHNICAL AND FOUNDATION ENGINEERING INTRODUCTION TO SOIL MECHANICS SECOND FLOOR, SULTAN TOWER, ROORKEE – 247667 UTTARAKHAND PH: (01332) 266328 Web: www.amiestudycircle.com 22/56 AMIE(I) STUDY CIRCLE(REGD.) A Focused Approach Example A soil with a liquidity index of -0.20 has a liquid limit of 56 % and a plasticity index of 20 %. What is its natural water content ? What is the name of this soil ? Solution Il = n p p -w w I wp = wl - Ip = 56 - 20 = 36, wn = IlIp + wp = -0.20 x 20 + 36 = 32 Since Il is negative, the soil is in a semi solid or solid state as per table given in above example. Example Liquid limit tests on a given sample of clay were carried out. The data obtained are as given below. Test No. 1 2 3 4 Water Content % 70 64 47 44 No. of blows 5 8 30 45 Draw the flow curve on semi-log paper and determine the liquid limit and flow index of the soil. Solution Following figure gives the flow curve for the given sample of clay soil. As per the curve, Liquid limit, wl = 50%; Flow index, If = 29 WHATSAPP: +91-9412903929 AMIESTUDYCIRCLE.COM INFO@AMIESTUDYCIRCLE.COM
- 23. GEOTECHNICAL AND FOUNDATION ENGINEERING INTRODUCTION TO SOIL MECHANICS SECOND FLOOR, SULTAN TOWER, ROORKEE – 247667 UTTARAKHAND PH: (01332) 266328 Web: www.amiestudycircle.com 23/56 AMIE(I) STUDY CIRCLE(REGD.) A Focused Approach Problem Two soils were tested for their consistency limits in the laboratory. Following data were obtained. Soil A Soil B No. of blows w % No. of blows w % 8 43 5 65 20 39 15 61 30 37 30 59 45 35 40 58 Plastic limit = 25% Plastic limit = 30% Find (i) plastic limit of soils (ii) liquid limit of soils Answer: (i) 13, 30 (ii) 1.15, 0.67 Example An undisturbed saturated specimen of clay has a volume of 18.9 cm3 and a weight of 30.2 g. On oven drying, the weight reduces to 18 g. The volume of dry specimen as determined by displacement of mercury is 9.9 cm3 . Determine shrinkage limit and specific gravity. Solution Given W1 = 30.2 g, W2 = 18 g, V1 = 18.9 cm3 , V2 = 9.9 cm3 Now, shrinkage limit = 18.9 9.9 x130.2 18 x100 x100 17.8% 18 18 Also 2 w 2 V 1 SL x100 W G 2 w 2 V1 SL G W 100 1 9.9x1 17.8 0.372 G 18 100 G = 2.69 WHATSAPP: +91-9412903929 AMIESTUDYCIRCLE.COM INFO@AMIESTUDYCIRCLE.COM
- 24. GEOTECHNICAL AND FOUNDATION ENGINEERING INTRODUCTION TO SOIL MECHANICS SECOND FLOOR, SULTAN TOWER, ROORKEE – 247667 UTTARAKHAND PH: (01332) 266328 Web: www.amiestudycircle.com 24/56 AMIE(I) STUDY CIRCLE(REGD.) A Focused Approach Soil Classification The more common classification systems are enumerated below : Preliminary Classification by Soil types or Descriptive Classification. Geological Classification or Classification by Origin. Classification by Structure. Grain-size Classification or Textural Classification. Unified Soil Classification System. Indian Standard Soil Classification System. GEOLOGICAL CLASSIFICATION Soils may be classified on the basis of their geological origin. The origin of a soil may refer either to its constituents or to the agencies responsible for its present state. Based on constituents, soils may be classified as : 1. Inorganic soils 2. Organic soils (i) Plant life (ii)Animal life Based on the agencies responsible for their present state, soils may be classified as : 1. Residual soils 2. Transported soils (a) Alluvial or sedimentary soils (transported by water) (b) Aeolian soils (transported by wind) (c) Glacial soils (transported by glaciers) (d) Lacustrine soils (deposited in lakes) (e) Marine soils (deposited in seas) UNIFIED SOIL CLASSIFICATION This system was developed by Casagrande. This system is based on both grain size and plasticity propertied of soil. This system is also used by Bureau of Indian Standards. In this system soils are divided in two divisions 1. Coarse grained soils - In these soils, more than 50% of soil by weight is larger than 75 micron (0.075 mm) sieve size. 2. Fine grained soils – In these soils, more than 50% by weight is less than 75 micron sieve size. Soils are classified into two categories based on percent passing IS sieve No. 8 (size 75 micron i.e. 0.075 mm): WHATSAPP: +91-9412903929 AMIESTUDYCIRCLE.COM INFO@AMIESTUDYCIRCLE.COM
- 25. GEOTECHNICAL AND FOUNDATION ENGINEERING INTRODUCTION TO SOIL MECHANICS SECOND FLOOR, SULTAN TOWER, ROORKEE – 247667 UTTARAKHAND PH: (01332) 266328 Web: www.amiestudycircle.com 25/56 AMIE(I) STUDY CIRCLE(REGD.) A Focused Approach 1. Coarse grained if percent passing is less than 50%. 2. Fine grained if percent passing is more than 50%. Coarse grained soils are further sub-divided into gravels and sands. The soils of these groups are represented by symbols starting with G and S respectively. These are further classified on the basis of uniformity coefficient (Cu) and coeff. of gradation (Cc) into well graded (GW or SW) or poorly graded (GP or SP). If fines are present, the soil is classified according to procedure for fine grained soils. If the soil is silty then GM or SM is used as the symbol. If clayey then symbol GC or SC is used When the percent passing is between 5 and 12, dual symbols such as GW - GM, GP – GM etc. are adopted. Fine grained soil is classified into inorganic silt (M), inorganic clay (C) and organic silts and clap (O) by plotting the liquid limit (x – axis) and (PI) on y – axis. The diagonal line drawn in plasticity chart is given by equation A line PI = 0.73 (LL - 20) Soil with LL less than 30 is low plastic, and represented by symbol (L) Soil with LL between 30 and 50 is medium plastic, and represented by symbol (I). Soil with LL more than 50 is high plastic, and represented by symbol (H). A soil lying below A - line is silt (M) and lying above is clay. Hence ML would mean inorganic silt with low plasticity. CL would mean inorganic clay with low plasticity. OL would mean organic silt & clays of low plasticity If Cu > 6 and 1 < Cc < 3, then soil will well graded, else poorly graded. Cu = D60/D10 and Cc = (D30)2 /(D60D30) CHART FOR COARSE GRAINED SOIL Following is a chart to classify a coarse grained soil. WHATSAPP: +91-9412903929 AMIESTUDYCIRCLE.COM INFO@AMIESTUDYCIRCLE.COM
- 26. GEOTECHNICAL AND FOUNDATION ENGINEERING INTRODUCTION TO SOIL MECHANICS SECOND FLOOR, SULTAN TOWER, ROORKEE – 247667 UTTARAKHAND PH: (01332) 266328 Web: www.amiestudycircle.com 26/56 AMIE(I) STUDY CIRCLE(REGD.) A Focused Approach WHATSAPP: +91-9412903929 AMIESTUDYCIRCLE.COM INFO@AMIESTUDYCIRCLE.COM
- 27. GEOTECHNICAL AND FOUNDATION ENGINEERING INTRODUCTION TO SOIL MECHANICS SECOND FLOOR, SULTAN TOWER, ROORKEE – 247667 UTTARAKHAND PH: (01332) 266328 Web: www.amiestudycircle.com 27/56 AMIE(I) STUDY CIRCLE(REGD.) A Focused Approach CHART FOR FINE GRAINED SOIL Following is a chart to classify a coarse grained soil. WHATSAPP: +91-9412903929 AMIESTUDYCIRCLE.COM INFO@AMIESTUDYCIRCLE.COM
- 28. GEOTECHNICAL AND FOUNDATION ENGINEERING INTRODUCTION TO SOIL MECHANICS SECOND FLOOR, SULTAN TOWER, ROORKEE – 247667 UTTARAKHAND PH: (01332) 266328 Web: www.amiestudycircle.com 28/56 AMIE(I) STUDY CIRCLE(REGD.) A Focused Approach Example What do you understand by the following terms: GP, SM, ML, OL, CI, Pt Solution GP : Poorly graded gravel SM : Silky sand ML : Low plasticity silt OL :Low plasticity organic silt CL : Inorganic clay; Pt : Peat and other inorganic solids Example Classify soils on the basis of the data provided, as per IS: 1498-1970. Soil wL wP % passing through 75 sieve % gravel > 4.75 mm % sand 4.75 mm to 0.075 mm A 450 50 100 0 0 B 34 20 80 0 20 Solution Soil A 75 fraction > 50%, it is a fine grained soil, wL = 450 %, IP = 400. The coordinates plot above A-line on the plasticity chart, in the CH region. It is, thus, an inorganic clay of high compressibility. Values of liquid limit and plastic limit are unusually high. Soil B 75 fraction > 50%. It is a fine grained soil. wL = 34%; IP = 14. The point lies above the A line but very close to the wL = 35% line. Hence, the soil can be assigned the dual symbol CL- CI. It is an inorganic clay of low to intermediate compressibility. Example (AMIE Winter 2011, 6 marks) A soil sample has a liquid limit of 20% and plastic limit of 12%. The following data are also available from sieve analysis: Sieve size % passing 2.032 mm 100 0.422 mm 85 0.075 mm 38 Classify the soil approximately according to Unified Classification or IS Classification. WHATSAPP: +91-9412903929 AMIESTUDYCIRCLE.COM INFO@AMIESTUDYCIRCLE.COM
- 29. GEOTECHNICAL AND FOUNDATION ENGINEERING INTRODUCTION TO SOIL MECHANICS SECOND FLOOR, SULTAN TOWER, ROORKEE – 247667 UTTARAKHAND PH: (01332) 266328 Web: www.amiestudycircle.com 29/56 AMIE(I) STUDY CIRCLE(REGD.) A Focused Approach Solution Since more than 50% of the material is larger than 75 size, the soil is a coarse-grained one. 100% material passes 2.032 mm sieve; the material passing 0.075 mm sieve is also included in this. Since this latter fraction any way passes this sieve, a 100% of coarse fraction also passes this sieve. Since more than 50% of coarse fraction is passing this sieve, it is classified as a sand. (This will be the same as the per cent passing 4.75 mm sieve). Since more than 12% of the material passes the 75- sieve, it must be SM or SC. Now it can be seen that the plasticity index, Ip is (20 - 12) = 8, which is greater than 7. Also, if the values of wL and Ip are plotted on the plasticity chart, the point falls above A-line. Hence the soil is to be classified as SC, as per IS classification. Even according to Unified Classification System, this will be classified as SC, which may be checked easily. WHATSAPP: +91-9412903929 AMIESTUDYCIRCLE.COM INFO@AMIESTUDYCIRCLE.COM
- 30. GEOTECHNICAL AND FOUNDATION ENGINEERING INTRODUCTION TO SOIL MECHANICS SECOND FLOOR, SULTAN TOWER, ROORKEE – 247667 UTTARAKHAND PH: (01332) 266328 Web: www.amiestudycircle.com 30/56 AMIE(I) STUDY CIRCLE(REGD.) A Focused Approach Permeability/Capillarity of Soil Since soils consists of discrete particles, the void spaces between the particles are interconnected and may be viewed as highly complex and intricate network of irregular tubes. In a two phase solid liquid system, these voids are completely filled by the liquid, which is water in most of the cases of soil mechanics. Water in these tubes is free to flow when a potential difference is created in a soil mass. Water flows from zones of higher potential to lower potential. Gravels are more pervious than sands, sands are more pervious than silts and silts are more pervious than clays. A loose sand is much more pervious then when it is dense. MEASUREMENT OF PERMEABILITY Laboratory Tests Constant Head Test. Constant head permeaters are specially suited to the testing of pervious, coarse grained soil. In highly impervious soils the quantity of water that can be collected will be small and, accurate measurements are difficult to make. Therefore, the constant head permeameter is mainly application cable to relatively pervious soils, although, theoretically speaking, it can be used for any type of soil. The soil sample is contained in a Perspex cylinder. Water is allowed to flow through the sample from a reservoir designed to keep the water level constant by over flow. The quantity of water flowing out of the soil or discharge Q during a given time t is collected in a vessel and weighed. Several such tests at varying rates of flow can be performed and the average value of k is determined. Now, from Darcy's law q = kiA Hence k = q/iA = Q.L/A.h.t cm/s where Q = discharge(cm3 ) collected in time t(sec) A = cross sectional area of sample(cm2 ) h = difference in manometer levels(cm) L = difference between manometer tapping points(cm) i = hydraulic gradient = h/L WHATSAPP: +91-9412903929 AMIESTUDYCIRCLE.COM INFO@AMIESTUDYCIRCLE.COM
- 31. GEOTECHNICAL AND FOUNDATION ENGINEERING INTRODUCTION TO SOIL MECHANICS SECOND FLOOR, SULTAN TOWER, ROORKEE – 247667 UTTARAKHAND PH: (01332) 266328 Web: www.amiestudycircle.com 31/56 AMIE(I) STUDY CIRCLE(REGD.) A Focused Approach Falling Head Test. This method is used to determine the permeability of fine grained soils such as fine sands, silts, and clays. In such soils, the permeability is too small to enable accurate measurement of discharge using constant head permeaters. A cylinder containing the soil sample is placed on a base(perforated disc) fitted with a fine gauge. The cylinder is fitted with a rubber stopper on top. A graduated standpipe of known diameter is inserted into the rubber stopper. The test is conducted by fitting the standpipe with desired water and allowing flow to take place through the sample. During the test, the water level will continuously drop and the height of water in the standpipe is recorded at several time intervals during the test. Any one pair of measurement, namely the time taken for the head to fall h1 to h2, will yield one value of k. The average value of k can be computed from several such readings. k = 2 1 a.L A( - )t t .loge 1 2 h h = 2 1 2.3.a.L A( - )t t .log10 1 2 h h Proof. From Darcy’s law, the discharge in unit time h q kiA k A L where h is the flow head at an intermediate time t between t1 and t2 corresponding to h1 anf h2. Referring to figure, if the level of water in the standpipe falls by dh in time dt, the flow in unit time through the sample = q = a x velocity of fall, i.e. –a(dh/dt), the negative sign indicating that the head decreases with time. Equating the two expressions dh h a k A dt L Rearranging and integrating 2 2 1 1 h t h t dh A a k dt h L Hence 1 1 e 10 2 1 2 2 1 2 h haL 2.3aL k log log A(t t ) h A(t t ) h If t2 – t1 = t 1 10 2 h2.3aL k log At h WHATSAPP: +91-9412903929 AMIESTUDYCIRCLE.COM INFO@AMIESTUDYCIRCLE.COM
- 32. GEOTECHNICAL AND FOUNDATION ENGINEERING INTRODUCTION TO SOIL MECHANICS SECOND FLOOR, SULTAN TOWER, ROORKEE – 247667 UTTARAKHAND PH: (01332) 266328 Web: www.amiestudycircle.com 32/56 AMIE(I) STUDY CIRCLE(REGD.) A Focused Approach Example In a falling head permeater test, the initial head (t = 0) is 40 cm. The head drops by 5 cm in 10 minutes. Calculate the time required to run the test for the final head to be 20 cm. If the sample is 6 cm in height and 50 cm2 in cross sectional area, calculate the coefficient of permeability, taking area of stand pipe = 0.5 cm2 . Solution In a time interval t = 10 minutes, the head drops from initial value of h1 = 40 to h2 = 40 – 5 = 35 cm. We have 1 10 2 hdL k 2.3 log At h or 1 1 10 10 2 2 h h2.3aL t log mlog Ak h h where 2.3aL m constant for the set up Ak 10 40 10 mlog 35 10 40 10 m 172.5 40 0.058log 35 1 1 10 10 2 2 h h t mlog 172.5log h h Now, let the time interval required for the head to drop from initial value of h1 = 40 cm to a final value of h2 = 20 cm, be t minutes. 10 40 t 172.5log 172.5x0.301 51.9 20 minutes Now 1 10 2 haL k 2.3 log At h 5 10 2.3x0.5x6 40 log 1.335x10 50x10x60 35 cm/sec. Problem A falling head permeater on test was performed on a soil sample of 5 cm diameter and 9 cm long. The area of the standpipe was 0.5 cm2 . During the test, the head fell from 50 to 30 cm in 4.5 min. Compute the value of k in cm/s. Answer: k = 4.33 x 10⁻⁴ cm/sec. WHATSAPP: +91-9412903929 AMIESTUDYCIRCLE.COM INFO@AMIESTUDYCIRCLE.COM
- 33. GEOTECHNICAL AND FOUNDATION ENGINEERING INTRODUCTION TO SOIL MECHANICS SECOND FLOOR, SULTAN TOWER, ROORKEE – 247667 UTTARAKHAND PH: (01332) 266328 Web: www.amiestudycircle.com 33/56 AMIE(I) STUDY CIRCLE(REGD.) A Focused Approach Field Tests Unconfined flow pumping test. The test conditions are shown in figure. Here the acquifer is underlain by an impermeable stratum and the test well extends to the bottom of the permeable stratum. The pumping generates a radial flow of water towards the filter well and as a result, the water table assumes a curved surface called drawdown water table. 10 2 1 2 2 2 1 log (r / r )q k 2.3 . (h h ) Confined Pumping Test : A confined flow condition occurs when the acquifer is confined both above and below by impermeable strata . Here, the drawdown surface is, for all values of r, above the upper surface of the acquifer. 2 1 10 2 1 (r / r )q k 2.3 log 2 D (h h ) Example For a field pumping test, a well was sunk through a horizontal stratum of sand 14.5m thick and underlain by a clay stratum. Two observation wells were sunk at horizontal distances of 16 m and 34m respectively from the pumping well, The initial position of the water table was 2.2m below ground level. At a steady-state pumping rate of 925 litres/min, the draw downs WHATSAPP: +91-9412903929 AMIESTUDYCIRCLE.COM INFO@AMIESTUDYCIRCLE.COM
- 34. GEOTECHNICAL AND FOUNDATION ENGINEERING INTRODUCTION TO SOIL MECHANICS SECOND FLOOR, SULTAN TOWER, ROORKEE – 247667 UTTARAKHAND PH: (01332) 266328 Web: www.amiestudycircle.com 34/56 AMIE(I) STUDY CIRCLE(REGD.) A Focused Approach in the observation wells were found to be 2.45m and 1.20m respectively. Calculate the coefficient of permeability of the sand. Solution For the case of unconfined flow of given figure 2 10 1 2 2 2 1 r log rq k 2.3 h h In this case, r1 = 16m; r2 = 34m h1 = 14.5 – 2.2 – 2.45 = 9.85m h2 = 14.5 – 2.2 – 1.2 = 11.10m 3 3 925 q m /s 10 x60 10 3 2 2 34 log 925 16k 2.3x 10 x60x 11.10 9.85 = 1.41 x 10⁻⁴ m/s or 1.41 x 10⁻² cm/s Problem An unconfined aquifer is known to be 32 m thick below the water table. A constant discharge of 2 cubic metres per minute is pumped out of the aquifer through a tubewell till the water level in the tubewell becomes steady. Two observation wells at distances of 15 m and 70 m from the tubewell show falls of 3 m and 0.7 m respectively from their static water levels. Find the permeability of the aquifer. Answer: 1.18 x 10⁻¹ mm/s FACTORS AFFECTING PERMEABILITY Effect of Grain Size k = CD10 where k has the unit cm/s, D10 is in mm, constant C varies from 0.4 to 1.2. WHATSAPP: +91-9412903929 AMIESTUDYCIRCLE.COM INFO@AMIESTUDYCIRCLE.COM
- 35. GEOTECHNICAL AND FOUNDATION ENGINEERING INTRODUCTION TO SOIL MECHANICS SECOND FLOOR, SULTAN TOWER, ROORKEE – 247667 UTTARAKHAND PH: (01332) 266328 Web: www.amiestudycircle.com 35/56 AMIE(I) STUDY CIRCLE(REGD.) A Focused Approach Effect of Temperature k w or 1 2 k k = w1 1 : w2 2 Since both viscosity and unit weight vary with temperature, k will be affected by changes in temperature. Viscosity effects are more important. Greater the viscosity, lower the permeability. Effect of Void Ratio For sands 1 2 k k = 3 1 1 e 1 + e : 3 2 2 e 1 + e Another relationship is k1:k2 = e1 2 :e2 2 For silts and clays, the above relationships are not reliable. For these, following relationship is valid log10k1:log10k2 = e1:e2 Example Due to rise of temperature, the viscosity and unit weight of the percolating fluid are reduced to 75 % and 97 % respectively. Other things being constant, calculate the percentage change in coefficient of permeability. Solution Let k1,γw1 and η1 represent the coefficient of permeability, weight and viscosity at the increased temperature. Dropping the suffix 1 to represent these quantities at the standard(or original) temperature, we have k = A. w and k1 = A. 1 w1 , where A = constant k k1 = 1 w1 x w k1 = k. w w1 . 1 Now, γw1 = 0.97.γw and η1 = 0.75 η k1 = k. 0.75 (0.97) 1 = 1.295 k Increase in k = 29.5 % WHATSAPP: +91-9412903929 AMIESTUDYCIRCLE.COM INFO@AMIESTUDYCIRCLE.COM
- 36. GEOTECHNICAL AND FOUNDATION ENGINEERING INTRODUCTION TO SOIL MECHANICS SECOND FLOOR, SULTAN TOWER, ROORKEE – 247667 UTTARAKHAND PH: (01332) 266328 Web: www.amiestudycircle.com 36/56 AMIE(I) STUDY CIRCLE(REGD.) A Focused Approach Example Estimate the coefficient of permeability for a uniform sand where a sieve analysis indicates that the D10 size is 0.12 mm. Solution D10 = 0.12 mm = 0.012 cm. According to Allen Hazen’s relationship, k = 100 D10 2 where k is permeability in cm/s and D10 is effective size in cm. ∴ k = 100 × (0.012)2 = 100 × 0.000144 = 0.0144 cm/s ∴ Permeability coefficient = 1.44 × 10⁻¹ mm/s. Example A cohesionless soil has a permeability of 0.036 cm per second at a void ratio of 0.36. Make predictions of the permeability of this soil when at a void ratio of 0.45 according to the two functions of void ratio that are proposed. Solution 3 3 1 2 1 2 1 2 : 1 1 e e k k e e 3 2 2 (0.36) (0.45) 0.036: : 0.546:1 136 145 k 1 2 0.36 6.60 10 / 0.546 k x mm s Also 2 2 20.036: (0.36) :(0.45)k k2 = 5.625 x 10⁻¹ mm/s Example The discharge of water collected from a constant head permeameter in a period of 15 minutes is 500 ml. The internal diameter of the permeameter is 5 cm and the measured difference in head between two gauging points 15 cm vertically apart is 40 cm. Calculate the coefficient of permeability. If the dry weight of the 15 cm long sample is 4.86 N and the specific gravity of the solids is 2.65, calculate the seepage velocity. WHATSAPP: +91-9412903929 AMIESTUDYCIRCLE.COM INFO@AMIESTUDYCIRCLE.COM
- 37. GEOTECHNICAL AND FOUNDATION ENGINEERING INTRODUCTION TO SOIL MECHANICS SECOND FLOOR, SULTAN TOWER, ROORKEE – 247667 UTTARAKHAND PH: (01332) 266328 Web: www.amiestudycircle.com 37/56 AMIE(I) STUDY CIRCLE(REGD.) A Focused Approach Solution Q = 500 ml: t = 15 x 60 = 900 s. A = (/4) x 52 = 6.2571 cm2 ; L = 15 cm ; L = 40 cm; 5000 15 / 0.106 / 6.25 900 QL x k cm s mm s Ath x x Superficial velocity 500 0.0283 / 0.283 / 900 6.25 Q v cm s mm s At x Dry weight of sample = 4.86 N Volume of sample =A.L= 6.25 x x 15 cm3 = 294.52 cm3 Dry density 3 34.86 / 16.5 / 294.52 d N cm kN m 1 w d G e 2.65 10 1 0.606 16.5 x e e 0.3773 1 e n e Seepage velocity / 0.283/ 0.3773 0.750 /sv v n mm s Problem The coefficient of permeability of a soil sample is found to be 9 × 10⁻² mm/s at a void ratio of 0.45. Estimate its permeability at a void ratio of 0.63. Answer: 21.7 × 10⁻² mm/s (from e3 formula)or 17.64 × 10⁻² mm/s (from e2 formula) PERMEABILITY OF STRATIFIED SOILS Horizontal Coefficient of Permeability(kH) Consider the section of a stratified soil mass. WHATSAPP: +91-9412903929 AMIESTUDYCIRCLE.COM INFO@AMIESTUDYCIRCLE.COM
- 38. GEOTECHNICAL AND FOUNDATION ENGINEERING INTRODUCTION TO SOIL MECHANICS SECOND FLOOR, SULTAN TOWER, ROORKEE – 247667 UTTARAKHAND PH: (01332) 266328 Web: www.amiestudycircle.com 38/56 AMIE(I) STUDY CIRCLE(REGD.) A Focused Approach Let the thickness of the layers be H1,H2.....Hn, and let k1,k2....kn be their respective coefficient of permeability. Or kH = 1 H .(k1H1 + k2H2 +.................knHn) Vertical Coefficient of Permeability (kv) In this case, the flow is taking place in one layer after another and continuity of flow requires the velocity of flow in each of the layers to be the same. The hydraulic gradients, on the other hand, change from layer to layer. kv = 1 1 2 2 n n H ( / ) + ( / ) + ....( / )H k H k H k Problem A sand deposit contains three distinct horizontal layers of equal thickness. The coefficient of permeability of the upper and lower layers is 10-3 cm/sec and that of the middle is 10-2 cm/sec. What are the values of the horizontal and vertical coefficients of permeability of the three layers, and what is their ratio. Answer: kH = 4 x 10⁻³ cm/sec, kV = 1.4 x 10⁻³ cm/sec, ratio = 2.86 CAPILLARITY The phenomenon in which water rises above the ground water table against the pull of gravity, but is in contact with the water table as its source, is referred to as ‘Capillary rise’ with reference to soils. The water associated with capillary rise is called ‘capillary moisture’. The phenomenon by virtue of which a liquid rises in capillary tubes is, in general, called ‘capillarity’. Rise of Water in Capillary Tubes The water is “pulled up” in the capillary tube to a height, dependent upon the diameter of the tube, the magnitude of surface tension, and the unit weight of water. The attraction between the water and capillary tube, or the tendency of water to wet the walls of the tube affects the shape of the air-water interface at the top of the column of water. For water and glass, the shape is concave as seen from top, that is, the water surface is lower at the centre of the column than at the walls of the tube. The resulting curved liquid surface is called the ‘meniscus’. The surface of the liquid meets that of the tube at a definite angle, known as the ‘contact angle’. This angle, incidentally, is zero for water and glass (see figure). The column of water in the capillary tube rises, against the pull of gravity, above the surface of the water source. For equilibrium, the effect of the downward pull of gravity on the capillary column of water has to be resisted by surface tension of the water film adhering to the wall of the tube to hold the water column. WHATSAPP: +91-9412903929 AMIESTUDYCIRCLE.COM INFO@AMIESTUDYCIRCLE.COM
- 39. GEOTECHNICAL AND FOUNDATION ENGINEERING INTRODUCTION TO SOIL MECHANICS SECOND FLOOR, SULTAN TOWER, ROORKEE – 247667 UTTARAKHAND PH: (01332) 266328 Web: www.amiestudycircle.com 39/56 AMIE(I) STUDY CIRCLE(REGD.) A Focused Approach If Ts is the surface tension, in force units per unit length, the vertical component of the force is given by cosc sd T where is the contact angle and dc is the diameter of the capillary tube. With water and glass, the meniscus is tangent to the wall surface, so that the contact angle, is zero. Therefore, the weight of a column of water, that is capable of being supported by the surface tension, is c sd T But the weight of water column in the capillary tube is 2 . . 4 c c w d h (1) Where w is the unit weight of water and hc is the capillary rise. This equation helps one in computing the capillary rise of water in a glass capillary tube. Capillary Rise in Soil The rise of water in soils above the ground water table is analogous to the rise of water into capillary tubes placed in a source of water. However, the void spaces in a soil are irregular in shape and size, as they interconnect in all directions. Thus, the equations derived for regular shaped capillary tubes cannot be, strictly speaking, directly applicable to the capillary phenomenon associated with soil water. However, the features of capillary rise in tubes facilitate an understanding of factors affecting capillarity and help determine the order of a magnitude for a capillary rise in the various types of soils. Equation (1) indicates that even relatively large voids will be filled with capillary water if soil is close to the ground water table. As the height above the water table increases, only the smaller voids would be expected to be filled with capillary water. The larger voids represent interference to an upward capillary flow and would not be filled. The soil just above the water table may become fully saturated with capillary water, but even this is questionable since it is dependent upon a number of factors. The larger pores may entrap air to some extent while getting filled with capillary water. Above this zone lies a zone of partial saturation due WHATSAPP: +91-9412903929 AMIESTUDYCIRCLE.COM INFO@AMIESTUDYCIRCLE.COM
- 40. GEOTECHNICAL AND FOUNDATION ENGINEERING INTRODUCTION TO SOIL MECHANICS SECOND FLOOR, SULTAN TOWER, ROORKEE – 247667 UTTARAKHAND PH: (01332) 266328 Web: www.amiestudycircle.com 40/56 AMIE(I) STUDY CIRCLE(REGD.) A Focused Approach to capillarity. In both these zones constituting the capillary fringe, even absorbed water contributes to the pore water (see figure). In the zone of partial saturation due to the capillary phenomenon, capillary movement of water may occur even in the wedges of the capillary V formed wherever soil grains come into contact (see figure). This is referred to as “Contact Moisture”. Since void spaces in soil are of the same order of magnitude as the particle sizes, it follows hat the capillary rise would be greater in fine-grained soils than in coarse-grained soils. Temperature plays an important role in the capillary rise in soil. At lower temperature capillary rise is more and vice versa. Capillary flow may also be induced from a warm zone towards a cold zone. It is to be noted that the negative pressures in the pore water in the capillary zone transfers a compressive stress of equal magnitude on to the mineral skeleton of the soil. Thus, the maximum increase in inter angular pressure in the capillary zone is given by : .c c wh (2) Example To what height would water rise in a glass capillary tube of 0.01 mm diameter ? What is the water pressure just under the meniscus in the capillary tube? Solution Capillary rise 6 6 4 4 73 10 3000 9.81 10 0.001 s c w c T x x h mm d x x Water pressure just under the meniscus in the tube = 3000 × 9.81 × 10-6 N/mm2 = 3 x 9.81 kN/m2 = 27.43 kN/m2 WHATSAPP: +91-9412903929 AMIESTUDYCIRCLE.COM INFO@AMIESTUDYCIRCLE.COM
- 41. GEOTECHNICAL AND FOUNDATION ENGINEERING INTRODUCTION TO SOIL MECHANICS SECOND FLOOR, SULTAN TOWER, ROORKEE – 247667 UTTARAKHAND PH: (01332) 266328 Web: www.amiestudycircle.com 41/56 AMIE(I) STUDY CIRCLE(REGD.) A Focused Approach Example What is the height of capillary rise in a soil with an effective size of 0.06 mm and void ratio of 0.63 ? Solution Effective size = 0.06 mm Solid volume (0.06)3 Void volume per unit of solid volume 0.63(0.06)3 Average void size dc = (0.63)1/3 × 0.06 mm = 0.857 × 0.06 = 0.0514 mm Capillary rise 6 6 4 4 73 10 58 9.81 10 0.0514 s c w c T x x h m d x x Example The effective sizes of two soils are 0.05 mm and 0.10 mm, the void ratio being the same for both. If the capillary rise in the first soil is 72 cm, what would be the capillary rise in the second soil ? Solution Effective size of first soil = 0.05 mm Solid volume (0.05)3 Void volume e(0.05)3 Average pore size 1/3 0.05cd e x mm Capillary rise of 4 s c w c T h d 1 c c h d Since the void ratio is the same for the soils, average pore size for the second soil = 1/3 0.10e x Substituting 4 s c w c T h d = 36 cm since dc for the second soil is double that of the first soil and since 1 c c h d . WHATSAPP: +91-9412903929 AMIESTUDYCIRCLE.COM INFO@AMIESTUDYCIRCLE.COM
- 42. GEOTECHNICAL AND FOUNDATION ENGINEERING INTRODUCTION TO SOIL MECHANICS SECOND FLOOR, SULTAN TOWER, ROORKEE – 247667 UTTARAKHAND PH: (01332) 266328 Web: www.amiestudycircle.com 42/56 AMIE(I) STUDY CIRCLE(REGD.) A Focused Approach Problem A glass tube of 0.02 mm diameter. What is the height to which water will rise in this tube by capillarity action ? What is the pressure just under the meniscus ? Answer: 14.71 kN/m2 Problem The effective sizes of two sands are 0.09 mm and 0.54 mm. The capillary rise of water in the first sand is 480 mm. What is the capillary rise in the second sand, if the void ratio is the same for both sands ? Answer: 80 mm VALIDITY OF DARCY’S LAW Reynolds found a lower limit of critical velocity for transition of the flow from laminar to a turbulent one. Many researchers have attempted to use Reynolds' concept to determine the upper limit of the validity of Darcy's law. The values of R for which the flow in porous media become turbulent have been measured as low as 0.1 and as high as 75. The probable reason that porous media do not exhibit a definite critical Reynold's number is because soil can be no means be accurately represented as a bundle of straight tubes. There is overwhelming evidence which shows that Darcy's law holds in silts as well as medium sands and also for a steady state flow through clays. For soils more pervious than medium sand, the actual relationship between the hydraulic gradient and velocity should be obtained only through experiments for the particular soil and void ratio under study. WHATSAPP: +91-9412903929 AMIESTUDYCIRCLE.COM INFO@AMIESTUDYCIRCLE.COM
- 43. GEOTECHNICAL AND FOUNDATION ENGINEERING INTRODUCTION TO SOIL MECHANICS SECOND FLOOR, SULTAN TOWER, ROORKEE – 247667 UTTARAKHAND PH: (01332) 266328 Web: www.amiestudycircle.com 43/56 AMIE(I) STUDY CIRCLE(REGD.) A Focused Approach Vertical Stress Distribution in Soils BOUSSINESQ EQUATIONS The vertical stress z at a point O located at depth z and a horizontal distance r from the point of application of the point load Q is shown below. Now 5 z 2 3Q cos 2 z The above equation can be modified as below: Since 2 2 1/ 2 z z cos R (r z ) 5/23 z 5 2 2 3Qz 3Q 1 2 R 2 z 1 (r / z) VERTICAL STRESS DISTRIBUTION DIAGRAMS With the help of Boussinesq equation for vertical stress, the following diagrams can be presented graphically after making necessary computations: vertical stress isobar diagram vertical stress distribution on a horizontal plane z units below the ground surface vertical stress distributed with depth, a a distance r away from the line of action of the single, vertical, concentrated load Q An isobar is a stress contour – it is a line joining all points of equal vertical stress below the ground surface. Obviously, for a particular load system, many isobars can be drawn for WHATSAPP: +91-9412903929 AMIESTUDYCIRCLE.COM INFO@AMIESTUDYCIRCLE.COM
- 44. GEOTECHNICAL AND FOUNDATION ENGINEERING INTRODUCTION TO SOIL MECHANICS SECOND FLOOR, SULTAN TOWER, ROORKEE – 247667 UTTARAKHAND PH: (01332) 266328 Web: www.amiestudycircle.com 44/56 AMIE(I) STUDY CIRCLE(REGD.) A Focused Approach different chosen values of stresses. The smaller the magnitude of the selected stress, the greater the depth upto which an isobar extends. Since the vertical stress on a given horizontal plane is the same in all directions at points located at equal radial distances from the axis of loading, an isobar is really a spatial, curved surface of the shape of an onion bulb. Hence, in literature, an isobar is often termed the pressure bulb. Within a pressure bulb, a soil mass will be stressed to stresses higher than the designated stress of the pressure bulb, while the soil mass beyond the pressure bulb will be stressed to lower stresses. LINE LOAD If the line load is of intensity q per unit length parallel to y-axis on the surface of a semi- infinite elastic medium, the vertical stress z at a point O, as shown in figure, is given by 4 z 2 q cos z Vertical stress due to line load This equation may also be expressed in the form 2 z 2 q 2 1 . z x 1 z (1) Where z is the depth of point O, and x is the horizontal distance of O along x-axis from the line load. STRIP LOAD The vertical stress z at a point O, due to a uniform load of intensity q on a strip of width B and semi-infinite length (see figure) is given by z q sin cos2 (a) WHATSAPP: +91-9412903929 AMIESTUDYCIRCLE.COM INFO@AMIESTUDYCIRCLE.COM
- 45. GEOTECHNICAL AND FOUNDATION ENGINEERING INTRODUCTION TO SOIL MECHANICS SECOND FLOOR, SULTAN TOWER, ROORKEE – 247667 UTTARAKHAND PH: (01332) 266328 Web: www.amiestudycircle.com 45/56 AMIE(I) STUDY CIRCLE(REGD.) A Focused Approach Vertical stress due to strip load If the point O is directly below the centre of the strip, i.e. = 0, above eq. (a) assumes the form of eq. (b) given below: z q sin (b) Where is the angle in radians subtended by the width of strip at O. UNIFORMLY LOADED CIRCULAR AREA Consider a uniform load of intensity q action over a circular area of radius R on the surface of a semi-infinite soil mass (see figure). The vertical stress z at point O directly below the center of the laded area and at a depth z is given by 3 2 z 2 1 q 1 R 1 z Example (AMIE W08, 7 marks) Derive an expression for determination of vertical pressure under a uniformly loaded circular area. Solution Let the circular area of radius a be loaded uniformly with q per unit area as shown in figure. Let us consider an elementary ring of radius r and thickness dr of the loaded area. This ring may be imagined to be further divided into elemental areas, each A; the load from such an elemental area is q . A. The vertical stress zat point A, at a depth z below the centre of the loaded area, is given by: WHATSAPP: +91-9412903929 AMIESTUDYCIRCLE.COM INFO@AMIESTUDYCIRCLE.COM
- 46. GEOTECHNICAL AND FOUNDATION ENGINEERING INTRODUCTION TO SOIL MECHANICS SECOND FLOOR, SULTAN TOWER, ROORKEE – 247667 UTTARAKHAND PH: (01332) 266328 Web: www.amiestudycircle.com 46/56 AMIE(I) STUDY CIRCLE(REGD.) A Focused Approach 3 2 2 5/2 3( . ) . 2 ( ) z q A z r z The stress zd due to the entire ring is given by 3 3 2 2 5/2 2 2 5/2 3 3 ( ). (2 ). 2 ( ) 2 ( ) z q z q z d A rdr r z r z 3 2 2 5/2 3 . ( ) z qz rdr d r z The total vertical stress z at A due to entire loaded area is obtained by integrating dz within the limits r = 0 to r = a. 3 2 2 5/20 3 ( ) r a z r rdr qz r z Setting 2 2 2 , .r z R rdr R dR , the limits for R will be z and 2 2 1/2 ( )a z 2 2 1/2 ( ) 3 3 4 3 2 2 3/2 2 3/2 1 1 1 3 1 ( ) 1 [( / ) ] R a z z R z dR qz qz q R z a z a z Example An elevated structure with a total weight of 10,000 kN is supported on a tower with 4 legs. The legs rest on piers located at the corners of a square 6 m on a side. What is the vertical stress increment due to this loading at a point 7 m beneath the centre of the structure ? Solution Weight transferred to each pier = 2500 kN. The load can be approximated to a point load acting at the corners of a square of 6 m side. The vertical stress is to be calculated at 7 m WHATSAPP: +91-9412903929 AMIESTUDYCIRCLE.COM INFO@AMIESTUDYCIRCLE.COM
- 47. GEOTECHNICAL AND FOUNDATION ENGINEERING INTRODUCTION TO SOIL MECHANICS SECOND FLOOR, SULTAN TOWER, ROORKEE – 247667 UTTARAKHAND PH: (01332) 266328 Web: www.amiestudycircle.com 47/56 AMIE(I) STUDY CIRCLE(REGD.) A Focused Approach depth. Horizontal distance r from each of the load is equal to 2 2 3 3 18 4.243m (see figure) 5 2 z 22 3Q 1 2 z r 1 z Q = 2500 kN, z = 7 m r = 4.243 m Hence vertical stress increase due to the total weight is equal to 5 2 2 22 4x3x2500 1 4x11.143 44.57kN / m 2 x7 4.243 1 7 Example A raft of size 4 m × 4 m carries a uniform load of 200 kN/m2 . Using the point load approximation with four equivalent point loads, calculate the stress increment at a point in the soil which is 4 m below the centre of the loaded area. Solution Depth below the centre Q of the loaded area (raft) = 4m. Dividing the loaded area into four equal squares of 2 m size, as shown in figure, the load from each small square may be taken to act through its centre. Thus, the point loads at A, B, C and D are each: 200 × 4 = 800 kN The radial distance r to 0 for each of the loads is 2 m 2 1 4 2 2 r z WHATSAPP: +91-9412903929 AMIESTUDYCIRCLE.COM INFO@AMIESTUDYCIRCLE.COM
- 48. GEOTECHNICAL AND FOUNDATION ENGINEERING INTRODUCTION TO SOIL MECHANICS SECOND FLOOR, SULTAN TOWER, ROORKEE – 247667 UTTARAKHAND PH: (01332) 266328 Web: www.amiestudycircle.com 48/56 AMIE(I) STUDY CIRCLE(REGD.) A Focused Approach By symmetry the stress z at 0 at 4 m depth is four times that caused by one load. 2 2 5/2 4 800 (3/ 2 ) . 71.44 / 4 4 [1 (1/ 2 2) ] z x kN m x Example A circular area on the surface of an elastic mass of great extent carries a uniformly distributed load of 120 kN/m2 . The radius of the circle is 3 m. Compute the intensity of vertical pressure at a point 5 metres beneath the centre of the circle using Boussinesq’s method. Solution Radius ‘a’ of the loaded area = 3 m q = 120 kN/m2 z = 5 m 2 2 3/2 2 3/2 1 1 1 120 1 44.3 / [1 ( / ) ] [1 (3/ 5) ] z q kN m a z Problem Three concentrated loads of 3000 kN, 1000 kN and 2000 kN, spaced at 4.5 m and 3.5 m between the first and second and third loads, are acting in one vertical plane at the surface of a soil mass. Calculate the resultant vertical stress produced by these loads on a horizontal plane 1.5 m below the surface, at points directly below the loads and also halfway between them. Answer: below 3000 kN load: z = 637.4 kN/m2 ; below 1000 kN load: z = 218.2 kN/m2 ; below 2000 kN load: z = 426.6 kN/m2 . Midway between 3000 kN and 1000 kN loads: z = 45 kN/m2 ; midway between 1000 kN and 2000 kN loads: z = 74.8 kN/m2 WHATSAPP: +91-9412903929 AMIESTUDYCIRCLE.COM INFO@AMIESTUDYCIRCLE.COM
- 49. GEOTECHNICAL AND FOUNDATION ENGINEERING INTRODUCTION TO SOIL MECHANICS SECOND FLOOR, SULTAN TOWER, ROORKEE – 247667 UTTARAKHAND PH: (01332) 266328 Web: www.amiestudycircle.com 49/56 AMIE(I) STUDY CIRCLE(REGD.) A Focused Approach ASSIGNMENT PHASE RELATIONSHIP Q.1. (AMIE W14, 4 marks): Define the terms (i) relative density (ii) dry density (iii) activity (iv) sensitivity. Q.2. (AMIE W07, 5 marks): Derive the relation d = Gw/(1 + e). Q.3. (AMIE S09, 6 marks): Derive the following relation, with usual notation (1 ) (1 ) b w G w e Where b is bulk density. Q.4. (AMIE S08, 12, 8 marks): Derive the following relation with usual notation 1 (1 ) r w w S r w r G Q.5. (AMIE W09, S11, 6 marks): Establish a relationship between d, G, w, na and w. Q.6. (AMIE S05, 5 marks): For a soil, the following are given: Gs = 2.67, soil = 17.6 kN/m3 and moisture content = 10.8%. Determine (i) dry unit weight (ii) void ratio (iii) porosity (iv) degree of saturation. Answer: 15.88 kN/m3 , 0.649, 39.40%, 44.43% Q.7. (AMIE W11, 8 marks): The porosity of a soil sample is 35% and the specific gravity of its particles is 2.7. Calculate its void ratio, dry unit weight, saturated unit weight and submerged unit weight. Also, calculate the bulk unit weight of soil, if its degree of saturation is 50%. Answer: 0.54, 17.20 kN/m3 , 20.64 kN/m3 , 10.83 kN/m3 , 19.29 kN/m3 Q.8. (AMIE S06, 7 marks): In a bulk density determination test a sample of clay with a mass of 68.39 was coated with paraffin wax. The combined mass of the clay and the wax was 690.6 g. The volume of the clay and the wax was found to be 350 ml. The sample was broken open and the moisture content and specific gravity were found. The values were 17% and 2.73 respectively. The specific gravity of the wax was 0.89. Determine the bulk density, void ratio and degree of saturation of the soil. Answer: 1.99 g/cc, 0.605, 76.71% Q.9. (AMIE S07, W07, 7 marks): A soil sample, in its natural state, has a mass of 2.29 kg and volume of 1.15 x 10⁻³ m3 . Under an oven dried state, the dry mass of the sample is 2.035 kg. The specific gravity of the solid is 2.68. Determine its bulk density, water content, void ratio, porosity, degree of saturation and air content. Answer: 19.913 kN/m3 , 12.53%, e = 0.485, = 32.66%, Sr = 69.2%, ac = 30.8% Q.10. (AMIE S12, 10 marks): A moist soil sample weighs 3.52 N. After drying in an oven, its weight is reduced to 2.9 N. The specific gravity of solids and the mass specific gravity are 2.65 and 1.85, respectively. Determine the water content, void ratio, porosity, and degree of saturation. Take w = 10 kN/m3 . Answer: 21.38%, 0.74, 42.53, 76.56% Q.11. (AMIE S07, W07, 10 marks): The dry unit weight of a sand sample in the loosest state is 13.34 kN/m3 and in the densest state is 21.19 kN/m3 . Determine the density index of this sand when it has a porosity of 33%. Assume the gram specific gravity as 2.68. Answer: 65.8% Q.12. (AMIE W10, 8 marks): A sample of sand above water table was found to have a natural moisture content of 15% and a unit weight of 18.84 kN/m3 . Laboratory tests on a dried sample indicated values of 0.5 and WHATSAPP: +91-9412903929 AMIESTUDYCIRCLE.COM INFO@AMIESTUDYCIRCLE.COM
- 50. GEOTECHNICAL AND FOUNDATION ENGINEERING INTRODUCTION TO SOIL MECHANICS SECOND FLOOR, SULTAN TOWER, ROORKEE – 247667 UTTARAKHAND PH: (01332) 266328 Web: www.amiestudycircle.com 50/56 AMIE(I) STUDY CIRCLE(REGD.) A Focused Approach 0.85 for minimum and maximum values of void ratios, respectively for densest and loosest states. Calculate the degree of saturation and relative density. G = 2.65. Answer: 67.74%, 75.14% Q.13. (AMIE S08, 8 marks): What would be the maximum porosity for a uniformly graded sand having perfectly spherical particles. Q.14. (AMIE W08, 8 marks): A borrow pit is having natural moisture content as 15% and unit weight of 17 kN/m3 . Soil of volume 2000 m3 has been excavated from it for using in an embankment to be compacted at a porosity of 30%. Determine the volume of soil in compacted embankment on the assumption that there is no change in dry mass and moisture content of soil. The relative density of the soil is 2.68. Determine the degree of saturation and air content of the soil in the borrow pit and in the embankment. Answer: 19628 m3 , S = 0.98, air content = 2% Q.15. (AMIE S09, 5 marks): An embankment under construction has a bulk unit weight of 16 kN/m3 and moisture content of 10%. Compare the quantity of water (in litres) to be added per cubic metre of earth to raise its moisture content to 14% at the same void ratio. Answer: 59 litres Q.16. (AMIE W09, 6 marks): A sample of saturated soil has a water content of 25% and a bulk unit weight of 20 kN/m3 . Determine dry unit weight, void ratio and specific gravity of solid particles. What would be the bulk unit weight of the same soil at the same void ratio but at a degree of saturation of 80%? Answer: 15.99 kN/m3 , 0.67, 2.67, 19.20 kN/m3 Q.17. (AMIE S10, 8 marks): A field density test was conducted by core cutter method and following data were obtained: Weight of empty core cutter = 2280 g Weight of soil and core cutter = 5005 g Inside diameter of the core cutter = 90.00 mm Height of core cutter = 180 mm Weight of wet sample for water content determination = 54.00 g Weight of dry soil after over drying = 51.12 g Specific gravity of soil grains = 2.70 Determine (i) dry density (ii) void ratio (iii) degree of saturation (iv) water content at full saturation. Answer: 2.25 g/cm3 , 0.1772, 85.78 Q.18. (AMIE S11, 6 marks): Determine the dry unit weight, void ratio and degree of saturation of a soil specimen with a water content of 10% and a wet unit weight of 20 kN/m3 . Take specific gravity of solids as 2.70 and w = 10 kN/m3 . Answer: 18.18 kN/m3 , 0.49, 55.1% Q.19. (AMIE W12, 8 marks): A soil sample is partially saturated. Its natural water content is found to be 22% and bulk density 2 g/cc. If the specific gravity of solids be 2.65, find the degree of saturation and void ratio. If the soil is saturated, what will be its saturated unit weight? Answer: 94.57%, 0.6165, 19.82 kN/m3 Q.20. (AMIE W12, 8 marks): A moist soil sample weighs 4 N. After drying in an oven, its weight is reduced to 3 N. The specific gravity of solids and the mass specific gravity arc 2.65 and 1.85, respectively. Determine the water content, void ratio, porosity, and the degree of saturation. Take =10 kN/m3 . WHATSAPP: +91-9412903929 AMIESTUDYCIRCLE.COM INFO@AMIESTUDYCIRCLE.COM
- 51. GEOTECHNICAL AND FOUNDATION ENGINEERING INTRODUCTION TO SOIL MECHANICS SECOND FLOOR, SULTAN TOWER, ROORKEE – 247667 UTTARAKHAND PH: (01332) 266328 Web: www.amiestudycircle.com 51/56 AMIE(I) STUDY CIRCLE(REGD.) A Focused Approach Answer: 33.33%, 0.91, 0.4764 or 47.64%, 0.9706 or 97.06% Q.21. (AMIE S13, 6 marks): The dry unit weight of a soil having 15% moisture content is 17.5 kN/m3 . Find bulk unit weight, saturated unit weight and submerged unit weight. Assume G = 2.7. Answer: 20.125 kN/m3 , 20.83 kN/m3 , 11.02 kN/m3 Q.22. (AMIE S14, 5 marks): Water content in a saturated soil sample is 25 % and it has a bulk unit weight of 20 kN/m3 . Find the dry density, void ratio and specific gravity of soil solid particles. Q.23. (AMIE S14, 10 marks): Soil, 2000 m3 in volume, is excavated from a borrow pit where the natural moisture content, w,, is 15% and the unit weight, r, is 17 kN/m3 . Soil so excavated has been used in an embankment compacted at a porosity of 30 %. What will be the volume of compacted embankment, assuming no change in dry mass and moisture content of soil ? Relative density, G, is 2.68. Also, find the degree of saturation and air content of the borrow pit and the embankment. Q.24. (AMIE S14, 5 marks): A sample of sand has a volume of 1000 ml in natural state Its maximum volume when compacted is 840 ml. When gently poured in a measuring cylinder, its maximum volume is 1370 ml. Determine the relative density. Q.25. (AMIE W13, 8 marks): A wet sample, weighing 23 N, had a volume of 1150 cm3 . After oven drying, its weight is reduced to 19.6 N. The specific gravity of solids was found to be 2.65. Determine (i) water content, (ii) bulk unit weight, (iii) dry unit weight, (iv) saturated unit weight, (v) effective unit weight, (vi) void ratio, (vii) porosity, and (vii) degree of saturation. Answer: 17.35%, 20 kN/m3 , 17.04 kN/m3 , 20.39 kN/m3 , 10.58 kN/m3 , 0.53, 0.35, 87% Q.26. (AMIE W14, 8 marks): To construct a subgrade from chainage of 5.55 km to 6.00 km along the alignment of a road, estimated volume of the subgrade is 15500 m3 while the placement dry density is 18.5 kN/m3 . If the field material is to be collected from a borrow pit having in situ void ratio of 0.80. calculate the range of volume of soil to be excavated from the pit. Specific gravity of soil solids in the pit area ranges between 2.62 and 2.72. CONSISTENCY OF SOIL Q.27. (AMIE S05, 5 marks): Define the following 1. flow index 2. toughness index 3. liquidity index 4. plasticity index 5. uniformity coefficient 6. relative density Q.28. (AMIE W05, 3 marks): Differentiate between flow index and plasticity index. Q.29. (AMIE S06, 5 marks): Draw a sketch of the plasticity chart and explain how it is useful in the classification of fine grained soils as per I.S. classification system. Q.30. (AMIE S08, 6 marks): What is flow index? Show the changes in the volume of soil with the variation in water content. Q.31. (AMIE S09, 9 marks): The natural moisture of an excavated soil is 32%. Its liquid limit is 60% and plastic limit is 27%. Determine the plasticity index, liquidity index and consistency of soil. Answer: 33%, 15.15%, 84.85% Q.32. (AMIE W06, 5 marks): Determine the liquid limit (Wl) and plasticity index (Ip) of a soil whose test data is as following: WHATSAPP: +91-9412903929 AMIESTUDYCIRCLE.COM INFO@AMIESTUDYCIRCLE.COM
- 52. GEOTECHNICAL AND FOUNDATION ENGINEERING INTRODUCTION TO SOIL MECHANICS SECOND FLOOR, SULTAN TOWER, ROORKEE – 247667 UTTARAKHAND PH: (01332) 266328 Web: www.amiestudycircle.com 52/56 AMIE(I) STUDY CIRCLE(REGD.) A Focused Approach Test No. 1 2 3 4 5 No. of blows (N) 56 46 32 22 15 Water content 24 30 36 42 49 The plastic limit value of the soil (WP) = 24%. Compute flow index and toughness index of the soil. Answer: 36.87, 0.43 Q.33. (AMIE S07, W07, 8 marks): Following observations were obtained from a liquid limit test of a soil: Number of blows 10 20 30 40 Water Content (%) 82 74 68 65 Two tests for plastic limit were done which gave values of 28.2 and 29.4 respectively. Plot the flow curve and determine the liquid limit, plasticity index and flow index of the soil. Answer: LL = 71%, 42.8, 28.27% Q.34. (AMIE W14, 8 marks): Oven dry mass of a pat of clay is 10.8 g and mass of the mercury displaced on immersion is 84.2 g. Assuming specific gravity of the soil solids as 2.72. calculate shrinkage limit of the soil. If liquid limit and plastic limit of the soil are 52% and 24%. respectively, classify the soil as per relevant IS code. PERMEABILITY/CAPILLARITY Q.35. (AMIE S05, 4 marks): Define “permeability” and how would you determine it in the field. Q.36. (AMIE S10, 7 marks): Derive an expression for average permeability of layered soil when (i) flow parallel to the bending plane (ii) flow perpendicular to the bedding plane. Q.37. (AMIE W06, 5 marks): Describe the laboratory method of determining permeability of soils by falling head method as per IS:2720 (Part 17) 1986. For what kind of soils, this test is used? Q.38. (AMIE W14, 3 marks): State the reasons for not using constant head permeameter for finding coefficient of permeability of cohesive soils. Q.39. (AMIE W09, S12, 7 marks): If the time intervals of drop in heads from h1 to h2 and h2 to h3 are equal in a falling head permeater, prove that 2 1 3h h h Q.40. (AMIE W08, 11, 6 marks): Describe in brief the factors affecting permeability of soils. Q.41. (AMIE W13, 8 marks): In a stratified soil strata of two layers are having permeability k1 and k2 with equal thickness H. If the ratio of equivalent permeability in horizontal direction to that in vertical direction is unity, find the ratio of k1/k2. Answer: 1 Q.42. (AMIE S13, 14, 5 marks): Critically evaluate validity of Darcy’s law. Q.43. (AMIE S06, 8 marks): In a constant head permeability test conducted on a medium silt, the following data was found: Head maintained = 60 cm Diameter of the permeability meter = 10 cm Thickness of the soil specimen = 10 cm Discharge collected in 2.50 min = 10 cc WHATSAPP: +91-9412903929 AMIESTUDYCIRCLE.COM INFO@AMIESTUDYCIRCLE.COM
- 53. GEOTECHNICAL AND FOUNDATION ENGINEERING INTRODUCTION TO SOIL MECHANICS SECOND FLOOR, SULTAN TOWER, ROORKEE – 247667 UTTARAKHAND PH: (01332) 266328 Web: www.amiestudycircle.com 53/56 AMIE(I) STUDY CIRCLE(REGD.) A Focused Approach If a falling head test is conducted on the same sample what time would be required for the head to fall from 60 to 30 cm in the stand pipe which has a cross section area of 1.25 cm? Answer: 12.98 sec. Q.44. (AMIE W11, 6 marks): A sample in a variable head permeameter is 80 mm in diameter and 100 mm high. The permeability of the sample estimated to be 10 x 10-3 mm/s, if it is desired that the head in the stand pipe should fall from 240 mm to 120 mm in 180 sec. Determine the size of the stand pipe which should be used. Answer: 13 mm Q.45. (AMIE S07, W07, 10, 5 marks): A horizontal stratified soil deposit consists of three layers each uniform in itself. The permeabilities of three layers are 8 x 10⁻⁴ cm/s, 52 x 10-4 cm/s and 6 x 10⁻⁴ and their thicknesses are 7 m, 3 m and 10 m respectively. Find the effective average permeability of the deposit in horizontal and vertical direction. Answer: 13.6 x 10⁻³ mm/s, 7.7 x 10⁻³ mm/s Q.46. (AMIE S09, 6 marks): A sand deposit contains three distinct horizontal layers of equal thickness. The coefficient of permeability of upper and lower layer is 10-3 cm/sec and that of the middle is 10-2 cm/sec. What are the values of horizontal and vertical coefficient of permeability of three layers? Answer: 0.004 cm/sec, 0.0014 cm/sec Q.47. (AMIE S12, 6 marks): The coefficient of permeability of a soil at a void ratio of 0.7 is 4 x 10⁻⁴ cm/sec. Estimate its value at a void ratio of 0.50. Answer: 1.65 x 10⁻⁴ cm/sec. Q.48. (AMIE S12, 10 marks): A 5 m thick aquifer is confined at both top and bottom by practically impervious strata. The top impervious stratum is 6 m thick. A test well is sunk into the lower impervious stratum. Initially the water-level stands in test well at a depth of 1.5 m below the ground surface. Two piezometers are radially installed at distances of 12 m and 60 m from the test well. The piezometric surface stands at 3.3 m and 1.9 m below the ground surface in two respective piezometers when a steady discharge is established. If the permeability is 2.45 x 10⁻⁴ m/s, find the yield of the well. Answer: 9.242 x 10⁻³ m3 /sec Q.49. (AMIE W09, 5 marks): Discuss the phenomenon of capillary rise in solids. What are the factors affecting the height of capillary rise? Q.50. (AMIE W08, S09, 8 marks): Derive an expression for capillary rise and thereby obtain the expression for maximum capillary rise. Q.51. (AMIE S12, 6 marks): The capillary rise in a silt is 50 cm and that in fine sand is 30 cm. What is the difference in the pore size of two walls? Answer: 0.00992 cm Q.52. (AMIE S08, 4 marks): The soil X with an effective size of 0.02, shows a capillary rise of 50 mm. What would be the capillary rise in a similar soil Y with an effective size of 0.04 mm? Answer: 25 mm Q.53. (AMIE W12, 9 marks): A bed of sand consists of three horizontal layers of equal thickness. The value of coefficient of permeability for the upper and lower layers is 1 x 10⁻³ mm/s and of the middle layer is 0.1 mm/s. What is the ratio of effective permeability of the bed in the horizontal direction to that in the vertical direction ? Derive the equations used, if any. Q.54. (AMIE W13, 9 marks): A constant head permeability lest was carried out on a sandy soil sample of 160 mm in length and 6000 mm2 in cross-sectional area. The sample had a porosity of 40%. Under a constant head of 300 mm, the discharge was found to be 45 x 103 mm3 in 18 s. Calculate the coefficient of permeability. Also, WHATSAPP: +91-9412903929 AMIESTUDYCIRCLE.COM INFO@AMIESTUDYCIRCLE.COM
- 54. GEOTECHNICAL AND FOUNDATION ENGINEERING INTRODUCTION TO SOIL MECHANICS SECOND FLOOR, SULTAN TOWER, ROORKEE – 247667 UTTARAKHAND PH: (01332) 266328 Web: www.amiestudycircle.com 54/56 AMIE(I) STUDY CIRCLE(REGD.) A Focused Approach evaluate the discharge velocity and seepage velocity during the test. Estimate the coefficient of permeability of another sample of the same soil but with a porosity of 30%. Answer: k = 10-7 mm/s, v = Q/At = 8.33 x 10⁻⁷ mm/s, vs = v/n = 2.08 x 10⁻⁶ mm/s, another sample, k = 3.328 x 10⁻⁷ mm/s GRAIN SIZE DISTRIBUTION Q.55. (AMIE S07, 5 marks): Describe briefly the wet analysis of soil using hydrometer. Q.56. (AMIE W14, 5 marks): State Stoke's law and assumptions made in hydrometer analysis Tor grain size distribution analysis of soil. Q.57. (AMIE W05, 4 marks): In hydrometer test, the initial reading is 1.04. After 1 hour the corrected hydrometer reading is 1.02 and the corresponding effective depth is 10 cm. Find the initial weight of the soil placed in 1000 cc suspension, the particle size corresponding to the 15 minutes reading and percentage of particles finer than this size. Take G = 2.65 and = 0.1 Poise. Answer: 32.12 gm, 0.035 mm, 51% Q.58. (AMIE W06, 13 marks): Plot the particle size distribution curves of the following soils: Sieve Size (mm) Soil A Soil B Soil C 20 100 93 100 10 100 85 100 4.75 100 75 100 2.40 92 66 100 1.20 85 53 90 0.60 78 45 67 0.30 72 32 41 0.15 62 15 23 0.075 53 3 12 5 microns 23 - 3.5 2 microns 12 - 2 Plasticity Index, Ip 45 - 20 Obtain the following data for each type of soil from the graph: (ii) effective size (iii) coeff. Of uniformity Cu (iv) CG = coeff of gradation (v) Percentage of gravel, sand, silt and clay content in each soil (vi) Activity of soils Discuss the values obtained. Q.59. (AMIE W08, 5 marks): Determine the uniformity coefficient and the coefficient of curvature of a soil having effective size as 0.14 mm; 30 % finer size (D30) as 0.38 mm and 60% finer size (D30) as 0.80 mm as obtained from the grading curve. Answer: 5.71, 0.15 WHATSAPP: +91-9412903929 AMIESTUDYCIRCLE.COM INFO@AMIESTUDYCIRCLE.COM
- 55. GEOTECHNICAL AND FOUNDATION ENGINEERING INTRODUCTION TO SOIL MECHANICS SECOND FLOOR, SULTAN TOWER, ROORKEE – 247667 UTTARAKHAND PH: (01332) 266328 Web: www.amiestudycircle.com 55/56 AMIE(I) STUDY CIRCLE(REGD.) A Focused Approach SOIL CLASSIFICATION Q.60. (AMIE W08, 7 marks): Describe the structure of illite by a neat dimensioned sketch. Q.61. (AMIE S09, 6 marks): Describe the structure of montmorillonite with neat dimensioned sketch. Q.62. (AMIE S05, 08, 13, 5 marks): Describe briefly Indian system of soil classification. When would you use dual symbols for soils? Q.63. (AMIE W07, 10 marks): Describe unified soil classification system. Q.64. (AMIE W09, 8 marks): Describe IS classification system by plasticity chart. Q.65. (AMIE W05, 10 marks): The results of laboratory tests conducted on two soils A and B are as follows: Parameter Soil A Soil B % passing 0.075 mm sieve 14 75 % passing 4.75 mm sieve 92 100 D10 (mm) 0.14 - D30 (mm) 0.33 - D60 (mm) 1.00 - LL 16 58 PL 8 14 Classify the soils as per Indian Standard Classification. Answer: Soil A = CL, Soil B = CH Q.66. (AMIE S09, 6 marks): Classify the soil, with the following properties according to ISC system: % of passing 4.75 mm sieve = 100 % of passing 75 sieve = 10 D10 = 0.23 mm D30 = 0.30 mm D60 = 0.41 mm Answer: Poorly graded, SP-SM Q.67. (AMIE W08, 10, 7 marks): Classify the soil, with the following properties, according to ISC system Liquid limit 40% Plasticity Index 10% % Passing 4.75 mm sieve 60% % Passing 75 sieve 45% Answer: SC Q.68. (AMIE S10, 5 marks): Classify the soil as per BIS for the following data: % of passing 4.75 mm = 100% % of passing 0.075 mm = 60% Liquid limit = 62.5% Plastic limit = 41.0% Answer: SC WHATSAPP: +91-9412903929 AMIESTUDYCIRCLE.COM INFO@AMIESTUDYCIRCLE.COM
- 56. GEOTECHNICAL AND FOUNDATION ENGINEERING INTRODUCTION TO SOIL MECHANICS SECOND FLOOR, SULTAN TOWER, ROORKEE – 247667 UTTARAKHAND PH: (01332) 266328 Web: www.amiestudycircle.com 56/56 AMIE(I) STUDY CIRCLE(REGD.) A Focused Approach Q.69. (AMIE W12, 4 marks): The results of classification tests conducted on a soil sample arc given below: Classify the soil as per IS 1498. Fraction passing through 75 microns : 70 % Liquid limit : 28 % Plastic limit : 20% Answer: SC Q.70. (AMIE W13, 5 marks): The results classification tests conducted on a soil sample are given below. Classify the soil as per IS 1498: Percentage of gravel : 72 Percentage of sand : 24 Size corresponding to 10% finer : 1.6 mm 30% finer :40 mm 60%finer : 80mm Answer: Well graded soil Hint: If Cu > 6 and 1 < Cc < 3, then soil will well graded, else poorly graded. VERTICAL STRESS DISTRIBUTION Q.71. (AMIE S05, 5 Marks): Three point loads 10,000 kN, 7500 kN and 9000 kN act in a line 5 m apart near the surface of a soil mass. Calculate the vertical stress at depth 4 m vertically below the centre (7500 kN) load. Answer: 277.74 kN/m2 Q.72. (AMIE S06, 8 marks): An elevated structure is supported on a tripod. The legs are spaced 4 m apart and form the apexes of an equilateral triangle. Compute the increase in the vertical stress at a depth of 3 m (i) beneath the point of intersection of the angular bisector (ii) beneath the centre of one of the sides of the triangle if each one of the legs carries a concentrated load of 1000 kN. Answer: 588.75 kN/m2 ; 272.43 kN/m2 Q.73. (AMIE W09, S11, 5 marks): A concentrated load of 200 kN is applied at the ground surface. Determine the vertical stress at a point P which is 6 m directly below the load. Also, calculate the vertical stress at a point X at a depth of 6 m and at a horizontal distance of 5 m from the axis of load. Answer: 2.65 kN/m2 , 0.71 kN/m2 Q.74. (AMIE S07, 7 marks): A uniformly distributed load of 200 kN/m2 is carried by a raft foundation. The raft is 8 m wide, 12 m long and may be regarded as flexible. Determine the intensity of vertical pressure at a point 6 m deep below the centre of the raft. Use Boussinesq equation. Answer: 42.85 kN/m2 Q.75. (AMIE W07, 8 marks): A uniform distributed load of 100 kN/m2 is carried by a circular raft foundation. The diameter of raft is 10 m. Determine the vertical stresses below the centres of raft at depths 2.5 m, 5 m, 7.5 m and 10 m. Use Boussinesq equation. Answer: 99.56 kN/m2 , 64.64 kN/m2 , 42.40 kN/m2 , 28.45 kN/m2 (For online support such as eBooks, video lectures, audio lectures, unsolved papers, quiz, test series and course updates, visit www.amiestudycircle.com) WHATSAPP: +91-9412903929 AMIESTUDYCIRCLE.COM INFO@AMIESTUDYCIRCLE.COM