
Recommended
More Related Content
What's hot
What's hot (20)
Similar to Understand Root Causes with Fishbone and Ishikawa Diagrams
Similar to Understand Root Causes with Fishbone and Ishikawa Diagrams (15)
Recently uploaded
Recently uploaded (20)
Understand Root Causes with Fishbone and Ishikawa Diagrams
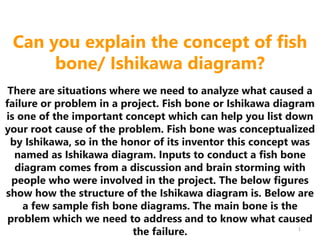
- 1. Can you explain the concept of fish bone/ Ishikawa diagram? There are situations where we need to analyze what caused a failure or problem in a project. Fish bone or Ishikawa diagram is one of the important concept which can help you list down your root cause of the problem. Fish bone was conceptualized by Ishikawa, so in the honor of its inventor this concept was named as Ishikawa diagram. Inputs to conduct a fish bone diagram comes from a discussion and brain storming with people who were involved in the project. The below figures show how the structure of the Ishikawa diagram is. Below are a few sample fish bone diagrams. The main bone is the problem which we need to address and to know what caused the failure. 1
- 2. With the help of few pictures, this concept has been explained. It is not my creation. However, I have done little effort to collect these pictures from internet. I do not have any copy right on these pics. 2
- 3. 3 This can apply to any exam like Six Sigma.
- 4. 4
- 5. 5
- 6. 6
- 7. 7
- 8. 8
- 9. 9
- 10. 10
- 11. 11
- 12. 12
- 13. 13
- 14. 14
- 15. 15
- 16. 16
- 17. 17
- 18. 18
- 19. 19
- 20. 20
- 21. 21
- 22. 22