
Recomendados
Más contenido relacionado
Más de amylute
Más de amylute (14)
Último
Último (20)
Chi-Square Goodness-of-Fit Test for Toll Booth Lanes
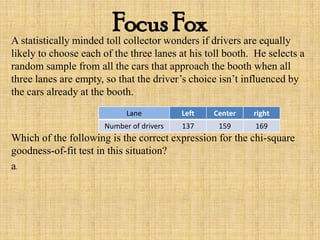
- 1. Focus FoxA statistically minded toll collector wonders if drivers are equally likely to choose each of the three lanes at his toll booth. He selects a random sample from all the cars that approach the booth when all three lanes are empty, so that the driver’s choice isn’t influenced by the cars already at the booth. Which of the following is the correct expression for the chi-square goodness-of-fit test in this situation? a. Lane Left Center right Number of drivers 137 159 169
- 2. Inference for Relationships What if we want to compare a single categorical variable across several populations or treatments? - we need a new test… - Determine whether the distribution of the categorical variable is the same for each population - Examine related test to see if there is an association between the variable and populations Recall: Two-Way Tables, conditional probabilities
- 3. Inference for Relationships Market researchers suspect that background music may affect the mood and buying behavior of customers. One study in a supermarket compared three randomly assigned treatments: no music, French accordion music, and Italian string music. Under each condition, the researchers recorded the numbers of bottles of French, Italian, and other wine purchased. a. Calculate the conditional distribution of the type of wine sold for each treatment. Wine No Music French Italian Totals French 30 39 30 99 Italian 11 1 19 31 Other 43 35 35 113 Totals 84 75 84 243
- 4. Inference for Relationships b. Make an appropriate graph for comparing the conditional distributions you found. Wine No Music French Italian Totals French 30 39 30 99 Italian 11 1 19 31 Other 43 35 35 113 Totals 84 75 84 243
- 5. Inference for Relationships c. Are the distribution of wine purchases under the three music treatments similar or different? Reference evidence found in parts a & b. Wine No Music French Italian Totals French 30 39 30 99 Italian 11 1 19 31 Other 43 35 35 113 Totals 84 75 84 243
- 6. Inference for Relationships In the wine example, if we use a one sample z test, we could select a comparison that is significant or isn’t significant. Individual comparisons don’t tell us whether the three distributions of the categorical variable are significantly different. We need to make multiple comparisons - An overall test to see if there is any differences in parameters - Detailed follow-up analysis to decide which of the parameters differ and to estimate how large the differences are We compare the observed counts in the a two-way table with the counts we would expect if H0 is true.
- 7. Inference for Relationships The null hypothesis in the wine and music experiment is that there is no difference in the distribution of wine purchases in the store when no music, French accordion music, or Italian string music is played. To find the expected counts we start by assuming the H0 is true. We can see from the two-way table that 99 of the 243 bottles of wine bought during the study were French wines. Wine No Music French Italian Totals French 30 39 30 99 Italian 11 1 19 31 Other 43 35 35 113 Totals 84 75 84 243
- 8. Inference for Relationships If the specific type of music that’s playing has no effect on wine purchases, the proportion of French wine sold under each music condition should be 99/243 = 0.407. There are 84 bottles of wine bought when no music is playing, so 0.407•84 = 34.22 bottles of French wine on average. There are 75 bottles of bought when French music is playing, so 0.407•75 = 30.56 bottles of French wine on average. There are 84 bottles of wine bought when Italian music is playing, so 0.407•84 = 34.22 bottles of French wine on average. Wine No Music French Italian Totals French 30 39 30 99 Italian 11 1 19 31 Other 43 35 35 113 Totals 84 75 84 243
- 9. Inference for Relationships Repeat the process for each type of wine using the proportion of total bottles sold against each type of wine sold. Wine No Music French Italian Totals French 30 39 30 99 Italian 11 1 19 31 Other 43 35 35 113 Totals 84 75 84 243 Wine No Music French Italian Totals French 34.22 30.56 34.22 99 Italian 31 Other 113 Totals 84 75 84 243
- 10. Inference for Relationships There is a general formula for the expected count in any cell of a two- way table: row total • column total table total 99 • 84 243 Notice that all the expected counts in the wine study are at least 5. Wine No Music French Italian Totals French 30 39 30 99 Italian 11 1 19 31 Other 43 35 35 113 Totals 84 75 84 243 Wine No Music French Italian Totals French 34.22 30.56 34.22 99 Italian 10.72 9.57 10.72 31 Other 39.06 34.88 39.06 113 Totals 84 75 84 243
- 11. Inference for Relationships Finding the chi-square statistic χ2 = ∑ (observed – expected)2 Expected Calculate the chi-square statistic for the observed and expected counts of wine and music. (30-34.22)2 + (39-30.56)2 +…. 34.22 30.56 Wine No Music French Italian Totals French 30 39 30 99 Italian 11 1 19 31 Other 43 35 35 113 Totals 84 75 84 243 Wine No Music French Italian Totals French 34.22 30.56 34.22 99 Italian 10.72 9.57 10.72 31 Other 39.06 34.88 39.06 113 Totals 84 75 84 243
- 12. Inference for Relationships Think of the chi-square statistic χ2 as a measure of how much the observed counts deviate from the expected counts. Large values of χ2 are evidence against the null, and the P-value measures the strength of the evidence. We will use Table C, but our df are a little different df = (number of rows – 1)(number of columns – 1)