Test the following claim. Identify the null hypothesis, alternative .pdf
•
0 likes•2 views
The document tests a claim about a sample of credit scores using a z-test. It calculates the test statistic z to be 5.11 and the p-value to be 0. The null hypothesis that the population mean is 675 is rejected. Therefore, there is sufficient evidence to conclude that the sample credit scores do not come from a population with a mean of 675.
Report
Share
Report
Share
Download to read offline
Recommended
Recommended
More Related Content
Similar to Test the following claim. Identify the null hypothesis, alternative .pdf
Similar to Test the following claim. Identify the null hypothesis, alternative .pdf (20)
Nonparametric and Distribution- Free Statistics _contd
Nonparametric and Distribution- Free Statistics _contd
35880 Topic Discussion7Number of Pages 1 (Double Spaced).docx
35880 Topic Discussion7Number of Pages 1 (Double Spaced).docx
Running head COURSE PROJECT NCLEX Memorial Hospital .docx
Running head COURSE PROJECT NCLEX Memorial Hospital .docx
More from anopticals
More from anopticals (17)
TF In Two Sample T-tests and in ANOVA procedures, we pay attention.pdf
TF In Two Sample T-tests and in ANOVA procedures, we pay attention.pdf
TF The interaction plot shows a reveral of effect.TF The.pdf
TF The interaction plot shows a reveral of effect.TF The.pdf
TF Large sample variance makes it easier to see means and mean dif.pdf
TF Large sample variance makes it easier to see means and mean dif.pdf
TF None of the experiments effects were statistically imp.pdf
TF None of the experiments effects were statistically imp.pdf
Tenecia is thinking of a number with 8 place values. The digit in th.pdf
Tenecia is thinking of a number with 8 place values. The digit in th.pdf
Ten children are seated in a row. How many different seating arrange.pdf
Ten children are seated in a row. How many different seating arrange.pdf
ten cards are numbered 1 to 10. The cards are shuffled thoroughly an.pdf
ten cards are numbered 1 to 10. The cards are shuffled thoroughly an.pdf
Temperature changeA puddle holds 150 g of water. If 0.50 g of wate.pdf
Temperature changeA puddle holds 150 g of water. If 0.50 g of wate.pdf
Technology has not contributed to the informal and formal leadership.pdf
Technology has not contributed to the informal and formal leadership.pdf
TB is a successful international telecommunication company with over.pdf
TB is a successful international telecommunication company with over.pdf
Tay-Sachs is a recessive lethal disease in which there is neurologic.pdf
Tay-Sachs is a recessive lethal disease in which there is neurologic.pdf
Talk about Greece leaving the Euro has been reignited by the recent .pdf
Talk about Greece leaving the Euro has been reignited by the recent .pdf
Take the transition matrices labeled P3 and P4 and determine the exp.pdf
Take the transition matrices labeled P3 and P4 and determine the exp.pdf
Talk about six economies of worth, or sets of values, that we priori.pdf
Talk about six economies of worth, or sets of values, that we priori.pdf
tanx = 25 then tanx = SolutionWell write tan 2x as a sum o.pdf
tanx = 25 then tanx = SolutionWell write tan 2x as a sum o.pdf
T denotes a fixed length of time fo = 1T is a frequency for sound w.pdf
T denotes a fixed length of time fo = 1T is a frequency for sound w.pdf
t fhome study questions and answers business operations mana.pdf
t fhome study questions and answers business operations mana.pdf
Recently uploaded
https://app.box.com/s/7hlvjxjalkrik7fb082xx3jk7xd7liz3TỔNG ÔN TẬP THI VÀO LỚP 10 MÔN TIẾNG ANH NĂM HỌC 2023 - 2024 CÓ ĐÁP ÁN (NGỮ Â...
TỔNG ÔN TẬP THI VÀO LỚP 10 MÔN TIẾNG ANH NĂM HỌC 2023 - 2024 CÓ ĐÁP ÁN (NGỮ Â...Nguyen Thanh Tu Collection
Recently uploaded (20)
Unit 3 Emotional Intelligence and Spiritual Intelligence.pdf
Unit 3 Emotional Intelligence and Spiritual Intelligence.pdf
Kodo Millet PPT made by Ghanshyam bairwa college of Agriculture kumher bhara...
Kodo Millet PPT made by Ghanshyam bairwa college of Agriculture kumher bhara...
TỔNG ÔN TẬP THI VÀO LỚP 10 MÔN TIẾNG ANH NĂM HỌC 2023 - 2024 CÓ ĐÁP ÁN (NGỮ Â...
TỔNG ÔN TẬP THI VÀO LỚP 10 MÔN TIẾNG ANH NĂM HỌC 2023 - 2024 CÓ ĐÁP ÁN (NGỮ Â...
NO1 Top Black Magic Specialist In Lahore Black magic In Pakistan Kala Ilam Ex...
NO1 Top Black Magic Specialist In Lahore Black magic In Pakistan Kala Ilam Ex...
General Principles of Intellectual Property: Concepts of Intellectual Proper...
General Principles of Intellectual Property: Concepts of Intellectual Proper...
Interdisciplinary_Insights_Data_Collection_Methods.pptx
Interdisciplinary_Insights_Data_Collection_Methods.pptx
UGC NET Paper 1 Mathematical Reasoning & Aptitude.pdf
UGC NET Paper 1 Mathematical Reasoning & Aptitude.pdf
Beyond_Borders_Understanding_Anime_and_Manga_Fandom_A_Comprehensive_Audience_...
Beyond_Borders_Understanding_Anime_and_Manga_Fandom_A_Comprehensive_Audience_...
Test the following claim. Identify the null hypothesis, alternative .pdf
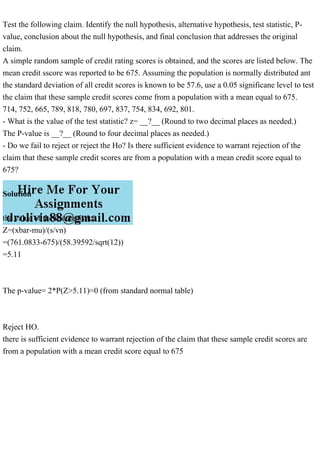
- 1. Test the following claim. Identify the null hypothesis, alternative hypothesis, test statistic, P- value, conclusion about the null hypothesis, and final conclusion that addresses the original claim. A simple random sample of credit rating scores is obtained, and the scores are listed below. The mean credit sscore was reported to be 675. Assuming the population is normally distributed ant the standard deviation of all credit scores is known to be 57.6, use a 0.05 significane level to test the claim that these sample credit scores come from a population with a mean equal to 675. 714, 752, 665, 789, 818, 780, 697, 837, 754, 834, 692, 801. - What is the value of the test statistic? z= __?__ (Round to two decimal places as needed.) The P-value is __?__ (Round to four decimal places as needed.) - Do we fail to reject or reject the Ho? Is there sufficient evidence to warrant rejection of the claim that these sample credit scores are from a population with a mean credit score equal to 675? Solution the value of the test statistic: Z=(xbar-mu)/(s/vn) =(761.0833-675)/(58.39592/sqrt(12)) =5.11 The p-value= 2*P(Z>5.11)=0 (from standard normal table) Reject HO. there is sufficient evidence to warrant rejection of the claim that these sample credit scores are from a population with a mean credit score equal to 675