1. Statistics and Probability Relearning
Page #1: I can determine if ascatterplothas a positive,negativeornocorrelation.
1. How do youread a graph? Whichdirectiondoyoureada graph to determinecorrelation?
2. If the graph movesupand to the right,what type of correlationdoesithave?
3. If the graph movesdownandto the right,what type of correlationdoesithave?
4. If the x value increasesasthe yvalue increases,whattype of correlationdoesithave?
5. If the x value increasesasthe yvalue decreases,whattype of correlationdoesithave?
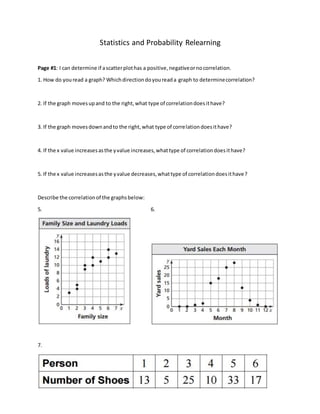
Describe the correlationof the graphsbelow:
5. 6.
7.
2. Page 2 and 3: I can create a scatter plot, draw in the line of best fit, and draw a conclusion about
the trend of the data.
8. What is a strong correlation?Howdothe pointscompare to a line?
9. What is a weakcorrelation?Howdothe pointscompare to a line?
10. What twothingsdo youneedto keepinmindwhendrawingaline of bestfit?
11. Afterdrawinga line of bestfit,howdoyoudetermine the slopeandy-intercept?
12. Whichline ismostrepresentative of the data?Explain.
13. Describe the type of relationshipinthe graphbelow.Include strongorweakinyourdescription.
3. 14. Draw a line of bestfit.
a. Findthe slope andy-intercept
b. Howmuch can you expectaninfanttoweighat 6 monthsold?
c. At 5 monthsold,howmuchcouldyou expectaninfanttoweigh?
4. Page 4: I can constructand interprettwo-waytablesof data.
15. What are marginal frequenciesandhow doyou findthem?
16. What isthe ratiousedto findpercentages?
17. How doyou knowwhatheadingstouse whencreatinga frequencytable?
18. Answerthe questionsbasedonthe two-waytable
a. How manypeople were surveyed?
b. Howmany people surveyedspeakmore thanone language?
c. What percentof people surveyedspeakmore thanone language?
d. What percentof people surveyedhave beenoutside the U.S.?
19.