eMarketer Worldwide Ad Spending Forecast - 2013 - 2016
•
42 recomendaciones•63,345 vistas

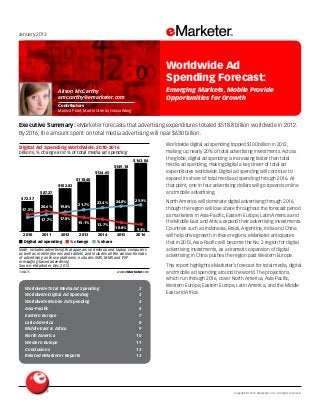
Worldwide digital ad spending topped $100 billion in 2012, making up nearly 20% of total advertising investments. Across the globe, digital ad spending is increasing faster than total media ad spending, making digital a key driver of total ad expenditures worldwide. Digital ad spending will continue to expand its share of total media ad spending through 2016. At that point, one in four advertising dollars will go towards online and mobile advertising.

Recomendados
Recomendados
Más contenido relacionado
Último
Último (20)
Destacado
Destacado (20)
eMarketer Worldwide Ad Spending Forecast - 2013 - 2016
- 1. Copyright ©2013 eMarketer, Inc. All rights reserved. Worldwide Total Media Ad Spending 2 Worldwide Digital Ad Spending 3 Worldwide Mobile Ad Spending 4 Asia-Pacific 6 Eastern Europe 7 Latin America 8 Middle East & Africa 9 North America 10 Western Europe 11 Conclusions 13 Related eMarketer Reports 13 January 2013 Executive Summary: eMarketer forecasts that advertising expenditures totaled $518.8 billion worldwide in 2012. By 2016, the amount spent on total media advertising will near $630 billion. 148475 Worldwide digital ad spending topped $100 billion in 2012, making up nearly 20% of total advertising investments. Across the globe, digital ad spending is increasing faster than total media ad spending, making digital a key driver of total ad expenditures worldwide. Digital ad spending will continue to expand its share of total media ad spending through 2016. At that point, one in four advertising dollars will go towards online and mobile advertising. North America will dominate digital advertising through 2016, though the region will lose share throughout the forecast period as marketers in Asia-Pacific, Eastern Europe, Latin America and the Middle East and Africa expand their advertising investments. Countries such as Indonesia, Brazil, Argentina, India and China will help drive growth in these regions. eMarketer anticipates that in 2013, Asia-Pacific will become the No. 2 region for digital advertising investments, as a dramatic expansion of digital advertising in China pushes the region past Western Europe. This report highlights eMarketer’s forecast for total media, digital and mobile ad spending around the world. The projections, which run through 2016, cover North America, Asia-Pacific, Western Europe, Eastern Europe, Latin America, and the Middle East and Africa. billions, % change and % of total media ad spending Digital Ad Spending Worldwide, 2010-2016 2010 $72.37 17.5% 15.2% 2011 $87.27 20.6% 17.7% 2012 $102.83 17.8% 19.8% 2013 $118.40 15.1% 21.7% 2014 $134.65 13.7% 23.4% 2015 $149.18 10.8% 24.8% 2016 $163.04 9.3% 25.9% Digital ad spending % change % share Note: includes advertising that appears on desktop and laptop computers as well as mobile phones and tablets, and includes all the various formats of advertising on those platforms; excludes SMS, MMS and P2P messaging-based advertising Source: eMarketer, Dec 2012 148475 www.eMarketer.com Alison McCarthy amccarthy@emarketer.com Contributors Monica Peart, Martín Utreras, Haixia Wang Worldwide Ad Spending Forecast: Emerging Markets, Mobile Provide Opportunities for Growth
- 2. Worldwide Ad Spending Forecast: Emerging Markets, Mobile Provide Opportunity for Growth Copyright ©2013 eMarketer, Inc. All rights reserved. 2 Worldwide Total Media Ad Spending eMarketer estimates that marketers invested $518.8 billion in total media advertising worldwide last year. By 2015, total media ad expenditures will pass the $600 billion mark. NorthAmerica led all regions in total media ad spending in 2012, with $179.3 billion or a 34.6% share of the total.Asia-Pacific followed with an allocation of $145.9 billion or 28% of total spending. billions Total Media Ad Spending Worldwide, by Region, 2011-2016 North America Asia-Pacific Western Europe Latin America Eastern Europe Middle East & Africa Worldwide 2011 $170.98 $134.51 $119.81 $31.22 $19.76 $15.96 $492.25 2012 $179.34 $145.94 $120.28 $34.66 $21.40 $17.16 $518.78 2013 $185.53 $157.47 $123.17 $38.12 $23.12 $18.34 $545.75 2014 $192.70 $168.81 $126.37 $42.70 $24.85 $19.61 $575.04 2015 $197.99 $179.79 $128.90 $46.75 $26.59 $20.79 $600.81 2016 $204.43 $190.93 $131.22 $51.33 $28.32 $21.97 $628.21 Note: includes digital (online and mobile), directories, magazines, newspapers, outdoor, radio and TV; numbers may not add up to total due to rounding Source: eMarketer, Dec 2012 147993 www.eMarketer.com 147993 North America, along with Western Europe—the region with the third-largest portion of the global advertising market— will lose share throughout the forecast period as emerging regions grow their advertising expenditures and expand their investments. eMarketer predicts that Asia-Pacific and Latin America will see the biggest gains in share through 2016. % of total Total Media Ad Spending Share Worldwide, by Region, 2011-2016 2011 2012 2013 2014 2015 North America 34.7% 34.6% 34.0% 33.5% 33.0% Asia-Pacific 27.3% 28.1% 28.9% 29.4% 29.9% Western Europe 24.3% 23.2% 22.6% 22.0% 21.5% Latin America 6.3% 6.7% 7.0% 7.4% 7.8% Eastern Europe 4.0% 4.1% 4.2% 4.3% 4.4% Middle East & Africa 3.2% 3.3% 3.4% 3.4% 3.5% 2016 32.5% 30.4% 20.9% 8.2% 4.5% 3.5% Note: includes digital (online and mobile), directories, magazines, newspapers, outdoor, radio and TV; numbers may not add up to 100% due to rounding Source: eMarketer, Dec 2012 147997 www.eMarketer.com 147997 Growth of total media ad spending worldwide will hover at just above 5% between 2012 and 2014, a slightly slower rate than eMarketer previously forecast. This lowered forecast is due to economic conditions around the world. Total media ad spending’s 5.4% growth rate between 2011 and 2012 was partially boosted by the Olympic Games and the US presidential election. Despite economic woes in Western Europe and political turmoil in the Middle East and Africa, there is still healthy growth across most regions. Digital ad spending—consisting of online and mobile ad spending— will be a driving force of total media ad spending growth throughout the forecast period. Overall ad spending has reached maturity in North America and Western Europe. Growth will be slowest in these two regions, though Western Europe will see a bump in 2013 due to an expected economic recovery for the region. Asia-Pacific, Eastern Europe, the Middle East and Africa, and Latin America will each experience higher-than-average increases in total media ad spending for the entirety of the forecast, driven primarily by their rapidly expanding economies and growing number of internet users. Latin America will experience the fastest total media ad spending growth for the entirety of the forecast, fueled by spending increases in Argentina, Mexico and Brazil. But Latin America’s spending gains will come from a much smaller value base than those of North America, Western Europe and Asia-Pacific, with spending reaching only $51 billion by 2016. % change Total Media Ad Spending Growth Worldwide, by Region, 2011-2016 2011 2012 2013 2014 2015 2016 Latin America 13.9% 11.0% 10.0% 12.0% 9.5% Asia-Pacific 2.9% 8.5% 7.9% 7.2% 6.5% Eastern Europe 5.3% 8.3% 8.0% 7.5% 7.0% Middle East & Africa 10.7% 7.5% 6.9% 6.9% 6.0% North America 3.1% 4.9% 3.5% 3.9% 2.7% Western Europe 1.6% 0.4% 2.4% 2.6% 2.0% Worldwide 3.6% 5.4% 5.2% 5.4% 4.5% 9.8% 6.2% 6.5% 5.7% 3.3% 1.8% 4.6% Note: includes digital (online and mobile), directories, magazines, newspapers, outdoor, radio and TV Source: eMarketer, Dec 2012 147995 www.eMarketer.com 147995
- 3. Worldwide Ad Spending Forecast: Emerging Markets, Mobile Provide Opportunity for Growth Copyright ©2013 eMarketer, Inc. All rights reserved. 3 Worldwide Digital Ad Spending Worldwide digital ad spending topped $100 billion in 2012,according to eMarketer calculations.Digital ad expenditures are projected to nearly double between 2011 and 2016,increasing to $163 billion from $87.3 billion. Marketers in North America allocated $40.1 billion to digital advertising in 2012, leading the global market. Rapid growth in Indonesia, India and China will help thrust Asia-Pacific past Western Europe to become the region with the second-highest digital ad expenditures in 2013. billions Digital Ad Spending Worldwide, by Region, 2011-2016 North America Western Europe Asia-Pacific Eastern Europe Latin America Middle East & Africa Worldwide 2011 $34.42 $25.01 $21.85 $2.94 $2.46 $0.59 $87.27 2012 $40.12 $27.66 $27.31 $3.49 $3.37 $0.87 $102.83 2013 $45.67 $30.70 $32.50 $4.10 $4.15 $1.28 $118.40 2014 $51.36 $33.77 $37.70 $4.73 $5.31 $1.78 $134.65 2015 $56.01 $36.27 $42.98 $5.35 $6.26 $2.31 $149.18 2016 $59.79 $38.66 $48.57 $5.83 $7.26 $2.92 $163.04 Note: includes advertising that appears on desktop and laptop computers as well as mobile phones and tablets, and includes all the various formats of advertising on those platforms; excludes SMS, MMS and P2P messaging- based advertising; numbers may not add up to total due to rounding Source: eMarketer, Dec 2012 148093 www.eMarketer.com 148093 Nearly one in three people worldwide are now internet users, and advertisers across the globe are following these users online. Worldwide, digital ad spending represented nearly 20% of total media ad spending last year and will continue expanding its share of media spending through 2016, when it will reach 25.9% of the total. Digital Ad Spending Worldwide as a Percent of Total Media Ad Spending, by Region, 2011-2016 2011 2012 2013 2014 2015 2016 Western Europe 20.9% 23.0% 24.9% 26.7% 28.1% 29.5% North America 20.1% 22.4% 24.6% 26.7% 28.3% 29.2% Asia-Pacific 16.2% 18.7% 20.6% 22.3% 23.9% 25.4% Eastern Europe 14.9% 16.3% 17.7% 19.0% 20.1% 20.6% Latin America 7.9% 9.7% 10.9% 12.4% 13.4% 14.1% Middle East & Africa 3.7% 5.1% 7.0% 9.1% 11.1% 13.3% Worldwide 17.7% 19.8% 21.7% 23.4% 24.8% 25.9% Note: includes advertising that appears on desktop and laptop computers as well as mobile phones and tablets, and includes all the various formats of advertising on those platforms; excludes SMS, MMS and P2P messaging-based advertising Source: eMarketer, Dec 2012 149075 www.eMarketer.com 149075 North America will claim the biggest piece of the digital ad spending pie throughout the entirety of the forecast period. However, the region began to lose share in 2011 as the emerging economies of Asia-Pacific, Eastern Europe, Latin America and the Middle East and Africa started to increase their digital advertising spending. This trend will continue through 2016. eMarketer expects Asia-Pacific to experience the biggest growth in share, jumping 4.8 percentage points between 2011 and 2016. % of total Digital Ad Spending Share Worldwide, by Region, 2011-2016 North America Western Europe Asia-Pacific Eastern Europe Latin America Middle East & Africa 2011 39.4% 28.7% 25.0% 3.4% 2.8% 0.7% 2012 39.0% 26.9% 26.6% 3.4% 3.3% 0.8% 2013 38.6% 25.9% 27.4% 3.5% 3.5% 1.1% 2014 38.1% 25.1% 28.0% 3.5% 3.9% 1.3% 2015 37.5% 24.3% 28.8% 3.6% 4.2% 1.5% 2016 36.7% 23.7% 29.8% 3.6% 4.5% 1.8% Note: includes advertising that appears on desktop and laptop computers as well as mobile phones and tablets, and includes all the various formats of advertising on those platforms; excludes SMS, MMS and P2P messaging- based advertising; numbers may not add to 100% due to rounding Source: eMarketer, Dec 2012 148098 www.eMarketer.com 148098 Worldwide investment in digital advertising increased 17.8% last year, compared to total media ad spending’s growth rate of 5.4%. eMarketer has reduced its estimate for worldwide digital ad spending growth by 1.2 percentage points from its September 2012 forecast due to slower-than-expected percentage gains in countries such as the US, France, Germany, Italy, Spain and Indonesia. But opportunity for growth remains significant, particularly in the burgeoning digital advertising markets of Indonesia, Brazil, Argentina, India and China, which will help drive spending worldwide. % change Digital Ad Spending Growth Worldwide, by Region, 2010-2016 Middle East & Africa Latin America Asia-Pacific Eastern Europe North America Western Europe Worldwide 2010 70.0% 27.0% 20.0% 32.7% 15.6% 15.5% 17.5% 2011 55.8% 34.0% 23.1% 38.4% 21.5% 13.9% 20.6% 2012 47.9% 37.0% 25.0% 18.9% 16.6% 10.6% 17.8% 2013 47.4% 23.0% 19.0% 17.3% 13.8% 11.0% 15.1% 2014 38.5% 28.0% 16.0% 15.5% 12.4% 10.0% 13.7% 2015 30.0% 18.0% 14.0% 13.0% 9.0% 7.4% 10.8% 2016 26.5% 16.0% 13.0% 9.0% 6.8% 6.6% 9.3% Note: includes advertising that appears on desktop and laptop computers as well as mobile phones and tablets, and includes all the various formats of advertising on those platforms; excludes SMS, MMS and P2P messaging- based advertising Source: eMarketer, Dec 2012 148094 www.eMarketer.com 148094 Even as North America and Western Europe lose share to other regions, their total media spending per person throughout the forecast period will remain higher than those of other regions. In 2016, marketers in North America will register $206 in digital ad spending per internet user, while those in Asia-Pacific will devote only $35 to each internet user.
- 4. Worldwide Ad Spending Forecast: Emerging Markets, Mobile Provide Opportunity for Growth Copyright ©2013 eMarketer, Inc. All rights reserved. 4 Digital Ad Spending per Internet User Worldwide, by Region, 2011-2016 2011 2012 2013 2014 2015 2016 North America $133 $151 $168 $185 $197 $206 Western Europe $96 $104 $112 $120 $127 $133 Asia-Pacific $23 $26 $28 $30 $32 $35 Eastern Europe $15 $17 $18 $19 $21 $22 Latin America $11 $13 $15 $18 $20 $22 Middle East & Africa $3 $4 $5 $7 $8 $10 Worldwide $42 $45 $48 $51 $54 $57 Note: includes advertising that appears on desktop and laptop computers as well as mobile phones and tablets, and includes all the various formats of advertising on those platforms; excludes SMS, MMS and P2P messaging-based advertising Source: eMarketer, Dec 2012 148527 www.eMarketer.com 148527 Worldwide Mobile Ad Spending eMarketer calculates 1.4 billion people, or one in five people around the world, went online via their mobile device in 2012. Mobile usage has helped drive internet adoption in Asia-Pacific, Latin America and the Middle East and Africa. Marketers have begun to allocate larger portions of their advertising budgets to the mobile ad market in recent years. Worldwide mobile ad spending reached $8.4 billion last year, eMarketer estimates. By the end of the forecast, investments in mobile advertising will more than quadruple to $36.9 billion. Asia-Pacific previously had the largest mobile ad expenditures worldwide, primarily due to advanced mobile advertising markets in Japan and South Korea. However, consumers are rapidly adopting smartphones and tablets in the US, and marketers there are taking advantage of growing mobile ad opportunities. Because of this, North America surpassed Asia-Pacific last year with $3.9 billion in mobile ad spending. In 2015, an expected rise in mobile ad investments in Western Europe will push Asia-Pacific to third place. millions Mobile Ad Spending Worldwide, by Region, 2011-2016 North America Asia- Pacific Western Europe Latin America Eastern Europe Middle East & Africa World- wide 2011 $1,261.7 $1,895.6 $845.0 $42.6 $36.4 $3.5 $4,084.8 2012 $3,948.4 $2,653.8 $1,647.8 $79.2 $70.4 $7.1 $8,406.7 2013 $7,162.6 $3,412.8 $2,735.3 $140.2 $117.0 $13.4 $13,581.3 2014 $11,245.1 $4,313.8 $4,294.4 $259.3 $162.1 $22.8 $20,297.5 2015 $16,117.9 $5,314.6 $6,355.7 $414.9 $210.8 $36.4 $28,450.3 2016 $21,391.7 $6,191.6 $8,389.5 $580.9 $261.4 $58.3 $36,873.3 Note: includes display (banners, video and rich media) and search; excludes SMS, MMS and P2P messaging-based advertising; includes ad spending on tablets Source: eMarketer, Dec 2012 148422 www.eMarketer.com 148422 Rapid mobile internet adoption combined with the continued development of mobile ad networks and greater choice of mobile ad formats will significantly enhance how marketers use mobile to engage consumers, especially in the more advanced advertising economies of North America and Western Europe. Facebook’s and Twitter’s mobile advertising streams, as well as mobile’s potential for audience targeting, will also attract marketers. In 2011, Asia-Pacific had a 15.5-percentage-point lead in share of worldwide mobile ad spending over North America. By Worldwide Digital Ad Spending
- 5. Worldwide Ad Spending Forecast: Emerging Markets, Mobile Provide Opportunity for Growth Copyright ©2013 eMarketer, Inc. All rights reserved. 5 the end of 2012, that lead flipped, with North America 15.4 percentage points ahead of Asia-Pacific in mobile ad share, reaching 47% of the global total while Asia-Pacific’s share dropped to 31.6%. North America will continue to expand its portion of the total throughout the forecast period, reaching 58% in 2016. Western Europe will also see a jump in share, while Asia-Pacific’s share will fall 14.8 percentage points by the end of the forecast period. % of total Mobile Ad Spending Share Worldwide, by Region, 2011-2016 2011 2012 2013 2014 2015 2016 North America 30.9% 47.0% 52.7% 55.4% 56.7% 58.0% Asia-Pacific 46.4% 31.6% 25.1% 21.3% 18.7% 16.8% Western Europe 20.7% 19.6% 20.1% 21.2% 22.3% 22.8% Latin America 1.0% 0.9% 1.0% 1.3% 1.5% 1.6% Eastern Europe 0.9% 0.8% 0.9% 0.8% 0.7% 0.7% Middle East & Africa 0.1% 0.1% 0.1% 0.1% 0.1% 0.2% Note: includes display (banners, video and rich media) and search; excludes SMS, MMS and P2P messaging-based advertising; includes ad spending on tablets; numbers may not add up to 100% due to rounding Source: eMarketer, Dec 2012 148425 www.eMarketer.com 148425 Worldwide mobile ad spending growth peaked last year at 105.8%, following 2011’s updated growth rate of 74.6%. Because of faster-than-expected increases in the US, UK, Spain, China and the Middle East and Africa, eMarketer increased its 2012 estimate for the growth of worldwide mobile ad spending since its previous forecast by 42.8 percentage points, up from 63%. Rapid percentage gains will be seen throughout the forecast period in all of the regions included in the forecast. In 2012, increases in mobile ad spending in Western Europe, Eastern Europe and the Middle East and Africa were each more than 90%. Latin America followed at 86%. Mobile ad expenditures in Asia-Pacific grew at a slower pace due to the mobile ad economies already in place in the region. North America experienced a massive 212.9% gain. % change Mobile Ad Spending Growth Worldwide, by Region, 2011-2016 2011 2012 2013 2014 2015 2016 North America 129.3% 212.9% 81.4% 57.0% 43.3% 32.7% Middle East & Africa 255.5% 100.0% 90.0% 70.0% 60.0% 60.0% Western Europe 92.0% 95.0% 66.0% 57.0% 48.0% 32.0% Eastern Europe 25.1% 93.5% 66.2% 38.6% 30.0% 24.0% Latin America 143.3% 86.0% 77.0% 85.0% 60.0% 40.0% Asia-Pacific 45.6% 40.0% 28.6% 26.4% 23.2% 16.5% Worldwide 74.6% 105.8% 61.6% 49.5% 40.2% 29.6% Note: includes display (banners, video and rich media) and search; excludes SMS, MMS and P2P messaging-based advertising; includes ad spending on tablets Source: eMarketer, Dec 2012 148423 www.eMarketer.com 148423 The amount spent on mobile advertising per mobile internet user will remain quite low in most regions through 2016. Last year, advertisers in North America and Western Europe dedicated $30 and $15 per user, respectively, while those in Asia-Pacific spent only $3 per user. By 2016, advertisers in Eastern Europe, Latin America and the Middle East and Africa will still spend only $2 or less per user on mobile advertising. Mobile Ad Spending Worldwide per Mobile Internet User, by Region, 2011-2016 2011 2012 2013 2014 2015 2016 North America $12 $30 $46 $63 $81 $99 Western Europe $10 $15 $19 $23 $28 $33 Asia-Pacific $3 $3 $4 $4 $4 $5 Latin America $1 $1 $1 $1 $2 $2 Eastern Europe $1 $1 $1 $1 $1 $1 Middle East & Africa $0 $0 $0 $0 $0 $0 Worldwide $4 $6 $8 $10 $12 $15 Note: includes display (banners, video and rich media) and search; excludes SMS, MMS and P2P messaging-based advertising; includes ad spending on tablets Source: eMarketer, Dec 2012 148526 www.eMarketer.com 148526 Worldwide Mobile Ad Spending
- 6. Worldwide Ad Spending Forecast: Emerging Markets, Mobile Provide Opportunity for Growth Copyright ©2013 eMarketer, Inc. All rights reserved. 6 Asia-Pacific ■■ With $145.9 billion in total advertising, Asia-Pacific had the second-largest advertising economy worldwide after North America in 2012. eMarketer predicts that beginning in 2012 and through the rest of the forecast period, total ad spending in Asia-Pacific will grow faster than in North America, thanks to budding advertising economies and extraordinary growth rates in internet and mobile internet use in China, Indonesia and India. ■■ With investments of $47.3 billion last year, or one-third of Asia-Pacific’s total, Japan led the other countries in the region in ad spending, bouncing back from a 5.9% decline in traditional media ad spending in 2011 that resulted from the March 2011 earthquake and tsunami. ■■ Japan’s setback in ad spending in 2011, combined with China’s robust consumer base and the increasing advertising opportunities marketers are taking advantage of there, will help propel China ahead of Japan in ad investments by $3.4 billion in 2014. At that point, China will make up 31% of Asia-Pacific’s total and will be second only to the US in ad spending worldwide. ■■ Driven by a rise in TV viewing, a growing middle class and a greater volume of direct foreign investment, Indonesia will experience a similar growth rate for total media ad spending as China throughout the forecast period, though on a much smaller scale. Indonesia’s ad economy remains mostly reliant on traditional media advertising formats such as TV, magazines and newspapers. ■■ Digital ad expenditures in Asia-Pacific reached $27.3 billion in 2012.Asia-Pacific is expected to become the second-largest digital ad market in the world by the end of this year, when the region surpasses Western Europe by nearly $2 billion. Asia-Pacific will experience massive growth throughout the forecast period, having achieved a peak 25% increase last year. ■■ The amount marketers will devote towards digital ad spending in Indonesia, China and India will increase faster than Asia-Pacific’s overall regional growth through 2016. Indonesia is forecast to see especially high growth, though this will be primarily due to fact that the country recorded only $140 million in digital advertising last year. ■■ By 2014, marketers in China will invest more in digital advertising than their counterparts in Japan and the UK, as China pushes ahead to the No. 2 spot in worldwide digital ad expenditures. China’s share of digital ad spending in the region is expected to rise to 36.1% in 2016 from 27% in 2012, while Japan’s share will drop from 35.1% to 25.8%. The rise of search and social network ad spending is primarily driving China’s growth. Online video viewership is also contributing to increases in digital ad spending in China as the government restricts certain types of television programming. ■■ At 18.7%, digital ad spending as a percentage of total media ad spending in Asia-Pacific was 1 percentage point lower than the worldwide average last year. While the more mature digital ad economies of Australia, Japan and South Korea made up large portions of total media ad spending, digital ad spending in Indonesia accounted for only 2.2% of that country’s ad expenditures, lowering the region’s average. ■■ eMarketer calculated Asia-Pacific’s mobile ad market as the second highest worldwide in 2012, with investments reaching nearly $2.7 billion. Japan, an advanced mobile market, accounted for $1.7 billion, or 65% of the region’s total. By 2016, mobile ad spending in Asia Pacific will total $6.2 billion, driven by a surge in growth in China, India and Indonesia. Japan’s share is expected to drop to 43.1% at that time due to China’s dramatic expansion in the region. ■■ China’s current mobile ad market is relatively undeveloped, and advertisers in the country have not been as quick to adopt mobile advertising as marketers in Japan, South Korea and Australia. But this is expected to change as mobile internet use in China becomes more popular and marketers become more adept at connecting to mobile users via their devices. eMarketer has increased its growth projection for mobile ad spending in China for 2012 to 138%, up from its previous forecast of 80%. China’s regional share will climb to 31.4% in 2016, up from 9.7% in 2012. By the end of the forecast period, mobile advertising in China is forecast to be a $2 billion market. ■■ Mobile ad spending in Asia-Pacific will account for 9.7% of digital ad spending in the region in 2012 and is set to reach 12.7% in 2016. The more advanced mobile ad markets of Japan and South Korea each represented 18% of their countries’ digital ad expenditures last year, raising the region’s average. Mobile ad spending in China is predicted to climb from 3.5% of the country’s digital ad spending in 2012 to 11.1% in 2016.
- 7. Worldwide Ad Spending Forecast: Emerging Markets, Mobile Provide Opportunity for Growth Copyright ©2013 eMarketer, Inc. All rights reserved. 7 millions Mobile, Digital and Total Media Ad Spending in Asia-Pacific, by Country, 2012 & 2016 Mobile Digital Total media Japan China Australia South Korea Indonesia India Other Asia-Pacific 2012 $1,740 $258 $73 $451 $5 $10 $117 $2,654 2016 $2,671 $1,942 $186 $763 $52 $102 $476 $6,192 2012 $9,599 $7,365 $2,736 $2,499 $136 $484 $4,492 $27,311 2016 $12,554 $17,508 $4,054 $3,245 $1,158 $1,307 $8,739 $48,566 2012 $47,247 $42,570 $11,778 $9,346 $6,201 $5,881 $22,921 $145,944 2016 $51,532 $64,037 $13,116 $10,518 $9,576 $8,076 $34,077 $190,932 Note: numbers may not add up to total due to rounding Source: eMarketer, Dec 2012 148482 www.eMarketer.com 148482 Mobile, Digital and Total Media Ad Spending CAGR and Share in Asia-Pacific, by Country, 2012-2016 South Korea Australia Japan China India Indonesia Other Asia-Pacific 26.7% 23.2% 20.3% 17.3% 8.2% 2.2% 19.6% 18.7% 30.9% 30.9% 24.4% 27.3% 16.2% 12.1% 25.6% 25.4% 18.0% 2.7% 18.1% 3.5% 2.0% 3.3% 2.6% 9.7% 23.5% 4.6% 21.3% 11.1% 7.8% 4.5% 5.4% 12.7% 14.1% 26.4% 11.3% 65.6% 78.9% 83.7% 41.9% 23.6% 6.7% 10.3% 6.9% 24.2% 28.2% 70.7% 18.1% 15.5% 3.0% 2.7% 2.2% 10.7% 8.2% 11.5% 10.4% 6.9% Source: eMarketer, Dec 2012 148483 www.eMarketer.com Digital % of total Mobile % of digital 2012 2016 2012 2016 CAGR (2012-2016) Mobile Digital Total media 148483 Eastern Europe ■■ Marketers in Eastern Europe allocated $21.4 billion in total media advertising in 2012.This is expected to rise to $28.3 billion by 2016.Russia,the region’s biggest advertising market,accounted for $9.2 billion of Eastern Europe’s total media ad spending in 2012.By the end of the forecast period,Russia will account for nearly half of all expenditures in the region. ■■ eMarketer estimates that total media ad spending in Eastern Europe increased 8.3% in 2012, up from a 5.3% gain in 2011. Percentage gains are expected to slow slightly throughout the forecast but maintain a moderate trajectory. Russia is driving Eastern Europe’s growth, as Western Europe’s economic turmoil has affected Russia less than other countries in the region.At 15%, Russia experienced faster growth than the overall region in 2012. Russia’s total media ad spending will record double-digit increases yearly through 2015. ■■ At $3.5 billion, Eastern Europe committed relatively little towards digital advertising last year compared to other regions in the forecast. Digital ad spending in the region is expected to increase to $5.8 billion by 2016. Russia represented 49% of the total last year and will climb to 53% of the total by the end of the forecast period. ■■ The expansion of broadband coverage has slowed throughout Eastern Europe, dampening prospects for rapid growth of investments in digital advertising. According to eMarketer, digital ad spending increased 18.9% in 2012 in Eastern Europe, down from a previous projection of 30%. But Russia’s digital ad economy remains promising. Though penetration is low compared to other countries in the forecast, Russia’s internet user base is growing at a faster pace than the regional average. ■■ By 2016, digital ad spending will account for 20% of total media ad spending in Eastern Europe, up from last year’s 16.3% share. eMarketer expects that Russia’s digital ad spending as a percentage of total media ad spending will be two percentage points higher than Eastern Europe’s average throughout the forecast period. ■■ Eastern Europe has not yet taken big steps towards mobile advertising. eMarketer estimates Eastern Europe had the second-lowest mobile ad spending total worldwide last year, coming in above only the Middle East and Africa, with $70 million. Russia accounted for $29 million of this total. By 2016, Russia will make up nearly half of Eastern Europe’s total mobile ad spending. ■■ Such low levels of mobile ad spending leave much opportunity for growth. Mobile ad spending in the region will increase dramatically throughout the forecast period, though it will remain quite small. In 2012, investments in mobile ads jumped 93.5% in Eastern Europe, while Russia Asia-Pacific
- 8. Worldwide Ad Spending Forecast: Emerging Markets, Mobile Provide Opportunity for Growth Copyright ©2013 eMarketer, Inc. All rights reserved. 8 saw growth of 70%. The growth rates of mobile ad spending in both Russia and Eastern Europe peaked last year, mirroring the peak growth rate of mobile internet users in 2012. As more users go online through mobile devices, it is expected that marketers will follow. ■■ Mobile’s portion of digital ad spending in Eastern Europe will more than double between 2012 and 2016, but will still make up only 4.5% of digital spending by the end of the forecast period. Mobile ad spending as a percentage of digital ad spending in Russia will be slightly lower than the overall region. millions Mobile, Digital and Total Media Ad Spending in Eastern Europe, by Country, 2012 & 2016 Mobile Digital Total media Russia Other Eastern Europe 2012 $29 $42 $70 2016 $122 $140 $261 2012 $1,713 $1,781 $3,494 2016 $3,116 $2,715 $5,830 2012 $9,242 $12,161 $21,403 2016 $14,024 $14,293 $28,317 Note: numbers may not add up to total due to rounding Source: eMarketer, Dec 2012 148484 www.eMarketer.com 148484 Mobile, Digital and Total Media Ad Spending CAGR and Share in Eastern Europe, by Country, 2012-2016 Russia Other Eastern Europe 18.5% 14.6% 16.3% 22.2% 19.0% 20.6% 1.7% 2.3% 2.0% 3.9% 5.1% 4.5% 43.6% 35.2% 38.8% 16.1% 11.1% 13.7% 11.0% 4.1% 7.2% Source: eMarketer, Dec 2012 148485 www.eMarketer.com Digital % of total Mobile % of digital 2012 2016 2012 2016 CAGR (2012-2016) Mobile Digital Total media 148485 Latin America ■■ At $34.6 billion, Latin America had the third-smallest total media ad expenditure tally last year, higher than only Eastern Europe and the Middle East and Africa. More than half of Latin America’s total media ad spending came from Brazil, the sixth-largest economy in the world. ■■ While overall spending is relatively low compared to other regions, Latin America will experience the fastest total media ad spending growth among all of the regions included in eMarketer’s forecast through 2016. Latin America’s growth came in at 11% in 2012. At 20% in 2012, the growth rate for total media ad spending in Argentina was well over the worldwide average, boosted by the country’s booming internet user population and large TV audience. In 2013, Argentina is expected to overtake Mexico to become the No. 2 country in ad spending regionally. Strong gains will be seen in total media ad spending in Brazil and Mexico as well. Overall, Latin America’s economies have been less affected by the economic problems that have recently hindered growth in North America and Western Europe. ■■ Marketers in Latin America committed nearly $3.4 billion towards digital advertising last year, a regional amount greater than only the Middle East and Africa. Internet penetration in Latin America is relatively low outside of urban areas. eMarketer estimates that just over 42% of the region’s residents were online in 2012. Nearly $2 billion of Latin America’s digital ad spending came from Brazil, a country with a rising middle class. ■■ Latin America is second only to the Middle East and Africa as the fastest-growing digital ad market in the world. More than half of the region’s population are expected to be internet users by 2015. Last year, digital ad spending saw gains of 40% in both Argentina and Brazil, while Mexico recorded a 34% jump. ■■ Between 2012 and 2016, digital ad spending will climb from 9.7% to 14.1% of total media ad expenditures in Latin America.The share of digital ad spending in Mexico will double within the next four years, rising from 11.9% to 22.1%. ■■ Approximately 17% of Latin America’s population went online via mobile phone last year. eMarketer expects this ratio to climb to one in three people by the end of the forecast period. Though it is common for internet users in the region to access the web primarily through mobile devices, mobile ad spending is still quite small. Last year, marketers in Latin America committed $79 million to mobile advertising. Mobile advertising will increase to $580.9 million by 2016, though this total will remain minute compared to spending in other regions. Eastern Europe
- 9. Worldwide Ad Spending Forecast: Emerging Markets, Mobile Provide Opportunity for Growth Copyright ©2013 eMarketer, Inc. All rights reserved. 9 ■■ Mexico experienced faster mobile adoption rates than Brazil and Argentina in 2012 and will maintain that accelerated pace in 2013. Mobile ad spending in Mexico accounted for more than half of total mobile ad spending in Latin America in 2012. 2011 saw large mobile ad campaigns from major telecom operators based in Mexico, which contributed to dramatic gains in the country’s spending. eMarketer expects Mexico’s telecom operators to continue these significant mobile advertising campaigns throughout the forecast period. Brazil’s share was just under one-third of the total. But Brazil hosts a promising mobile community: Mobile internet users are expected to grow from 18% to 45% of the country’s population between 2012 and 2016. ■■ Mobile ad spending in Latin America increased 86% in 2012, and is expected to slow by only 9 percentage points in 2013.At 90.4% last year, Brazil experienced the fastest gains in mobile ad spending in Latin America through 2015, driving the region’s expansion in spending.Argentina and Mexico increased at a similar rate in 2012, 73% and 75.6%, respectively. ■■ Mobile ad spending will make up a very small portion of digital ad spending in Latin America, growing from 2.3% in 2012 to 8% in 2016. Mexico will drive this growth in share as mobile expands from 7.8% to 19.3% of the country’s digital ad spending within the next four years. millions Mobile, Digital and Total Media Ad Spending in Latin America, by Country, 2012 & 2016 Mobile Digital Total media Brazil Mexico Argentina Other Latin America 2012 $25 $42 $6 $7 $79 2016 $198 $260 $38 $85 $581 2012 $1,990 $532 $343 $505 $3,370 2016 $4,013 $1,343 $848 $1,059 $7,263 2012 $18,729 $4,473 $4,171 $7,282 $34,655 2016 $28,043 $6,084 $6,921 $10,284 $51,333 Note: numbers may not add up to total due to rounding Source: eMarketer, Dec 2012 148486 www.eMarketer.com 148486 Mobile, Digital and Total Media Ad Spending CAGR and Share in Latin America, by Country, 2012-2016 Mexico Brazil Argentina Other Latin America 11.9% 10.6% 8.2% 6.9% 9.7% 22.1% 14.3% 12.3% 10.3% 14.1% 7.8% 1.2% 1.7% 1.4% 2.3% 19.3% 4.9% 4.4% 8.1% 8.0% 58.1% 68.5% 59.1% 85.4% 64.6% 26.0% 19.2% 25.4% 20.3% 21.2% 8.0% 10.6% 13.5% 9.0% 10.3% Source: eMarketer, Dec 2012 148487 www.eMarketer.com Digital % of total Mobile % of digital 2012 2016 2012 2016 CAGR (2012-2016) Mobile Digital Total media 148487 Middle East & Africa ■■ The Middle East and Africa, as a combined region, has the least developed advertising economy in the world, with only $17.2 billion in expenditures last year. Despite this small base, total media ad spending will not grow as fast in the Middle East and Africa as in other emerging regions. Based on new data, eMarketer has lowered its growth projection for total media ad spending to 7.5% in 2012 from the previous forecast of 12.5%. By 2016, allocations will only reach $22 billion. ■■ The Middle East and Africa does lead in terms of worldwide digital ad spending growth. Investments expanded by 47.9% in 2012, but totaled only $871 million, or 5% of the region’s overall advertising outlay. eMarketer’s growth forecast is high, driven by more advertising investment and strengthening of consumer spending. Digital expenditures will reach $2.9 billion by the end of the forecast period. The question of whether or not viable economies will result from recent political changes has contributed to uncertainty about the region, as has the lack of measurement systems, which have prevented marketers from receiving demonstrable return on investment. ■■ eMarketer estimates that the amount spent on mobile advertising throughout the Middle East and Africa came to $7 million in 2012, or less than 1% of the region’s digital ad spending. But mobile ad expenditures are rising rapidly and will experience the fastest regional growth worldwide this year. eMarketer has revised its growth forecast upward for 2012 to 100% from 73.3%. But with spending barely reaching $60 million in 2016, the Middle East and Africa still has a few years to go before mobile advertising has any major revenue potential. millions Mobile, Digital and Total Media Ad Spending in the Middle East & Africa, 2012 & 2016 2012 $7 $871 $17,158 2016 $58 $2,923 $21,975 Mobile Digital Total media Source: eMarketer, Dec 2012 148488 www.eMarketer.com 148488 Latin America
- 10. Worldwide Ad Spending Forecast: Emerging Markets, Mobile Provide Opportunity for Growth Copyright ©2013 eMarketer, Inc. All rights reserved. 10 Mobile, Digital and Total Media Ad Spending CAGR and Share in the Middle East & Africa, 2012-2016 Middle East & Africa 5.1% 13.3% 0.8% 2.0% 69.6% 35.4% 6.4% Source: eMarketer, Dec 2012 148489 www.eMarketer.com Digital % of total Mobile % of digital 2012 2016 2012 2016 CAGR (2012-2016) Mobile Digital Total media 148489 North America ■■ North America surpasses all other regions worldwide in ad spending. Advertisers in the US and Canada invested $179.3 billion in total media advertising in 2012 and will increase their allocations to $204.4 billion in 2016, eMarketer predicts. With $166 billion in ad dollars in 2012, the US accounted for more than 92% of expenditures in the region. ■■ Total media ad spending in the US is near maturity, but experienced a bump in growth in 2012, boosted by higher spending around the Summer Olympics and the US presidential election. eMarketer expects that the US grew its ad spending by 4.9% last year, but growth will fall to 3.4% in 2013.Thereafter, increases will slow moderately throughout the forecast period. eMarketer has decreased its estimate for 2012 from its previous forecast of 6.7% based on reductions in the growth of digital ad spending, which is a main driver of total media ad spending growth. Percentage gains in Canada will be on a similar trajectory to the US through 2016. ■■ North America leads in digital ad spending worldwide due to large investments from US advertisers.The US committed $37.1 billion to digital advertising last year compared to Canada’s $3 billion, figures reflecting the much greater number of advertisers and digital users in the US vs. Canada. ■■ At 16.8%, the US had slightly higher growth in digital ad spending than Canada’s rate of 13.5% last year.This trend will continue through 2014. Based on the Interactive Advertising Bureau’s (IAB) data for the first half of 2012 and on digital ad spending’s faster-than-expected maturation, eMarketer has lowered the projected 2012 rate of increase for US digital ad spending from its earlier forecast of 23.3%. ■■ Because the US tends to guide digital trends elsewhere, the factors driving the growth of US digital ad spending will point to what will feed digital ad spending expansion across the globe. Digital video—the fastest-growing digital ad format—will especially help drive digital ad spending in North America. ■■ Digital ad spending claimed the second-largest share of the ad market in the US in 2012, at 22.5%, trailing only spending on TV. Digital’s share will grow throughout the forecast period, reaching 29.2% in 2016. A similar share for digital was seen in Canada in 2012. In 2016, Canada’s digital share will be 5 percentage points greater than digital’s share of total ad spend in the US. ■■ eMarketer has increased its US growth projection for 2012 mobile ad spending to 220% from its previous projection of 80%. This increase is largely due to Google and Facebook’s faster-than-expected transition to mobile advertising. Strong mobile ad revenues for Twitter and Pandora as well as for mobile ad networks have also contributed to Middle East & Africa
- 11. Worldwide Ad Spending Forecast: Emerging Markets, Mobile Provide Opportunity for Growth Copyright ©2013 eMarketer, Inc. All rights reserved. 11 this upward revision. Driven by this massive uptick in US mobile ad spending, North America surpassed Asia-Pacific last year to become the region with the largest mobile ad investment worldwide. ■■ Mobile ad spending in the US will increase nearly 450% between 2012 and 2016, to $20.7 billion from $3.8 billion. At $110 million in 2012, Canada’s allocation was much smaller, though it is expected to increase by more than 500% by 2016, when it will total $691 million. ■■ With mobile advertising taking 10.4% of digital media advertising in the US in 2012, it is clear that, though marketers have begun to take advantage of mobile, much opportunity for growth will remain. By 2016, mobile’s share will increase to 37.6% of digital ad spending. For more on advertising trends in the US, see eMarketer’s October 2012 report “US Ad Spending Forecast: Fall 2012 Update.” millions Mobile, Digital and Total Media Ad Spending in North America, by Country, 2012 & 2016 Mobile Digital Total media US Canada North America 2012 $3,839 $110 $3,948 2016 $20,700 $691 $21,392 2012 $37,081 $3,043 $40,124 2016 $55,052 $4,738 $59,790 2012 $165,960 $13,376 $179,337 2016 $189,226 $15,207 $204,432 Note: numbers may not add up to total due to rounding Source: eMarketer, Dec 2012 148490 www.eMarketer.com 148490 Mobile, Digital and Total Media Ad Spending CAGR and Share in North America, by Country, 2012-2016 Canada US North America 22.8% 22.3% 22.4% 31.2% 29.1% 29.2% 3.6% 10.4% 9.8% 14.6% 37.6% 35.8% 58.4% 52.4% 52.6% 11.7% 10.4% 10.5% 3.3% 3.3% 3.3% Source: eMarketer, Dec 2012 148491 www.eMarketer.com Digital % of total Mobile % of digital 2012 2016 2012 2016 CAGR (2012-2016) Mobile Digital Total media 148491 Western Europe ■■ Total media ad spending in Western Europe reached $120.3 billion last year, making it the region with the third-largest sum worldwide. At $27.7 billion and $23.9 billion last year, respectively, Germany and the UK had the two largest tallies of total media advertising in the region in 2012. Despite high levels of spending, advertisers are cautious due to economic uncertainty in the region. Because of this, spending for France, Germany, Italy, Spain and the UK have been reduced from eMarketer’s July 2012 forecast. ■■ Ad spending growth in Western Europe will be the slowest for any region throughout eMarketer’s forecast period. Like in North America, spending in Western Europe is reaching maturity. This status, combined with the regional debt crisis and the implementation of austerity measures in several countries in the region, will contribute to spending gains lower than the worldwide average through 2016. A decline in growth will be seen in Spain, Italy and Finland this year. The economies of Italy and Spain were hit especially hard in 2012. eMarketer expects growth to rebound in 2013 and 2014 for all of the countries in the region. ■■ For the first time, eMarketer has included Denmark, Finland, the Netherlands, Norway and Sweden in its Western Europe ad spending forecast. Because these countries tend to be smaller markets, their total media ad spending pales in comparison to the amount spent in the EU-5 countries (i.e., France, Germany, Italy, Spain and the UK). ■■ $27.7 billion in ad spending in Western Europe was allocated towards digital last year. More than one-third of digital ad expenditures in the region originated from the UK. eMarketer has lowered its prediction for digital ad spending across Western Europe due to the region’s unsteady economies. ■■ Like for total media ad spending, Western Europe had the slowest digital ad spending growth worldwide, at 10.6% in 2012. At 14%, the UK led Western Europe in digital ad spending gains, followed by Germany and Sweden. These countries have been less affected by the European debt crisis and have strong, highly engaged digital audiences that marketers are connecting with. Display formats like rich media and video will gain significant marketer attention throughout the forecast period. ■■ Digital ad spending as a percentage of total media ad spending in Western Europe will be on par with North America throughout the forecast period, although it will vary from country to country. Last year, the UK had the greatest share worldwide of total media ad spending allocated to digital, at 36.7%, while digital ad spending was only 13% of total media ad spending in Italy. North America
- 12. Worldwide Ad Spending Forecast: Emerging Markets, Mobile Provide Opportunity for Growth Copyright ©2013 eMarketer, Inc. All rights reserved. 12 ■■ Despite the fact that more than one in four people in Western Europe went online via a mobile device last year, mobile advertising investments in the region remained small compared to North America and Asia-Pacific. Total mobile spending in Western Europe totaled $1.65 billion in 2012. This is expected to increase to $8.4 billion by 2016. With $721 million committed to mobile advertising, the UK accounted for just under half of the region’s total last year. ■■ Based on new data, eMarketer increased its estimate of 2012 mobile ad spending growth in Western Europe, raising the gain to 95% from 68.3%. At 170%, Sweden experienced particularly aggressive growth last year. The country’s small level of mobile ad spending combined with rapid consumer adoption of mobile devices and marketers becoming more engaged in mobile advertising will continue contributing to the expansion. But Sweden’s growth rate will become more consistent with that of its neighbors when it drops to 70% in 2013. The UK and Norway also experienced robust gains in 2012, at 120% each. ■■ Western Europe’s developed economies and high smartphone usage will help push advertisers in the region to allocate larger portions of their budgets toward mobile throughout the forecast period. Across Western Europe, mobile’s share of digital ad spending will climb to 22% in 2016 from 6% in 2012. By 2016, 28% of digital ad spending in the UK will be devoted to mobile advertising, while more than 18% of total digital dollars in Denmark, Germany, Italy and Norway will come from mobile. millions Mobile, Digital and Total Media Ad Spending in Western Europe, by Country, 2012 & 2016 Mobile Digital Total media Germany UK France Italy Spain Netherlands Sweden Norway Denmark Finland Other Western Europe 2012 $225 $721 $140 $113 $39 $78 $59 $51 $48 $21 $151 $1,648 2016 $1,393 $3,458 $626 $509 $207 $354 $211 $204 $189 $85 $1,154 $8,389 2012 $5,444 $8,796 $2,918 $1,702 $1,236 $1,572 $957 $827 $743 $359 $3,105 $27,521 2016 $7,486 $12,412 $4,004 $2,725 $1,843 $2,061 $1,214 $1,104 $1,001 $474 $4,342 $38,664 2012 $27,689 $23,968 $16,315 $12,895 $7,395 $5,597 $3,926 $2,895 $2,368 $1,892 $15,344 $120,284 2016 $29,301 $27,520 $17,062 $14,274 $8,213 $5,796 $4,183 $3,195 $2,513 $2,018 $17,147 $131,221 Note: numbers may not add up to total due to rounding Source: eMarketer, Dec 2012 148494 www.eMarketer.com 148494 Mobile, Digital and Total Media Ad Spending CAGR and Share in Western Europe, by Country, 2012-2016 UK Denmark Norway Netherlands Sweden Germany Finland France Spain Italy Other Western Europe 36.7% 31.4% 28.6% 28.1% 24.4% 19.7% 19.0% 17.9% 16.7% 13.2% 20.2% 23.0% 45.1% 39.8% 34.5% 35.6% 29.0% 25.5% 23.5% 23.5% 22.4% 19.1% 25.3% 29.5% 8.2% 6.5% 6.2% 5.0% 6.2% 4.1% 5.9% 4.8% 3.2% 6.6% 4.9% 6.0% 27.9% 18.9% 18.5% 17.2% 17.4% 18.6% 17.9% 15.6% 11.2% 18.7% 26.6% 21.7% 48.0% 40.6% 41.2% 45.8% 37.5% 57.7% 41.2% 45.4% 51.6% 45.7% 66.3% 50.2% 9.0% 7.7% 7.5% 7.0% 6.1% 8.3% 7.2% 8.2% 10.5% 12.5% 8.7% 8.7% 3.5% 1.5% 2.5% 0.9% 1.6% 1.4% 1.6% 1.1% 2.7% 2.6% 2.8% 2.2% Source: eMarketer, Dec 2012 148495 www.eMarketer.com Digital % of total Mobile % of digital 2012 2016 2012 2016 CAGR (2012-2016) Mobile Digital Total media 148495 Western Europe
- 13. Worldwide Ad Spending Forecast: Emerging Markets, Mobile Provide Opportunity for Growth Copyright ©2013 eMarketer, Inc. All rights reserved. 13 Conclusions North America will continue to dominate global total media ad spending but will lose share throughout the forecast period. Total media ad spending has reached maturity in North America and Western Europe but will continue to grow at a healthy pace in other regions— especially Asia-Pacific and Latin America. Digital ad spending will expand its share of total media ad spending through 2016. Digital ad spending is growing faster than total media ad spending and will drive overall ad spending growth. As more people become internet and mobile internet users, marketers across the globe will continue to increase their budgets for online and mobile advertising. North America will lead in digital ad spending worldwide through 2016, though its share will decline. Asia-Pacific, Eastern Europe, Latin America and the Middle East and Africa will increase expenditures in digital ad spending and become bigger players in the global digital ad market. In 2013, Asia-Pacific will surpass Western Europe to become the region with the second-highest digital ad spending. China’s massive surge in spending, and to a lesser extent India’s and Indonesia’s, will help push the region into the No. 2 position globally. Mobile ad spending will experience rapid growth in all regions in the forecast, though the amount spent in each will vary. Asia-Pacific, North America and Western Europe will commit the most ad dollars toward mobile through 2016, while expenditures will grow but remain much lower in Latin America, Eastern Europe and the Middle East and Africa. North America surpassed Asia-Pacific as the region with the highest mobile ad investments last year. By 2015, Asia-Pacific will fall to No. 3 in spending while Western Europe jumps to second place. Related eMarketer Reports US Ad Spending Forecast: Fall 2012 Update UK Digital Advertising: Spending and Trends Digital Ad Spending in Mexico: Advertising Giants Finally Join the Pioneers Digital Ad Spending by Industry: Forecasts and Key Trends China Digital Media: Usage and Marketing Trends Editorial and Production Contributors Nicole Perrin Associate Editorial Director Cliff Annicelli Senior Copy Editor Emily Adler Copy Editor Dana Hill Director of Production Joanne DiCamillo Senior Production Artist Stephanie Gehrsitz Production Artist Allie Smith Director of Charts
- 14. The world’s go-to source for information on digital marketing, media and commerce. In the fast-paced digital world, it is neither prudent nor professional to make business decisions based solely on a single source. eMarketer helps companies minimize risk and maximize opportunity by providing… COLLECTIVE WISDOM COVERAGE See all aspects of what is happening today in digital marketing, media and commerce. COLLECTION Information is gathered from thousands of research sources around the globe and hundreds of interviews with industry professionals a month. CURATION eMarketer sifts through the clutter, vets data for accuracy and distills information to its essential intelligence – to save you time. COMPARISON Side-by-side source comparison charts display all relevant information on a topic in one place. CONTEXT Focused, clear and concise, eMarketer reports provide a quick, complete picture of fast-changing digital trends to make sense of complex issues. CONVENIENCE The information you need is accessible 24/7 from your PC, laptop, tablet or smartphone—and downloadable in PDF, Excel, JPEG or PowerPoint formats. CONFIDENCE For 15 years, eMarketer has been recognized as the standard for media coverage of the digital world—cited more than 4,000 times in the New York Times and Wall Street Journal alone—and relied on by major brands and advertising agencies around the globe. COMPETITIVENESS No one in business wants to be surprised, so see the trends coming and make certain your organization always has the latest, most accurate and comprehensive digital information available—with an eMarketer Corporate Subscription. To schedule a conversation or customized demonstration, go to eMarketer.com or call 212-763-6010