Overview of the livestock sector in East Africa
•Download as PPTX, PDF•
1 like•1,219 views

Presented by Lini Wollenberg (CCAFS, Low emissions development) on 10 July 2019. It was part of the webinar Can we reduce GHG emissions from livestock? A feasibility and investment study from East Africa. This is part of a webinar series presenting recent land use and climate research by the CGIAR and supported by USAID’s Office of Global Climate Change. A recording of the webinar can be found on CCAFS youtube channel: CGIAR Research Program on Climate Change, Agriculture and Food Security.

Recommended
Recommended
More Related Content
What's hot
What's hot (20)
Similar to Overview of the livestock sector in East Africa
Similar to Overview of the livestock sector in East Africa (20)
More from CCAFS | CGIAR Research Program on Climate Change, Agriculture and Food Security
More from CCAFS | CGIAR Research Program on Climate Change, Agriculture and Food Security (20)
Recently uploaded
Recently uploaded (20)
Overview of the livestock sector in East Africa
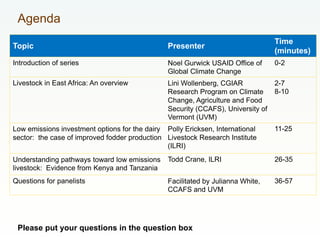
- 1. Agenda Topic Presenter Time (minutes) Introduction of series Noel Gurwick USAID Office of Global Climate Change 0-2 Livestock in East Africa: An overview Lini Wollenberg, CGIAR Research Program on Climate Change, Agriculture and Food Security (CCAFS), University of Vermont (UVM) 2-7 8-10 Low emissions investment options for the dairy sector: the case of improved fodder production Polly Ericksen, International Livestock Research Institute (ILRI) 11-25 Understanding pathways toward low emissions livestock: Evidence from Kenya and Tanzania Todd Crane, ILRI 26-35 Questions for panelists Facilitated by Julianna White, CCAFS and UVM 36-57 Please put your questions in the question box
- 2. July 9, 2019 USAID Webinar Series Can we reduce GHG emissions from livestock? Overview of the livestock sector in East Africa Lini Wollenberg, CCAFS
- 3. Livestock in East Africa: By the Numbers 2X growth of regional population and calories per person by 2050, with increasing demand for meat and dairy In EA11 to 45% of of GDP is from livestock 70% of cash income is generated from livestock 132million cattle in East Africa 9% of global cattle population of 1.5 billion Sources: FAOSTAT, Goopy 2017, Otte et al. 2019 Million cattle Percent of total Ethiopia 61 46% Kenya 18 14% Uganda 15 11% Tanzania 26 9% South Sudan 12 20% Eastern Africa 132
- 4. Kenya milk yields by cow http://www.fao.org/3/a-i7348e.pdf
- 5. Sources: FAO, FAOSTAT, Goopy 2017, Otte et al. 2019 Eastern Africa contributes 9% of global livestock emissions Emissions are 2-6X higher than other regions of Sub-Saharan Africa 49% increase in livestock emissions in East Africa 1990 -2010 70% of emissions in Sub-Saharan Africa are from livestock, mostly cattle.
- 6. Livestock in the UNFCCC Nationally Determined Contributions (2017)
- 7. Feasible low emissions development options for livestock in East Africa• Improved forage for animal feed reduces emission intensity by • 8–24% on intensive and semi-intensive dairy farms in Kenya, • as much as 27% in mixed systems in Ethiopia. • Biodigesters reduce manure emissions by • 60–80% in intensive dairy farms of 4+ cows. • Improved manure storage reduces emissions up to • 90%. • Reducing chronic disease • reduces emission intensity due to increased productivity, though rates depend on the disease. • Reducing slaughter age while improving feed quality reduces emission intensity by • 40% for sheep and goats, http://cgspace.cgiar.org/rest/bitstreams/ 151418/retrieve
- 8. Trade-offs: Feed and land use change for cattle • Kenya has pledged to reduce GHG emissions by 30% by 2030. • Improving forage quality (Napier grass) and dairy concentrate supplements, reduces emission intensities by 26%–31%, also partially achieves the national milk productivity target for 2030 by 38%–41%, shows high feasibility given the availability of arable land. • In contrast, maize silage in cattle diets increases emissions up to 10X from the land conversion required to grow more maize. Brandt et al. 2018 https://iopscience.iop.org/article/10.1088/1748- 9326/aaac84/pdf
- 9. Delivering results: livelihoods and mitigation • Barriers: initial cost, poor information available to farmers and extension services, a lack of public and private sector incentives, adaptation priorities • Women face additional constraints: lack of ownership rights and decision-making power, role confined to informal markets, and other factors. Best practice guide to socially and gender inclusive low emissions development in livestock Katie Tavenner and Todd A. Crane 2016 Social inclusion indicators (examples) • Gender of who in the household is registered with the producer organization/hub) • Gender of who in the household delivers the milk • Number of women in leadership positions/are board members Source: https://ccafs.cgiar.org/publications/best-practice-guide-socially-and-gender- inclusive-development-kenyan-intensive-dairy#.XSU0ui3MzEY
- 10. Climate finance opportunities Nationally Appropriate Mitigation Actions (NAMAS) Green Climate Fund (GCF) Portfolio of over USD 5.23 billion with 111 projects in 99 developing countries. Kenya Dairy NAMA is under preparation • 430K farmers • 8.80 MtCO2e mitigation via • Increased dairy productivity • Energy efficiency in milk processing • Household biogas adoption
Editor's Notes
- https://cgspace.cgiar.org/bitstream/handle/10568/24964/IGAD_%20LPI_WP_%2001-11.pdf?sequence=1 Goopy et al. 2017 https://www.sciencedirect.com/science/article/pii/S0308521X17305267 Otte et al. 2019 https://www.ncbi.nlm.nih.gov/pmc/articles/PMC6395385/
- FAO infographics
- From : The feasibility of low emissions development interventions for the East African livestock sector: Lessons from Kenya and Ethiopia
- https://iopscience.iop.org/article/10.1088/1748-9326/aaac84/pdf To what extent the improvement of feed quality and manure management may contribute to the milk productivity target of Kenya’s national dairy master plan and to the national mitigation target (NDC) given the availabil- ity of arable land. Total GHG emissions were higher for all scenarios in relation to the baseline, with the lowest increases of 3.4%–12.1% for the FoCo scenarios at medium and high level of intensification respectively. However, the reduction of emission intensities by 30.6% (1.7 ± 0.03 kg CO2 eq kg FPCM−1 ) and 25.7% (1.8 ± 0.03 kg CO2 eq kg FPCM−1 ) was achieved through improve- ments in forage quality by increasing the proportion of Napier grass in the diet and through supplementing dairy concentrates during early lactation. In addition, emission intensities were reduced by covering manure heaps. The overall reduction of N2O emissions from manure management by 68% is in line with the reduc- tion potential reported in the literature on management of cattle manure (Chadwick 2005, Hou et al 2015). Mottet et al (2016) estimated the potential to reduce emission intensities by up to 14% through the improve- ment of feed quality alone in East Africa at a regional scale. Bryan et al (2013) reported a potential to reduce emission intensities (CH4 emissions only) by up to 60% through the increase of feed quality in a modelling study covering highland areas in Kenya, yet omitting likely emissions from LUC. With reductions of 26%– 31%, this study ranks moderately compared to these findings, yet is more robust as detailed feed data and LUC emissions were included. The FoCo scenarios at medium and high inten- sification level led to relatively high achievement rates of the national dairy master plan target (Gov- ernment of Kenya 2010) increasing milk yields by 38.3% and 40.5% respectively. These scenarios led to the lowest increase in total GHG emissions by 3.4% and 12.1% respectively, complying with the NDC target (Government of Kenya 2015b), while facing the smallest shortage of arable land across the dairy region (0.5% and 2.8% respectively) (figure 4). Thus, these two scenarios present the lowest trade-offs between national level target The scenarios were derived through combinations of the three feed intensification strategies (figure 2) and are henceforth called: ‘forage quality and con- centrate supplementation (FoCo)’, ‘feed conservation and concentrate supplementation (FeCo)’, ‘forage quality and feed conservation (FoFe)’, and ‘forage quality, feed conservation and concentrate supple- mentation (FoFeCo)’. Each scenario was developed at medium and high level of intensification (figure 2). For the Fo and Fe strategies, baseline feeds were replaced by 25% and 50% with higher quality alternatives. The supplementation of dairy concentrates was increased for the Co strategy by 3 and 6 kg day−1 during the first 150 d of lactation. Covering manure heaps may reduce emissions from manure management by 68%.
- Planned NAMA Activities Over 10 years, will reduce dairy emission by 8.80 million tCO2e: Increased dairy productivity (152,700 households): 4.14 M tCO2 eq Energy efficiency in processing (151 facilities): 2.96 M tCO2 eq Household biogas adoption (20,000 households): 0.98 M tCO2 eq