Frontier Communications Corporation technical analysis charts
•
1 like•179 views

Frontier Communications Corporation technical analysis charts

Recommended
Recommended
More Related Content
Recently uploaded
Recently uploaded (20)
Featured
Featured (20)
Frontier Communications Corporation technical analysis charts
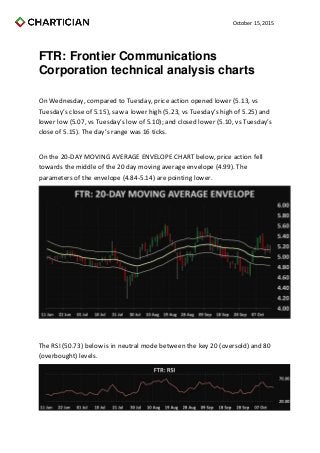
- 1. October 15, 2015 FTR: Frontier Communications Corporation technical analysis charts On Wednesday, compared to Tuesday, price action opened lower (5.13, vs Tuesday’s close of 5.15), saw a lower high (5.23, vs Tuesday’s high of 5.25) and lower low (5.07, vs Tuesday’s low of 5.10); and closed lower (5.10, vs Tuesday’s close of 5.15). The day’s range was 16 ticks. On the 20-DAY MOVING AVERAGE ENVELOPE CHART below, price action fell towards the middle of the 20 day moving average envelope (4.99). The parameters of the envelope (4.84-5.14) are pointing lower. The RSI (50.73) below is in neutral mode between the key 20 (oversold) and 80 (overbought) levels.
- 2. October 15, 2015 The MACD 12 day moving average is above the MACD 26 day moving average; both are above zero. The Slow Stochastics, below, are in negative mode, with the K line below the D line. The Commodity Channel Index (53.90), below, is in positive mode above the oversold -200 level. On the DAILY BOLLINGER BANDS CHART below, Wednesday represents the 3rd consecutive entire day above the middle of the Bollinger Band envelope (4.99), in negative mode towards the middle of the envelope The Bollinger Bands (4.57- 5.40) are converging; and narrowed from a width of 84 ticks on Tuesday to a width of 83 ticks on Wednesday.
- 3. October 15, 2015 On the 5 AND 20 DAY MOVING AVERAGES CHART below, the 5 day moving average (5.19, moving down) is above the 20 day moving average (4.99, moving down), in positive mode. The 3-50 day strip of moving averages ranges from the 20 day moving average (4.99) at the bottom of the range to the 5 day moving average (5.19) at the top of the range. The Parabolic Stop and Reverse (5.01) below is in the 8th day of buy mode.
- 4. October 15, 2015 On the WEEKLY BOLLINGER BANDS CHART below, last week represents the 1st consecutive entire week below the top Bollinger Band (5.47). The Bollinger Bands (4.61-5.47) are pointing lower; contracting from a width of 87 ticks on Tuesday to a width of 86 ticks on Wednesday.