Climate-smart, site-specific agriculture: reducing uncertainty on when, where and how to grow rice in Colombia
•
0 recomendaciones•181 vistas

Poster presented at CSA Global science conference in Montpellier (2015). Daniel Jimenez , Sylvain Delerce, Hugo Andres Dorado, Maria Camila Rebolledo , Gabriel Garces, Edgar Torres
Recomendados

Recomendados
Más contenido relacionado
La actualidad más candente
La actualidad más candente (20)
Similar a Climate-smart, site-specific agriculture: reducing uncertainty on when, where and how to grow rice in Colombia
Similar a Climate-smart, site-specific agriculture: reducing uncertainty on when, where and how to grow rice in Colombia (20)
Más de Decision and Policy Analysis Program
Más de Decision and Policy Analysis Program (20)
Último
Último (20)
Climate-smart, site-specific agriculture: reducing uncertainty on when, where and how to grow rice in Colombia
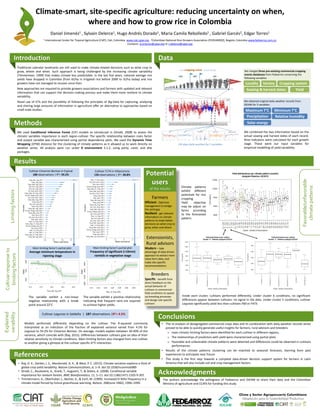
- 1. Climate-smart, site-specific agriculture: reducing uncertainty on when, where and how to grow rice in Colombia Daniel Jimenéz1 , Sylvain Delerce1, Hugo Andrés Dorado1, Maria Camila Rebolledo1 , Gabriel Garcés2, Edgar Torres1 1 International Center for Tropical Agriculture (CIAT), Cali, Colombia www.ciat.cgiar.org . 2Colombian National Rice Growers Association (FEDEARROZ), Bogotá, Colombia www.fedearroz.com.co Contacts: d.jimenez@cgiar.org or s.delerce@cgiar.org We used Conditional Inference Forest (CIF) models as introduced in (Strobl, 2008) to assess the climatic variables importance in each region-cultivar. The specific relationship between main factor and output variable was characterized using partial dependence plots. We used the Dynamic Time Wrapping (DTW) distance for the clustering of climate patterns as it allowed us to work directly on weather series. All analysis were run under R environment 3.1.2, using party, caret, and dtw packages. Limitingfactors Traditional calendar landmarks are still used to make climate-related decisions such as what crop to grow, where and when. Such approach is being challenged by the increasing climate variability (Timmerman, 1999) that makes climate less predictable. In the last five years, national average rice yields have dropped in Colombia (from 6t/ha in irrigated rice before 2009 to 5t/ha today) and rice growers have not managed to recover since then. New approaches are required to provide growers associations and farmers with updated and relevant information that can support the decision making process and make them more resilient to climate variability. Novel use of ICTs and the possibility of following the principles of Big-Data for capturing, analyzing and sharing large amounts of information in agriculture offer an alternative to approaches based on small scale studies. Explained variability We merged three pre-existing commercial cropping events databases from Fedearroz conserving the following variables: Cultivarresponseto limitingfactors Inside each cluster, cultivars performed differently. Under cluster 6 conditions, no significant differences appear between cultivars: no signal in the data. Under cluster 5 conditions, cultivar Lagunas significantly yield less than cultivars F60 or F473. We combined the two information based on the actual sowing and harvest dates of each record. Nine indicators were calculated for each growth stage. These were our input variables for empirical modelling of yield variability. We obtained original daily weather records from IDEAM for 5 variables: The variable exhibit a non-linear negative relationship with a break point around 22°C The variable exhibit a positive relationship indicating that frequent rains are required to achieve higher yields. Potential users of the results Farmers Efficient - Optimize management to bridge the yield gap Resilient - get relevant information on climate patterns to make better decisions on what crop to grow, when and where Extensionists, Rural advisors Modern – take advantage of data-driven approach to extract more value form data, and make site-specific recommendations Breeders Specific - benefit from direct feedback on the actual behavior of cultivars in commercial field conditions to speed- up breeding processes and design site-specific cultivars Models performed differently depending on the cultivar. The R-squared commonly interpreted as an indication of the fraction of explained variance varied from 4.5% for Lagunas to 59.2% for Cimarron Barinas. On average, models explain between 30-40% of the variance, which coincide with (Ray, 2015). Differences between cultivars give an idea of their relative sensitivity to climate conditions. Main limiting factors also changed from one cultivar to another giving a glimpse at the cultivar specific G*E interaction. Cultivar F174 in Villavicencio 134 observations | R2= 28.8% Cultivar Lagunas in Saldaña | 187 observations |R2= 4.5% Climate patterns exhibit different potentials for rice cropping. Yield objective may be adjust on farms according to the forecasted pattern. Favorable/unfavorable climatepatterns 120 days daily weather for 5 variables Locality Variety Cropping system Sowing & harvest dates Yield Maximum T°C Minimum T°C Precipitation Relative humidity Solar energy Cultivar Cimarron Barinas in Espinal 180 observations | R2= 59.2% Main limiting factor’s partial plot: Average minimum temperature in ripening stage Main limiting factor’s partial plot: Frequency of significant (>10mm) rainfalls in vegetative stage Yield Yield • The re-analysis of desegregated commercial crops data and its combination with daily weather records series proved to be able to quickly generate useful insights for farmers, rural advisors and breeders: o main climatic limiting factors were identified for each cultivar in different regions, o The relationships of predictors with yield were characterized using partial plots o Favorable and unfavorable climate patterns were detected and differences could be observed in cultivars performances • Results of the climate patterns clustering can be matched to seasonal forecasts, learning form past experiences to anticipate near future. • This study is the first step towards a complete data-driven decision support system for farmers in Latin America that will also include soil and crop management factors.• Ray, D. K., Gerber, J. S., Macdonald, G. K., & West, P. C. (2015). Climate variation explains a third of global crop yield variability. Nature Communications, 6, 1–9. doi:10.1038/ncomms6989 • Strobl, C., Boulesteix, A., Kneib, T., Augustin, T., & Zeileis, A. (2008). Conditional variable importance for random forests. BMC Bioinformatics, 11, 1–11. doi:10.1186/1471-2105-9-307 • Timmermann, A., Oberhuber, J., Bacher, A., & Esch, M. (1999). Increased El Niño frequency in a climate model forced by future greenhouse warming. Nature, 398(June 1982), 1996–1999. The authors acknowledge the willingness of Fedearroz and IDEAM to share their data and the Colombian Ministry of agriculture and CCAFS for funding this study. Introduction Results Data Methods Conclusions References Acknowledgments