SlideShare una empresa de Scribd logo
1 de 8
Descargar para leer sin conexión
End-to-End Root Cause Analysis
Minimize the time to incident resolution
End-to-End Root Cause Analysis in SAP Solution Manager offers capabilities for cross system and
technology root cause analysis. Especially in heterogeneous landscapes it is important to isolate a
problem causing component as fast as possible and involve the right experts for problem
resolution. With the toolset provided by Root Cause Analysis this is possible with the same tool
regardless of the technology an application is based on and it allows a first in depth analysis by a
generalist avoiding the ping-pong game during an analysis between different expert groups.
Contents
Introduction.........................................................1
End-to-End Tools in Root Cause analysis .......3
End-to-End Workload Analysis..........................3
End-to-End Change Analysis ............................4
End-to-End Exception Analysis .........................5
End-to-End Trace Analysis................................6
Availability...........................................................7
Where to find more information ........................8
INTRODUCTION
Customer’s heterogeneous IT landscapes running
mission critical applications have become
increasingly complex during the last decade.
Finding the root cause of an incident in those
environments can be challenging. This creates the
need for a systematic top-down approach to
isolate a component causing the problem. The
approach must be supported by tools, helping
customers to do this as efficiently as possible.
End-to-End Root Cause Analysis provides tools
that support customers and SAP in performing a
root cause analysis across different support levels
and different technologies. The basic idea behind
Root Cause Analysis is to determine where and
why a problem occurred.
A typical example (see Figure 1) is a problem
where an end user experiences a problem while
maintaining his bank account data in the
corporate portal, the cause may be on the client
PC (e.g. browser), in the network or somewhere in
the server environment, which itself might
comprise different instances of vary-ing
technologies. In this example the client request in
question first hits a SAP NetWeaver Portal (based
on SAP AS Java), then reaches a SAP ERP
System (based on SAP AS ABAP) via a RFC call
and finally results in a SQL statement which
retrieves information from the ERP database.
Figure 1: A typical scenario for Root Cause Analysis
The performance problem or functional defect
might have occurred in any of those systems.
SAP’s root cause analysis tools help to identify
the specific system part, which has caused the
error.
When such an issue occurs that affects the
customers productive solution the central goal of
the customer’s IT team is to provide an immediate
corrective action (workaround), which restores
service operations as quickly as possible and
which affects end users minimally, a complete
Copyright/Trademark
solution to the issue at hand by isolating the area
of concern.
Additionally, with respect to operation, SAP’s root
cause analysis tools are designed to reduce the
number of resources in each step of the resolution
process. An IT generalist with core competence in
root cause analysis, who involves a Component
Expert, are mostly enough to investigate an issue
and nail it down.
Therefore Root Cause Analysis offers tools for
each task in cross-component (end-to-end
analysis) and component-specific analysis. Per
definition, a cross-component analysis involves
several systems or technology stacks, whereas
component-specific analysis deals with one sys-
tem or technology stack.
Overall, Root Cause Analysis works towards
simplifying the problem resolution process with-in
an IT environment and reducing the total cost of
ownership. Benefits SAP’s tools for Root Cause
Analysis are:
 Ensured continuous business availability –
Root Cause Analysis helps to accelerate the
problem resolution process.
 Reduced costs for support experts - The
targeted top-down approach of RCA supports
a one step dispatching of issues from an IT
Generalist to a Component Expert.
 Reduced license costs - Supporting RCA
Tools offered by SAP are part of the standard
maintenance contract and come at no
additional fee.
 One safe access channel to all systems –
Root Cause Analysis provides one safe and
central access channel to the customer’s
landscape. If required, an investigation is
continued on the system in concern using a
predefined support user (SAPSUPPORT), who
is only assigned read-only rights.
 Collected data is displayed in unified views,
thereby abstracting data from the underlying
technology stack. This approach supports the
structured top down analysis approach, as
generalists and experts start investigating at
one common point.
 Empowers the customer to solve problems
himself - Nobody knows the customer’s
landscape as well as the customer himself.
E2E Root Cause Analysis provides expert
tools which enable a customer to quickly solve
problems, thereby reducing overall resolution
time.
All tools and applications are available in the Root
Cause Analysis Workcenter (see Figure 2) in SAP
Solution Manager.
Figure 2: Root Cause Analysis Workcenter
The tools are grouped in different categories
along the usage in the analysis process, but all
tools share a common navigation paradigm.
Before you start one of the available tools, a
detailed selection allows you to define queries
which group systems. So each user can define
queries containing the systems, hosts or
databases depending on his work focus (e.g. one
query for all production systems, one query
containing all CRM systems and so on). Based on
these queries, you select one or multiple entries
that you want to analyze and then start one tool in
this context.
 End-to-End Workload Analysis: If a
customer faces a performance problem, E2E
Workload Analysis might be the tool to start
with. Solution Manager regularly collects
performance information of each system and
makes this data centrally available in the
Solution Manager Work Center RCA. The
Workload Analysis allows to identify general
performance bottlenecks such as sizing
problems, or problems which affect all users
who are using a particular system.
 End-to-End Trace Analysis: End-to-End
Trace is a tool for isolating a single user
interaction through a complete landscape and
providing trace information on each of the
involved components for one interaction only,
starting with the user interaction in the browser
and ending with data being committed to the
database. Identifying long running user
requests within a complex system landscape is
the most common use case of E2E Trace
Analysis, but you can also identify which
functional errors have occurred during the
execution of one request. These exceptions
(like a dump) are then attached to the trace. So
the trace can also be used to do functional
testing and ensuring that an activity executed
in one system does not lead to functional
errors in connected systems during the request
execution.
 End-to-End Change Analysis If a system
behaves differently after a certain date or
change, E2E Change Analysis is the first tool
Copyright/Trademark
to use. It displays changes (e.g. transports and
support package updates, profile parameter
changes,…) that have been applied to a
system within a certain timeframe. The Change
Analysis application is based on a central
Configuration & Change Database (CCDB).
The CCDB provides the foundation for change
analysis and change reporting based on daily
configuration of system, host and database
related configuration data. A Change Analysis
can then be performed on all information
stored in the CCDB. Furthermore it is possible
to compare different systems and generate a
report which contains the results. This
approach identifies the problem by comparison
rather than by drilling down, which is faster and
easier in most cases.
 End-to-End Exception Analysis E2E
Exception Analysis provides unified access to
exceptions reflecting in high severity log
entries and dumps. Exception Analysis
provides the basis for statistical analysis on
exception in the landscape, but also allow to
access component specific log and dump
viewers directly with a jump-in to the
appropriate tool on the managed system.
 System Analysis: In case of Java based
system the Wily transaction trace can be used
to identify which part of a request in a Java
environment caused the problem. Wily
Introscope is shipped by SAP with
preconfigured dash boards, offering dedicated
views for the SAP Application Server Java. A
deep analysis of Java problems is possible in
the investigator mode, which displays detailed
performance metrics. Several other system
analysis tools as Thread Dump Analysis,
Change Reporting and Central LogViewer are
provided.
 Host Analysis: With the Host Analysis section
of the RCA Work Center it is possible to
analyze the most important OS metrics like
CPU, memory, paging, network and disk/file
system. In addition the filesystem browser
allows a central read-only access to predefined
directories on the managed system without
having to logon to the console of the managed
system. In the same manner it is also possible
with the OS Command Console, to execute
predefined, non destructible commands (like a
ping, netstat, iostat and so on). Both tools work
ensure that even whilst access to the managed
system is granted, no change can be made, no
business data can be accessed and not
harmful commands can be executed.
 Database Analysis: The DB Analysis
summarizes DB Performance Warehouse
specific metrics across all supported DB types.
This also includes standalone DB’s that are
connected to the DBA Cockpit within Solution
Manager
 Client side Analysis: If the outcome of an
analysis is that the problem is located on the
client side, SAP offers the tool BMC AppSight
to analyze the problem further. At least one
resource should exist in the customers IT
department who received a special training for
this tool. BMC AppSight is free of charge if only
used in combination with SAP systems and
with recording profiles offered by SAP.
END-TO-END TOOLS IN ROOT CAUSE
ANALYSIS
All the End-To-End tools available in SAP Solution
Manager are built on the same infrastructure and
follow a common navigation approach.
First, the infrastructure: Data is collected from the
managed system using multiple channels. For
ABAP based systems a direct communication
channel from the SAP Solution Manager system
towards the managed system exist with the RFC
connections. For all other system types data is
collected via CA Wily Introscope. Introscope is an
essential part and available free of charge in the
so called Right To View (RTV) license. This allows
customers to use the SAP delivered
instrumentation and dashboards without having to
buy a separate license.
In addition, the Diagnostics Agent is used to
collect additional data, like files from the file
system, for all system types.
Second, the navigation: All the tools share a
common principle. You start with an overview
which shows you the most important information
in a condensed format. Which data finally gets
displayed is defined by a timeframe selection.
More detailed information is always available with
a drill down. Most of the data presented in the
tools is stored in the BW system which is
integrated in SAP Solution Manager. The whole
data extraction, aggregation and deletion process
is managed by the so called Extractor Framework
(EFWK) and no manual interaction is needed. The
EFWK also has an integrated resource control to
ensure that neither the Solution Manager nor the
managed system are overloaded with the data
extraction. Also the housekeeping is managed by
the EFWK, so that the data growth keeps at a
passable level.
Now to the tools in detail…
End-to-End Workload Analysis
The End-to-End Workload Analysis helps you to
get workload information of your complete system
landscape in order to analyze overall performance
bottlenecks in your solution. There are different
monitors and analysis tools that provide you with
key performance indicators for the different
Copyright/Trademark
components. Most commonly, an initial check of
overall workload is done to check the overall
workload.
Therefore the workload overview screen
summarizes the most important performance
KPI’s independent of the technology the system is
based on (see Figure 3)
Figure 3: Workload Analysis Overview
In addition to the overview, there are different
view types available which display the data in
different ways.
For example the Scatter view (see Figure 4)
displays the data with the Average Response
Time on the x-axis and the Accumulated
Response Time on the y-axis. Similar to the Time
Profile, data points will be displayed as hourly
average values for the chosen timeframe.
In interpreting the diagram, one can structure the
displayed area roughly in for quadrants,
distinguishing between low and high Average
Response Times on the x-axis and low and high
Accumulated Response Times. Then, the top right
quadrant with both high Average Response Time
and high Accumulated Response Time can be
regarded as a Critical Quadrant. Values in here
have the strongest impact on the system they
were measured on.
Figure 4: Scatter Chart
From here you can do the drill down to product
specific KPI’s. In the following diagram, you see
an example of the structuring for an ABAP based
system:
Figure 5: ABAP Workload Summary
By utilizing this drilldown you can find what is
causing the general performance bottleneck and
start foolow up activities. It is also possible with
standard BW functionality to further drill down in
the detailed metric views by right clicking on a
column and choosing from the list of available
drill-down options (like in Figure 6).
Figure 6: Drill-down options
End-to-End Change Analysis
Changes are a common starting point for
problems in your landscape. Imagine that
something worked yesterday, but it is not working
anymore today. The first question would be what
changed in between?
E2E Change Analysis is the tool to analyze
problems like this. Again, the tool starts with an
overview on the overall changes which have been
applied to the landscape (see Figure 7). You can
use the timeframe mechanism, to limit the
timeframe to the point when the problem occurred
first.
Figure 7: Change Analysis Overview
From here, the Change Analysis application
allows you again to drill down to the type of
changes and from there to the actual changes
itself. The available changes are categorized
(again depending on the system type) and then
displayed like in Figure 8 (example for an ABAP
Copyright/Trademark
system). Here you can easily identify that on a
certain date a lot of notes have been implemented
in a system, or that on another day parameter
changes have been applied to the system.
Figure 8: Change Analysis Categories
With a further drill down it’s then possible to
identify the changes in detail and also get a
history on the single change in the change
reporting application.
Figure 9: Change Reporting with history
In addition to the time based analysis, it is
possible to compare the configuration of two
systems against another one. By this it is possible
for example if you have a problem in your
production system which cannot be reproduced in
the quality assurance system, what the
configuration differences between the two
systems are.
End-to-End Exception Analysis
The E2E Exception Analysis follows the same
approach than the other two previously described
tools but displays all kinds of exception in
managed systems. This starts with dumps in an
ABAP system but also includes for example Out
of memory situations in a J2EE engine. As the
information about the exceptions is persisted on
the Solution Manager, it is prevented that the
exceptions are overwritten by a round robin log
mechanism or cleanup procedures in the
managed system. Of course not all information is
persisted on the Solution Manager system (only
relevant header data which is needed for error
statistics as type of the exception, description,
severity, time and date,user that caused the
exception,…)
Based on the available statistical information on
exceptions, the main use cases is that you want to
perform an exception trend analysis to find out if
after implementing a special path or update more
or less exceptions are occurring. Another use
case is to ensure that with a specific patch or a
SAP note a problem is fixed and the exception
does not occur anymore.
Figure 10: Overview of exceptions
In the overview (see Figure 10) you can identify in
the time profile on which time of the day which
exceptions occur, or use the history diagram to
see the distribution of exceptions over the
selected timeframe (see Figure 11).
Figure 11: History of exceptions
The drill down allows you to identify the exact
exception which is only summarized in this
diagram. Depending on the exception type more
data is stored in BW to allow an efficient first
analysis, but the complete exception data is
always available in the managed system itself and
can be reached with a jump-in from the Solution
Manager system. In the following example you
can see that 90 dumps have been triggered in the
selected timeframe by a syntax error in a test
program. Using the green jump-on, you could now
navigate to the managed system and analyze the
dump in transaction ST22.
Copyright/Trademark
Figure 12: List of dumps
Similar possibilities exist for all kind of supported
exception, like system and application errors in a
J2EE engine with a jump-in to the NetWeaver
Admininistrator.
End-to-End Trace Analysis
The main purpose of E2E Trace Analysis is
investigating problems related to a single user
activity caused by one or more user clicks in the
front end. Single user click in a Web UI or Portal
front end can trigger one or more requests to the
web server. While the web application running on
the web server processes a request, it can trigger
several requests to other components (systems)
in the solution landscape. These components on
their side can trigger additional requests to their
components and so on.
The analysis of performance and functional
problems in such a complex landscape is time
consuming and requires expert knowledge. The
end-to-end cross component tracing aims to
decrease the time for gathering the relevant trace
data related to a single user activity and simplifies
the analysis by guiding the user through the
analysis steps and identifying the component
which consumes the biggest amount of the total
execution time. In addition it is possible to find
exceptions which were triggered by the request in
one of the connected component.
This all is achieved with the help of the SAP
Passport. The passport is a simple extension of
the communication protocols used in SAP
landscape (such as HTTP or RFC) and consists of
two parts. The first one is a GUID which identifies
the requests uniquely, the second one are trace
flags which indicate which trace should be turned
on in one of the involved components.
The passport is injected on client side into the
communication and then later on passed over
from system to system. Each system that receives
a request which contains a passport turns its trace
on dynamically for the processing of this request
(based on the trace flags). When the trace is
written to the disk or the database the GUID of the
passport is included to be able to identify the
request later on. The passport is also injected into
follow up requests when another call to an
external system is made, which then turns on the
trace dynamically, write it to the disk and so on
and so on.
This means actually, that all traces throughout a
landscape can be collected for a single click of an
end-user because they are identified by the GUID
which was generated at client side. Based on the
trace information which is collected it is very easy
to identify which component took which time to
process the request (e.g. processing in java in an
Enterprise Portal, processing in a connected
ABAP system, processing on the DB, in the
network, on the client side,…) and isolate problem
causing components.
But back to the start, the E2E trace is triggered
with the HTTP client plugin for web based
scenarios or directly from the SAPGUI with the
transaction /SDF/E2E_TRACE (starting with SAP
Basis 7.20 SP6 it is also possible to start tracing
during the execution of a dialog transaction using
the function code/ $gui_e2e_trace as in Figure
13). Then the end user performs the activities
which are causing the problem and the whole
tracing process is started in the connected
backend systems.
Figure 13: SAPgui trace enabling
After the trace has been created, SAP Solution
Manager collects all the trace data from all
systems and displays the results broken down per
step in an overview screen (see Figure 14). The
trace overview allows to identify on which part of
the request execution, the most time has been
spent (e.g. client, network, server,…).
Figure 14: Trace Overview
Copyright/Trademark
In the given example it can be easily seen, that
most of the time is spent on server side, so the
next natural step is to look deeper in the server
execution and which server instances have been
involved.
As you can see in Figure 15 the execution of a
single request can spawn multiple systems.
Nevertheless it is also obvious that in the scenario
the most time is spent on the ABAP system PR2
(namely nearly 30 seconds).
Figure 15: Server summary
Following the drill down we can see that out of this
30 seconds, 26 are spent on the database, which
hints to a problem with a bad performing DB or a
not tuned SQL statement or the sheer amount of
data which is transferred
Figure 16: Trace time distribution
Now it is possible to analyze on a request level
which traces have been triggered by the request
and by this identify the function module or the
SQL statement which causes this problem.
E2E Trace is a very powerful tool which is
integrated in all SAP infrastructures and also
reused in monitoring & alerting by the End User
Experience Monitoring. This deep insight into a
SAP system gets more and more useful in today’s
highly integrated and heterogeneous landscapes.
AVAILABILITY
End-to-End Root Cause Analysis is available
since SAP Solution Manager 7.0 SP 12 up to the
latest release SAP Solution Manager 7.1.
The main differences between the releases are.
 Release prior to SAP Solution Manager 7.0
EhP1 (SPS18)
 Own application in SAP Solution Manager
Java WebDynpro
 Based on solutions to perform analysis
 Focused on ABAP & Java analysis
 SAP Solution Manager 7.0 EhP1 (SPS18) and
later
 Integrated in SAP Solution Manager
Workcenters
 Based on technical systems (no solution
required anymore)
 Flexible query based approach (each user
can define his own queries for grouping
systems)
 Focuses on all technologies used by SAP &
Partners
 SAP Solution Manager 7.1
 Focused on SAP & non-SAP
 Integration of further system & technology
types
 Personalization options for each user
 New applications for Host and Database
analysis added
In addition to these major feature deliveries, in
each SP new supported products are added. This
starts with the delivery of new instrumentation and
dashboards for CA Wily Introscope but also
includes functional enhancements in the E2E
applications to support further SAP & non-SAP
products. For a detailed description of the added
products please refer to the later mentioned SAP
Notes.
Copyright/Trademark
WHERE TO FIND MORE INFORMATION
If you want to know more, please consider the following resources:
Root Cause Analysis Home in SDN:
http://wiki.sdn.sap.com/wiki/display/TechOps/RCA_Home
Technical Operations in SDN
http://wiki.sdn.sap.com/wiki/display/TechOps
Application Lifecycle Management in general
http://service.sap.com/alm
Relevant SAP Notes:
1010428 – Supported Products with SAP Solution Manager 7.0 (and EhP1)
1293438 – Supported Partner Products
1478974 – Supported Products with SAP Solution Manager 7.1

Más contenido relacionado

La actualidad más candente

Architectural patterns for real-time systems
Architectural patterns for real-time systemsArchitectural patterns for real-time systems
Architectural patterns for real-time systemssommerville-videos
 
System analysis and_design.docx
System analysis and_design.docxSystem analysis and_design.docx
System analysis and_design.docxAlaJebnoun
 
OnTune suggestion for value_2012
OnTune suggestion for value_2012OnTune suggestion for value_2012
OnTune suggestion for value_2012Austin Lee
 
SE2_Lec 23_Introduction to Cloud Computing
SE2_Lec 23_Introduction to Cloud ComputingSE2_Lec 23_Introduction to Cloud Computing
SE2_Lec 23_Introduction to Cloud ComputingAmr E. Mohamed
 
Unit 6- Development Evolution model
Unit 6- Development Evolution model Unit 6- Development Evolution model
Unit 6- Development Evolution model arvind pandey
 
Advanced topics in software engineering
Advanced topics in software engineeringAdvanced topics in software engineering
Advanced topics in software engineeringRupesh Vaishnav
 
Unit 2-software development process notes
Unit 2-software development process notes Unit 2-software development process notes
Unit 2-software development process notes arvind pandey
 
SharePoint 2013 DR solution overview
SharePoint 2013 DR solution overviewSharePoint 2013 DR solution overview
SharePoint 2013 DR solution overviewEmilio Gratton
 
Dependable Software Development in Software Engineering SE18
Dependable Software Development in Software Engineering SE18Dependable Software Development in Software Engineering SE18
Dependable Software Development in Software Engineering SE18koolkampus
 
Dependable Systems - Structure-Based Dependabiilty Modeling (6/16)
Dependable Systems - Structure-Based Dependabiilty Modeling (6/16)Dependable Systems - Structure-Based Dependabiilty Modeling (6/16)
Dependable Systems - Structure-Based Dependabiilty Modeling (6/16)Peter Tröger
 
Product Information - Fuse Management Central 1.0.0
Product Information - Fuse Management Central 1.0.0Product Information - Fuse Management Central 1.0.0
Product Information - Fuse Management Central 1.0.0antonio.carvalho
 
TYBSC IT SEM 6 PROJECT MANAGEMENT NOTES
TYBSC IT SEM 6 PROJECT MANAGEMENT NOTESTYBSC IT SEM 6 PROJECT MANAGEMENT NOTES
TYBSC IT SEM 6 PROJECT MANAGEMENT NOTESWE-IT TUTORIALS
 
What activates a bug? A refinement of the Laprie terminology model.
What activates a bug? A refinement of the Laprie terminology model.What activates a bug? A refinement of the Laprie terminology model.
What activates a bug? A refinement of the Laprie terminology model.Peter Tröger
 

La actualidad más candente (20)

Architectural patterns for real-time systems
Architectural patterns for real-time systemsArchitectural patterns for real-time systems
Architectural patterns for real-time systems
 
System analysis and_design.docx
System analysis and_design.docxSystem analysis and_design.docx
System analysis and_design.docx
 
Internship msc cs
Internship msc csInternship msc cs
Internship msc cs
 
OnTune suggestion for value_2012
OnTune suggestion for value_2012OnTune suggestion for value_2012
OnTune suggestion for value_2012
 
ADF Performance Monitor
ADF Performance MonitorADF Performance Monitor
ADF Performance Monitor
 
SE2_Lec 23_Introduction to Cloud Computing
SE2_Lec 23_Introduction to Cloud ComputingSE2_Lec 23_Introduction to Cloud Computing
SE2_Lec 23_Introduction to Cloud Computing
 
Unit 6- Development Evolution model
Unit 6- Development Evolution model Unit 6- Development Evolution model
Unit 6- Development Evolution model
 
Checklist for artwork management software
Checklist for artwork management softwareChecklist for artwork management software
Checklist for artwork management software
 
Software Performance
Software Performance Software Performance
Software Performance
 
p850-ries
p850-riesp850-ries
p850-ries
 
Advanced topics in software engineering
Advanced topics in software engineeringAdvanced topics in software engineering
Advanced topics in software engineering
 
Unit 2-software development process notes
Unit 2-software development process notes Unit 2-software development process notes
Unit 2-software development process notes
 
SharePoint 2013 DR solution overview
SharePoint 2013 DR solution overviewSharePoint 2013 DR solution overview
SharePoint 2013 DR solution overview
 
Chromatography Data System: Expand to the Enterprise
Chromatography Data System: Expand to the Enterprise Chromatography Data System: Expand to the Enterprise
Chromatography Data System: Expand to the Enterprise
 
Ch21 real time software engineering
Ch21 real time software engineeringCh21 real time software engineering
Ch21 real time software engineering
 
Dependable Software Development in Software Engineering SE18
Dependable Software Development in Software Engineering SE18Dependable Software Development in Software Engineering SE18
Dependable Software Development in Software Engineering SE18
 
Dependable Systems - Structure-Based Dependabiilty Modeling (6/16)
Dependable Systems - Structure-Based Dependabiilty Modeling (6/16)Dependable Systems - Structure-Based Dependabiilty Modeling (6/16)
Dependable Systems - Structure-Based Dependabiilty Modeling (6/16)
 
Product Information - Fuse Management Central 1.0.0
Product Information - Fuse Management Central 1.0.0Product Information - Fuse Management Central 1.0.0
Product Information - Fuse Management Central 1.0.0
 
TYBSC IT SEM 6 PROJECT MANAGEMENT NOTES
TYBSC IT SEM 6 PROJECT MANAGEMENT NOTESTYBSC IT SEM 6 PROJECT MANAGEMENT NOTES
TYBSC IT SEM 6 PROJECT MANAGEMENT NOTES
 
What activates a bug? A refinement of the Laprie terminology model.
What activates a bug? A refinement of the Laprie terminology model.What activates a bug? A refinement of the Laprie terminology model.
What activates a bug? A refinement of the Laprie terminology model.
 

Destacado

Lesson 10 over employment, unemployment, underemployment and overtime
Lesson 10 over employment, unemployment, underemployment and overtimeLesson 10 over employment, unemployment, underemployment and overtime
Lesson 10 over employment, unemployment, underemployment and overtimeUniversity of Santo Tomas
 
International Logistics & Warehouse Management
International Logistics & Warehouse Management International Logistics & Warehouse Management
International Logistics & Warehouse Management Thomas Tanel
 
Continuous process improvement (4)
Continuous process improvement (4)Continuous process improvement (4)
Continuous process improvement (4)083805154
 
Principles Of Logistics Management
Principles Of Logistics ManagementPrinciples Of Logistics Management
Principles Of Logistics ManagementYvonne
 
Production Planning and Control
Production Planning and ControlProduction Planning and Control
Production Planning and ControlSwatanu Satpathy
 
TIME MANAGEMENT POWERPOINT
TIME MANAGEMENT POWERPOINTTIME MANAGEMENT POWERPOINT
TIME MANAGEMENT POWERPOINTAndrew Schwartz
 

Destacado (6)

Lesson 10 over employment, unemployment, underemployment and overtime
Lesson 10 over employment, unemployment, underemployment and overtimeLesson 10 over employment, unemployment, underemployment and overtime
Lesson 10 over employment, unemployment, underemployment and overtime
 
International Logistics & Warehouse Management
International Logistics & Warehouse Management International Logistics & Warehouse Management
International Logistics & Warehouse Management
 
Continuous process improvement (4)
Continuous process improvement (4)Continuous process improvement (4)
Continuous process improvement (4)
 
Principles Of Logistics Management
Principles Of Logistics ManagementPrinciples Of Logistics Management
Principles Of Logistics Management
 
Production Planning and Control
Production Planning and ControlProduction Planning and Control
Production Planning and Control
 
TIME MANAGEMENT POWERPOINT
TIME MANAGEMENT POWERPOINTTIME MANAGEMENT POWERPOINT
TIME MANAGEMENT POWERPOINT
 

Similar a End to-end root cause analysis minimize the time to incident resolution

Different Approaches To Sys Bldg
Different Approaches To Sys BldgDifferent Approaches To Sys Bldg
Different Approaches To Sys BldgUSeP
 
Pmo slides jun2010
Pmo slides jun2010Pmo slides jun2010
Pmo slides jun2010Steve Turner
 
Hovitaga OpenSQL Editor - Overview
Hovitaga OpenSQL Editor - OverviewHovitaga OpenSQL Editor - Overview
Hovitaga OpenSQL Editor - OverviewHovitaga Kft.
 
Dot Net performance monitoring
 Dot Net performance monitoring Dot Net performance monitoring
Dot Net performance monitoringKranthi Paidi
 
Performance testing basics
Performance testing basicsPerformance testing basics
Performance testing basicsCharu Anand
 
Issue Management System
Issue Management SystemIssue Management System
Issue Management SystemPratik Vipul
 
Exploiting Web Technologies to connect business process management and engine...
Exploiting Web Technologies to connect business process management and engine...Exploiting Web Technologies to connect business process management and engine...
Exploiting Web Technologies to connect business process management and engine...Stefano Costanzo
 
Data modelling tool in CASE
Data modelling tool in CASEData modelling tool in CASE
Data modelling tool in CASEManju Pillai
 
Simplify Data Center Monitoring With a Single-Pane View
Simplify Data Center Monitoring With a Single-Pane ViewSimplify Data Center Monitoring With a Single-Pane View
Simplify Data Center Monitoring With a Single-Pane ViewHitachi Vantara
 
Sanjeevi's SDLC Guest Lecture in Anna University campus at AU-PERS Centre (Ye...
Sanjeevi's SDLC Guest Lecture in Anna University campus at AU-PERS Centre (Ye...Sanjeevi's SDLC Guest Lecture in Anna University campus at AU-PERS Centre (Ye...
Sanjeevi's SDLC Guest Lecture in Anna University campus at AU-PERS Centre (Ye...Sanjeevi Prasad
 
Iterative Waterfall model
Iterative Waterfall modelIterative Waterfall model
Iterative Waterfall modelAnmol Purohit
 
Library Management System using oracle database
Library Management System using oracle databaseLibrary Management System using oracle database
Library Management System using oracle databaseSaikot Roy
 
3Audit Software & Tools.pptx
3Audit Software & Tools.pptx3Audit Software & Tools.pptx
3Audit Software & Tools.pptxjack952975
 
Association Rule Mining Scheme for Software Failure Analysis
Association Rule Mining Scheme for Software Failure AnalysisAssociation Rule Mining Scheme for Software Failure Analysis
Association Rule Mining Scheme for Software Failure AnalysisEditor IJMTER
 
Software Risk Analysis
Software Risk AnalysisSoftware Risk Analysis
Software Risk AnalysisBrett Leonard
 

Similar a End to-end root cause analysis minimize the time to incident resolution (20)

Computers in management
Computers in managementComputers in management
Computers in management
 
Different Approaches To Sys Bldg
Different Approaches To Sys BldgDifferent Approaches To Sys Bldg
Different Approaches To Sys Bldg
 
Pmo slides jun2010
Pmo slides jun2010Pmo slides jun2010
Pmo slides jun2010
 
Hovitaga OpenSQL Editor - Overview
Hovitaga OpenSQL Editor - OverviewHovitaga OpenSQL Editor - Overview
Hovitaga OpenSQL Editor - Overview
 
Feasible
FeasibleFeasible
Feasible
 
Performance testing wreaking balls
Performance testing wreaking ballsPerformance testing wreaking balls
Performance testing wreaking balls
 
Dot Net performance monitoring
 Dot Net performance monitoring Dot Net performance monitoring
Dot Net performance monitoring
 
Performance testing basics
Performance testing basicsPerformance testing basics
Performance testing basics
 
Introduction
IntroductionIntroduction
Introduction
 
Issue Management System
Issue Management SystemIssue Management System
Issue Management System
 
Exploiting Web Technologies to connect business process management and engine...
Exploiting Web Technologies to connect business process management and engine...Exploiting Web Technologies to connect business process management and engine...
Exploiting Web Technologies to connect business process management and engine...
 
Data modelling tool in CASE
Data modelling tool in CASEData modelling tool in CASE
Data modelling tool in CASE
 
Simplify Data Center Monitoring With a Single-Pane View
Simplify Data Center Monitoring With a Single-Pane ViewSimplify Data Center Monitoring With a Single-Pane View
Simplify Data Center Monitoring With a Single-Pane View
 
Sanjeevi's SDLC Guest Lecture in Anna University campus at AU-PERS Centre (Ye...
Sanjeevi's SDLC Guest Lecture in Anna University campus at AU-PERS Centre (Ye...Sanjeevi's SDLC Guest Lecture in Anna University campus at AU-PERS Centre (Ye...
Sanjeevi's SDLC Guest Lecture in Anna University campus at AU-PERS Centre (Ye...
 
Iterative Waterfall model
Iterative Waterfall modelIterative Waterfall model
Iterative Waterfall model
 
Library Management System using oracle database
Library Management System using oracle databaseLibrary Management System using oracle database
Library Management System using oracle database
 
Sd Revision
Sd RevisionSd Revision
Sd Revision
 
3Audit Software & Tools.pptx
3Audit Software & Tools.pptx3Audit Software & Tools.pptx
3Audit Software & Tools.pptx
 
Association Rule Mining Scheme for Software Failure Analysis
Association Rule Mining Scheme for Software Failure AnalysisAssociation Rule Mining Scheme for Software Failure Analysis
Association Rule Mining Scheme for Software Failure Analysis
 
Software Risk Analysis
Software Risk AnalysisSoftware Risk Analysis
Software Risk Analysis
 

Último

Infrared simulation and processing on Nvidia platforms
Infrared simulation and processing on Nvidia platformsInfrared simulation and processing on Nvidia platforms
Infrared simulation and processing on Nvidia platformsYoss Cohen
 
How to Effectively Monitor SD-WAN and SASE Environments with ThousandEyes
How to Effectively Monitor SD-WAN and SASE Environments with ThousandEyesHow to Effectively Monitor SD-WAN and SASE Environments with ThousandEyes
How to Effectively Monitor SD-WAN and SASE Environments with ThousandEyesThousandEyes
 
Unleashing Real-time Insights with ClickHouse_ Navigating the Landscape in 20...
Unleashing Real-time Insights with ClickHouse_ Navigating the Landscape in 20...Unleashing Real-time Insights with ClickHouse_ Navigating the Landscape in 20...
Unleashing Real-time Insights with ClickHouse_ Navigating the Landscape in 20...Alkin Tezuysal
 
Tampa BSides - The No BS SOC (slides from April 6, 2024 talk)
Tampa BSides - The No BS SOC (slides from April 6, 2024 talk)Tampa BSides - The No BS SOC (slides from April 6, 2024 talk)
Tampa BSides - The No BS SOC (slides from April 6, 2024 talk)Mark Simos
 
[Webinar] SpiraTest - Setting New Standards in Quality Assurance
[Webinar] SpiraTest - Setting New Standards in Quality Assurance[Webinar] SpiraTest - Setting New Standards in Quality Assurance
[Webinar] SpiraTest - Setting New Standards in Quality AssuranceInflectra
 
Long journey of Ruby standard library at RubyConf AU 2024
Long journey of Ruby standard library at RubyConf AU 2024Long journey of Ruby standard library at RubyConf AU 2024
Long journey of Ruby standard library at RubyConf AU 2024Hiroshi SHIBATA
 
Bridging Between CAD & GIS: 6 Ways to Automate Your Data Integration
Bridging Between CAD & GIS:  6 Ways to Automate Your Data IntegrationBridging Between CAD & GIS:  6 Ways to Automate Your Data Integration
Bridging Between CAD & GIS: 6 Ways to Automate Your Data Integrationmarketing932765
 
Microsoft 365 Copilot: How to boost your productivity with AI – Part one: Ado...
Microsoft 365 Copilot: How to boost your productivity with AI – Part one: Ado...Microsoft 365 Copilot: How to boost your productivity with AI – Part one: Ado...
Microsoft 365 Copilot: How to boost your productivity with AI – Part one: Ado...Nikki Chapple
 
A Journey Into the Emotions of Software Developers
A Journey Into the Emotions of Software DevelopersA Journey Into the Emotions of Software Developers
A Journey Into the Emotions of Software DevelopersNicole Novielli
 
Data governance with Unity Catalog Presentation
Data governance with Unity Catalog PresentationData governance with Unity Catalog Presentation
Data governance with Unity Catalog PresentationKnoldus Inc.
 
All These Sophisticated Attacks, Can We Really Detect Them - PDF
All These Sophisticated Attacks, Can We Really Detect Them - PDFAll These Sophisticated Attacks, Can We Really Detect Them - PDF
All These Sophisticated Attacks, Can We Really Detect Them - PDFMichael Gough
 
Connecting the Dots for Information Discovery.pdf
Connecting the Dots for Information Discovery.pdfConnecting the Dots for Information Discovery.pdf
Connecting the Dots for Information Discovery.pdfNeo4j
 
Modern Roaming for Notes and Nomad – Cheaper Faster Better Stronger
Modern Roaming for Notes and Nomad – Cheaper Faster Better StrongerModern Roaming for Notes and Nomad – Cheaper Faster Better Stronger
Modern Roaming for Notes and Nomad – Cheaper Faster Better Strongerpanagenda
 
Potential of AI (Generative AI) in Business: Learnings and Insights
Potential of AI (Generative AI) in Business: Learnings and InsightsPotential of AI (Generative AI) in Business: Learnings and Insights
Potential of AI (Generative AI) in Business: Learnings and InsightsRavi Sanghani
 
Top 10 Hubspot Development Companies in 2024
Top 10 Hubspot Development Companies in 2024Top 10 Hubspot Development Companies in 2024
Top 10 Hubspot Development Companies in 2024TopCSSGallery
 
React Native vs Ionic - The Best Mobile App Framework
React Native vs Ionic - The Best Mobile App FrameworkReact Native vs Ionic - The Best Mobile App Framework
React Native vs Ionic - The Best Mobile App FrameworkPixlogix Infotech
 
The Future Roadmap for the Composable Data Stack - Wes McKinney - Data Counci...
The Future Roadmap for the Composable Data Stack - Wes McKinney - Data Counci...The Future Roadmap for the Composable Data Stack - Wes McKinney - Data Counci...
The Future Roadmap for the Composable Data Stack - Wes McKinney - Data Counci...Wes McKinney
 
Microservices, Docker deploy and Microservices source code in C#
Microservices, Docker deploy and Microservices source code in C#Microservices, Docker deploy and Microservices source code in C#
Microservices, Docker deploy and Microservices source code in C#Karmanjay Verma
 
Design pattern talk by Kaya Weers - 2024 (v2)
Design pattern talk by Kaya Weers - 2024 (v2)Design pattern talk by Kaya Weers - 2024 (v2)
Design pattern talk by Kaya Weers - 2024 (v2)Kaya Weers
 
Digital Identity is Under Attack: FIDO Paris Seminar.pptx
Digital Identity is Under Attack: FIDO Paris Seminar.pptxDigital Identity is Under Attack: FIDO Paris Seminar.pptx
Digital Identity is Under Attack: FIDO Paris Seminar.pptxLoriGlavin3
 

Último (20)

Infrared simulation and processing on Nvidia platforms
Infrared simulation and processing on Nvidia platformsInfrared simulation and processing on Nvidia platforms
Infrared simulation and processing on Nvidia platforms
 
How to Effectively Monitor SD-WAN and SASE Environments with ThousandEyes
How to Effectively Monitor SD-WAN and SASE Environments with ThousandEyesHow to Effectively Monitor SD-WAN and SASE Environments with ThousandEyes
How to Effectively Monitor SD-WAN and SASE Environments with ThousandEyes
 
Unleashing Real-time Insights with ClickHouse_ Navigating the Landscape in 20...
Unleashing Real-time Insights with ClickHouse_ Navigating the Landscape in 20...Unleashing Real-time Insights with ClickHouse_ Navigating the Landscape in 20...
Unleashing Real-time Insights with ClickHouse_ Navigating the Landscape in 20...
 
Tampa BSides - The No BS SOC (slides from April 6, 2024 talk)
Tampa BSides - The No BS SOC (slides from April 6, 2024 talk)Tampa BSides - The No BS SOC (slides from April 6, 2024 talk)
Tampa BSides - The No BS SOC (slides from April 6, 2024 talk)
 
[Webinar] SpiraTest - Setting New Standards in Quality Assurance
[Webinar] SpiraTest - Setting New Standards in Quality Assurance[Webinar] SpiraTest - Setting New Standards in Quality Assurance
[Webinar] SpiraTest - Setting New Standards in Quality Assurance
 
Long journey of Ruby standard library at RubyConf AU 2024
Long journey of Ruby standard library at RubyConf AU 2024Long journey of Ruby standard library at RubyConf AU 2024
Long journey of Ruby standard library at RubyConf AU 2024
 
Bridging Between CAD & GIS: 6 Ways to Automate Your Data Integration
Bridging Between CAD & GIS:  6 Ways to Automate Your Data IntegrationBridging Between CAD & GIS:  6 Ways to Automate Your Data Integration
Bridging Between CAD & GIS: 6 Ways to Automate Your Data Integration
 
Microsoft 365 Copilot: How to boost your productivity with AI – Part one: Ado...
Microsoft 365 Copilot: How to boost your productivity with AI – Part one: Ado...Microsoft 365 Copilot: How to boost your productivity with AI – Part one: Ado...
Microsoft 365 Copilot: How to boost your productivity with AI – Part one: Ado...
 
A Journey Into the Emotions of Software Developers
A Journey Into the Emotions of Software DevelopersA Journey Into the Emotions of Software Developers
A Journey Into the Emotions of Software Developers
 
Data governance with Unity Catalog Presentation
Data governance with Unity Catalog PresentationData governance with Unity Catalog Presentation
Data governance with Unity Catalog Presentation
 
All These Sophisticated Attacks, Can We Really Detect Them - PDF
All These Sophisticated Attacks, Can We Really Detect Them - PDFAll These Sophisticated Attacks, Can We Really Detect Them - PDF
All These Sophisticated Attacks, Can We Really Detect Them - PDF
 
Connecting the Dots for Information Discovery.pdf
Connecting the Dots for Information Discovery.pdfConnecting the Dots for Information Discovery.pdf
Connecting the Dots for Information Discovery.pdf
 
Modern Roaming for Notes and Nomad – Cheaper Faster Better Stronger
Modern Roaming for Notes and Nomad – Cheaper Faster Better StrongerModern Roaming for Notes and Nomad – Cheaper Faster Better Stronger
Modern Roaming for Notes and Nomad – Cheaper Faster Better Stronger
 
Potential of AI (Generative AI) in Business: Learnings and Insights
Potential of AI (Generative AI) in Business: Learnings and InsightsPotential of AI (Generative AI) in Business: Learnings and Insights
Potential of AI (Generative AI) in Business: Learnings and Insights
 
Top 10 Hubspot Development Companies in 2024
Top 10 Hubspot Development Companies in 2024Top 10 Hubspot Development Companies in 2024
Top 10 Hubspot Development Companies in 2024
 
React Native vs Ionic - The Best Mobile App Framework
React Native vs Ionic - The Best Mobile App FrameworkReact Native vs Ionic - The Best Mobile App Framework
React Native vs Ionic - The Best Mobile App Framework
 
The Future Roadmap for the Composable Data Stack - Wes McKinney - Data Counci...
The Future Roadmap for the Composable Data Stack - Wes McKinney - Data Counci...The Future Roadmap for the Composable Data Stack - Wes McKinney - Data Counci...
The Future Roadmap for the Composable Data Stack - Wes McKinney - Data Counci...
 
Microservices, Docker deploy and Microservices source code in C#
Microservices, Docker deploy and Microservices source code in C#Microservices, Docker deploy and Microservices source code in C#
Microservices, Docker deploy and Microservices source code in C#
 
Design pattern talk by Kaya Weers - 2024 (v2)
Design pattern talk by Kaya Weers - 2024 (v2)Design pattern talk by Kaya Weers - 2024 (v2)
Design pattern talk by Kaya Weers - 2024 (v2)
 
Digital Identity is Under Attack: FIDO Paris Seminar.pptx
Digital Identity is Under Attack: FIDO Paris Seminar.pptxDigital Identity is Under Attack: FIDO Paris Seminar.pptx
Digital Identity is Under Attack: FIDO Paris Seminar.pptx
 

End to-end root cause analysis minimize the time to incident resolution

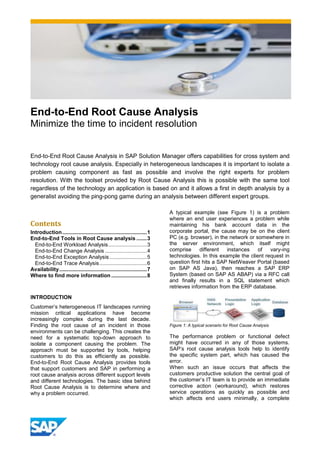
  • 1. End-to-End Root Cause Analysis Minimize the time to incident resolution End-to-End Root Cause Analysis in SAP Solution Manager offers capabilities for cross system and technology root cause analysis. Especially in heterogeneous landscapes it is important to isolate a problem causing component as fast as possible and involve the right experts for problem resolution. With the toolset provided by Root Cause Analysis this is possible with the same tool regardless of the technology an application is based on and it allows a first in depth analysis by a generalist avoiding the ping-pong game during an analysis between different expert groups. Contents Introduction.........................................................1 End-to-End Tools in Root Cause analysis .......3 End-to-End Workload Analysis..........................3 End-to-End Change Analysis ............................4 End-to-End Exception Analysis .........................5 End-to-End Trace Analysis................................6 Availability...........................................................7 Where to find more information ........................8 INTRODUCTION Customer’s heterogeneous IT landscapes running mission critical applications have become increasingly complex during the last decade. Finding the root cause of an incident in those environments can be challenging. This creates the need for a systematic top-down approach to isolate a component causing the problem. The approach must be supported by tools, helping customers to do this as efficiently as possible. End-to-End Root Cause Analysis provides tools that support customers and SAP in performing a root cause analysis across different support levels and different technologies. The basic idea behind Root Cause Analysis is to determine where and why a problem occurred. A typical example (see Figure 1) is a problem where an end user experiences a problem while maintaining his bank account data in the corporate portal, the cause may be on the client PC (e.g. browser), in the network or somewhere in the server environment, which itself might comprise different instances of vary-ing technologies. In this example the client request in question first hits a SAP NetWeaver Portal (based on SAP AS Java), then reaches a SAP ERP System (based on SAP AS ABAP) via a RFC call and finally results in a SQL statement which retrieves information from the ERP database. Figure 1: A typical scenario for Root Cause Analysis The performance problem or functional defect might have occurred in any of those systems. SAP’s root cause analysis tools help to identify the specific system part, which has caused the error. When such an issue occurs that affects the customers productive solution the central goal of the customer’s IT team is to provide an immediate corrective action (workaround), which restores service operations as quickly as possible and which affects end users minimally, a complete
  • 2. Copyright/Trademark solution to the issue at hand by isolating the area of concern. Additionally, with respect to operation, SAP’s root cause analysis tools are designed to reduce the number of resources in each step of the resolution process. An IT generalist with core competence in root cause analysis, who involves a Component Expert, are mostly enough to investigate an issue and nail it down. Therefore Root Cause Analysis offers tools for each task in cross-component (end-to-end analysis) and component-specific analysis. Per definition, a cross-component analysis involves several systems or technology stacks, whereas component-specific analysis deals with one sys- tem or technology stack. Overall, Root Cause Analysis works towards simplifying the problem resolution process with-in an IT environment and reducing the total cost of ownership. Benefits SAP’s tools for Root Cause Analysis are:  Ensured continuous business availability – Root Cause Analysis helps to accelerate the problem resolution process.  Reduced costs for support experts - The targeted top-down approach of RCA supports a one step dispatching of issues from an IT Generalist to a Component Expert.  Reduced license costs - Supporting RCA Tools offered by SAP are part of the standard maintenance contract and come at no additional fee.  One safe access channel to all systems – Root Cause Analysis provides one safe and central access channel to the customer’s landscape. If required, an investigation is continued on the system in concern using a predefined support user (SAPSUPPORT), who is only assigned read-only rights.  Collected data is displayed in unified views, thereby abstracting data from the underlying technology stack. This approach supports the structured top down analysis approach, as generalists and experts start investigating at one common point.  Empowers the customer to solve problems himself - Nobody knows the customer’s landscape as well as the customer himself. E2E Root Cause Analysis provides expert tools which enable a customer to quickly solve problems, thereby reducing overall resolution time. All tools and applications are available in the Root Cause Analysis Workcenter (see Figure 2) in SAP Solution Manager. Figure 2: Root Cause Analysis Workcenter The tools are grouped in different categories along the usage in the analysis process, but all tools share a common navigation paradigm. Before you start one of the available tools, a detailed selection allows you to define queries which group systems. So each user can define queries containing the systems, hosts or databases depending on his work focus (e.g. one query for all production systems, one query containing all CRM systems and so on). Based on these queries, you select one or multiple entries that you want to analyze and then start one tool in this context.  End-to-End Workload Analysis: If a customer faces a performance problem, E2E Workload Analysis might be the tool to start with. Solution Manager regularly collects performance information of each system and makes this data centrally available in the Solution Manager Work Center RCA. The Workload Analysis allows to identify general performance bottlenecks such as sizing problems, or problems which affect all users who are using a particular system.  End-to-End Trace Analysis: End-to-End Trace is a tool for isolating a single user interaction through a complete landscape and providing trace information on each of the involved components for one interaction only, starting with the user interaction in the browser and ending with data being committed to the database. Identifying long running user requests within a complex system landscape is the most common use case of E2E Trace Analysis, but you can also identify which functional errors have occurred during the execution of one request. These exceptions (like a dump) are then attached to the trace. So the trace can also be used to do functional testing and ensuring that an activity executed in one system does not lead to functional errors in connected systems during the request execution.  End-to-End Change Analysis If a system behaves differently after a certain date or change, E2E Change Analysis is the first tool
  • 3. Copyright/Trademark to use. It displays changes (e.g. transports and support package updates, profile parameter changes,…) that have been applied to a system within a certain timeframe. The Change Analysis application is based on a central Configuration & Change Database (CCDB). The CCDB provides the foundation for change analysis and change reporting based on daily configuration of system, host and database related configuration data. A Change Analysis can then be performed on all information stored in the CCDB. Furthermore it is possible to compare different systems and generate a report which contains the results. This approach identifies the problem by comparison rather than by drilling down, which is faster and easier in most cases.  End-to-End Exception Analysis E2E Exception Analysis provides unified access to exceptions reflecting in high severity log entries and dumps. Exception Analysis provides the basis for statistical analysis on exception in the landscape, but also allow to access component specific log and dump viewers directly with a jump-in to the appropriate tool on the managed system.  System Analysis: In case of Java based system the Wily transaction trace can be used to identify which part of a request in a Java environment caused the problem. Wily Introscope is shipped by SAP with preconfigured dash boards, offering dedicated views for the SAP Application Server Java. A deep analysis of Java problems is possible in the investigator mode, which displays detailed performance metrics. Several other system analysis tools as Thread Dump Analysis, Change Reporting and Central LogViewer are provided.  Host Analysis: With the Host Analysis section of the RCA Work Center it is possible to analyze the most important OS metrics like CPU, memory, paging, network and disk/file system. In addition the filesystem browser allows a central read-only access to predefined directories on the managed system without having to logon to the console of the managed system. In the same manner it is also possible with the OS Command Console, to execute predefined, non destructible commands (like a ping, netstat, iostat and so on). Both tools work ensure that even whilst access to the managed system is granted, no change can be made, no business data can be accessed and not harmful commands can be executed.  Database Analysis: The DB Analysis summarizes DB Performance Warehouse specific metrics across all supported DB types. This also includes standalone DB’s that are connected to the DBA Cockpit within Solution Manager  Client side Analysis: If the outcome of an analysis is that the problem is located on the client side, SAP offers the tool BMC AppSight to analyze the problem further. At least one resource should exist in the customers IT department who received a special training for this tool. BMC AppSight is free of charge if only used in combination with SAP systems and with recording profiles offered by SAP. END-TO-END TOOLS IN ROOT CAUSE ANALYSIS All the End-To-End tools available in SAP Solution Manager are built on the same infrastructure and follow a common navigation approach. First, the infrastructure: Data is collected from the managed system using multiple channels. For ABAP based systems a direct communication channel from the SAP Solution Manager system towards the managed system exist with the RFC connections. For all other system types data is collected via CA Wily Introscope. Introscope is an essential part and available free of charge in the so called Right To View (RTV) license. This allows customers to use the SAP delivered instrumentation and dashboards without having to buy a separate license. In addition, the Diagnostics Agent is used to collect additional data, like files from the file system, for all system types. Second, the navigation: All the tools share a common principle. You start with an overview which shows you the most important information in a condensed format. Which data finally gets displayed is defined by a timeframe selection. More detailed information is always available with a drill down. Most of the data presented in the tools is stored in the BW system which is integrated in SAP Solution Manager. The whole data extraction, aggregation and deletion process is managed by the so called Extractor Framework (EFWK) and no manual interaction is needed. The EFWK also has an integrated resource control to ensure that neither the Solution Manager nor the managed system are overloaded with the data extraction. Also the housekeeping is managed by the EFWK, so that the data growth keeps at a passable level. Now to the tools in detail… End-to-End Workload Analysis The End-to-End Workload Analysis helps you to get workload information of your complete system landscape in order to analyze overall performance bottlenecks in your solution. There are different monitors and analysis tools that provide you with key performance indicators for the different
  • 4. Copyright/Trademark components. Most commonly, an initial check of overall workload is done to check the overall workload. Therefore the workload overview screen summarizes the most important performance KPI’s independent of the technology the system is based on (see Figure 3) Figure 3: Workload Analysis Overview In addition to the overview, there are different view types available which display the data in different ways. For example the Scatter view (see Figure 4) displays the data with the Average Response Time on the x-axis and the Accumulated Response Time on the y-axis. Similar to the Time Profile, data points will be displayed as hourly average values for the chosen timeframe. In interpreting the diagram, one can structure the displayed area roughly in for quadrants, distinguishing between low and high Average Response Times on the x-axis and low and high Accumulated Response Times. Then, the top right quadrant with both high Average Response Time and high Accumulated Response Time can be regarded as a Critical Quadrant. Values in here have the strongest impact on the system they were measured on. Figure 4: Scatter Chart From here you can do the drill down to product specific KPI’s. In the following diagram, you see an example of the structuring for an ABAP based system: Figure 5: ABAP Workload Summary By utilizing this drilldown you can find what is causing the general performance bottleneck and start foolow up activities. It is also possible with standard BW functionality to further drill down in the detailed metric views by right clicking on a column and choosing from the list of available drill-down options (like in Figure 6). Figure 6: Drill-down options End-to-End Change Analysis Changes are a common starting point for problems in your landscape. Imagine that something worked yesterday, but it is not working anymore today. The first question would be what changed in between? E2E Change Analysis is the tool to analyze problems like this. Again, the tool starts with an overview on the overall changes which have been applied to the landscape (see Figure 7). You can use the timeframe mechanism, to limit the timeframe to the point when the problem occurred first. Figure 7: Change Analysis Overview From here, the Change Analysis application allows you again to drill down to the type of changes and from there to the actual changes itself. The available changes are categorized (again depending on the system type) and then displayed like in Figure 8 (example for an ABAP
  • 5. Copyright/Trademark system). Here you can easily identify that on a certain date a lot of notes have been implemented in a system, or that on another day parameter changes have been applied to the system. Figure 8: Change Analysis Categories With a further drill down it’s then possible to identify the changes in detail and also get a history on the single change in the change reporting application. Figure 9: Change Reporting with history In addition to the time based analysis, it is possible to compare the configuration of two systems against another one. By this it is possible for example if you have a problem in your production system which cannot be reproduced in the quality assurance system, what the configuration differences between the two systems are. End-to-End Exception Analysis The E2E Exception Analysis follows the same approach than the other two previously described tools but displays all kinds of exception in managed systems. This starts with dumps in an ABAP system but also includes for example Out of memory situations in a J2EE engine. As the information about the exceptions is persisted on the Solution Manager, it is prevented that the exceptions are overwritten by a round robin log mechanism or cleanup procedures in the managed system. Of course not all information is persisted on the Solution Manager system (only relevant header data which is needed for error statistics as type of the exception, description, severity, time and date,user that caused the exception,…) Based on the available statistical information on exceptions, the main use cases is that you want to perform an exception trend analysis to find out if after implementing a special path or update more or less exceptions are occurring. Another use case is to ensure that with a specific patch or a SAP note a problem is fixed and the exception does not occur anymore. Figure 10: Overview of exceptions In the overview (see Figure 10) you can identify in the time profile on which time of the day which exceptions occur, or use the history diagram to see the distribution of exceptions over the selected timeframe (see Figure 11). Figure 11: History of exceptions The drill down allows you to identify the exact exception which is only summarized in this diagram. Depending on the exception type more data is stored in BW to allow an efficient first analysis, but the complete exception data is always available in the managed system itself and can be reached with a jump-in from the Solution Manager system. In the following example you can see that 90 dumps have been triggered in the selected timeframe by a syntax error in a test program. Using the green jump-on, you could now navigate to the managed system and analyze the dump in transaction ST22.
  • 6. Copyright/Trademark Figure 12: List of dumps Similar possibilities exist for all kind of supported exception, like system and application errors in a J2EE engine with a jump-in to the NetWeaver Admininistrator. End-to-End Trace Analysis The main purpose of E2E Trace Analysis is investigating problems related to a single user activity caused by one or more user clicks in the front end. Single user click in a Web UI or Portal front end can trigger one or more requests to the web server. While the web application running on the web server processes a request, it can trigger several requests to other components (systems) in the solution landscape. These components on their side can trigger additional requests to their components and so on. The analysis of performance and functional problems in such a complex landscape is time consuming and requires expert knowledge. The end-to-end cross component tracing aims to decrease the time for gathering the relevant trace data related to a single user activity and simplifies the analysis by guiding the user through the analysis steps and identifying the component which consumes the biggest amount of the total execution time. In addition it is possible to find exceptions which were triggered by the request in one of the connected component. This all is achieved with the help of the SAP Passport. The passport is a simple extension of the communication protocols used in SAP landscape (such as HTTP or RFC) and consists of two parts. The first one is a GUID which identifies the requests uniquely, the second one are trace flags which indicate which trace should be turned on in one of the involved components. The passport is injected on client side into the communication and then later on passed over from system to system. Each system that receives a request which contains a passport turns its trace on dynamically for the processing of this request (based on the trace flags). When the trace is written to the disk or the database the GUID of the passport is included to be able to identify the request later on. The passport is also injected into follow up requests when another call to an external system is made, which then turns on the trace dynamically, write it to the disk and so on and so on. This means actually, that all traces throughout a landscape can be collected for a single click of an end-user because they are identified by the GUID which was generated at client side. Based on the trace information which is collected it is very easy to identify which component took which time to process the request (e.g. processing in java in an Enterprise Portal, processing in a connected ABAP system, processing on the DB, in the network, on the client side,…) and isolate problem causing components. But back to the start, the E2E trace is triggered with the HTTP client plugin for web based scenarios or directly from the SAPGUI with the transaction /SDF/E2E_TRACE (starting with SAP Basis 7.20 SP6 it is also possible to start tracing during the execution of a dialog transaction using the function code/ $gui_e2e_trace as in Figure 13). Then the end user performs the activities which are causing the problem and the whole tracing process is started in the connected backend systems. Figure 13: SAPgui trace enabling After the trace has been created, SAP Solution Manager collects all the trace data from all systems and displays the results broken down per step in an overview screen (see Figure 14). The trace overview allows to identify on which part of the request execution, the most time has been spent (e.g. client, network, server,…). Figure 14: Trace Overview
  • 7. Copyright/Trademark In the given example it can be easily seen, that most of the time is spent on server side, so the next natural step is to look deeper in the server execution and which server instances have been involved. As you can see in Figure 15 the execution of a single request can spawn multiple systems. Nevertheless it is also obvious that in the scenario the most time is spent on the ABAP system PR2 (namely nearly 30 seconds). Figure 15: Server summary Following the drill down we can see that out of this 30 seconds, 26 are spent on the database, which hints to a problem with a bad performing DB or a not tuned SQL statement or the sheer amount of data which is transferred Figure 16: Trace time distribution Now it is possible to analyze on a request level which traces have been triggered by the request and by this identify the function module or the SQL statement which causes this problem. E2E Trace is a very powerful tool which is integrated in all SAP infrastructures and also reused in monitoring & alerting by the End User Experience Monitoring. This deep insight into a SAP system gets more and more useful in today’s highly integrated and heterogeneous landscapes. AVAILABILITY End-to-End Root Cause Analysis is available since SAP Solution Manager 7.0 SP 12 up to the latest release SAP Solution Manager 7.1. The main differences between the releases are.  Release prior to SAP Solution Manager 7.0 EhP1 (SPS18)  Own application in SAP Solution Manager Java WebDynpro  Based on solutions to perform analysis  Focused on ABAP & Java analysis  SAP Solution Manager 7.0 EhP1 (SPS18) and later  Integrated in SAP Solution Manager Workcenters  Based on technical systems (no solution required anymore)  Flexible query based approach (each user can define his own queries for grouping systems)  Focuses on all technologies used by SAP & Partners  SAP Solution Manager 7.1  Focused on SAP & non-SAP  Integration of further system & technology types  Personalization options for each user  New applications for Host and Database analysis added In addition to these major feature deliveries, in each SP new supported products are added. This starts with the delivery of new instrumentation and dashboards for CA Wily Introscope but also includes functional enhancements in the E2E applications to support further SAP & non-SAP products. For a detailed description of the added products please refer to the later mentioned SAP Notes.
  • 8. Copyright/Trademark WHERE TO FIND MORE INFORMATION If you want to know more, please consider the following resources: Root Cause Analysis Home in SDN: http://wiki.sdn.sap.com/wiki/display/TechOps/RCA_Home Technical Operations in SDN http://wiki.sdn.sap.com/wiki/display/TechOps Application Lifecycle Management in general http://service.sap.com/alm Relevant SAP Notes: 1010428 – Supported Products with SAP Solution Manager 7.0 (and EhP1) 1293438 – Supported Partner Products 1478974 – Supported Products with SAP Solution Manager 7.1