SlideShare a Scribd company logo
1 of 13
Download to read offline
1
Rising Foreign Capital Trend into U.S. Commercial Real Estate
Interest Rates - With low and even negative interest rates around
the world, foreign investors are looking cross boarder in the search
for yield. Germany, France, Netherlands, Switzerland, and
Japan all report 10-year government bond yields below 1.0%.2
With average pre-tax yield rates of 6.7% to 9.3%,3
depending on property type, core U.S. real estate offers an
attractive risk premium for foreign investors willing to brave
currency risk.
Global Economy - Sluggish growth in Europe and uncertainty in
China are drawing investors to the U.S. in the search for stability.
With annualized Real GDP of 1.6% and virtually no inflation in the
Eurozone, the European Central Bank (ECB) is aggressively trying
to stimulate the economy with easy monetary policy.4
In the March
policy meeting, the ECB lowered the deposit rate 10 basis points to
-0.4% and expanded asset purchase programs. The negative
interest rate policies emerging in both Europe and Asia are
creating a new source of uncertainty themselves as central banks
begin to move into uncharted waters. In China, we have seen
currency devaluation in an effort to boost exports amid slowing
growth. With continued strength in domestic labor markets, the
U.S. should continue to draw capital from Europe and Asia as they
work through economic headwinds.
Despite reduced buying power resulting from the strengthening United States dollar (USD), foreign capital flows into U.S. commercial real
estate more than doubled in 2015 to unprecedented levels. While growth was broad based, foreign investment was particularly strong
from Asia where inflows increased roughly $19.6 billion or 159%.1
The increased foreign demand has had a positive impact on price ap-
preciation and can be attributed to a number of drivers including the low global interest rate environment, global economic uncertainties,
and regulatory changes. In light of these demand drivers, we expect foreign capital flows into U.S. commercial real estate to continue to
trend above historical norms over the near-term but if flows decrease significantly or reverse course, expect downward pressure on asset
valuations.
FIRPTA & EB-5 - A number of provisions were recently changed in
the Foreign Investment in Real Property Tax Act (FIRPTA) that
provide increased opportunities for non-U.S. investors. The changes
effectively increase the amount of capital foreign investors can
invest in public U.S. REIT stocks before becoming subject to FIRPTA
taxes.5
Extension of the EB-5 program is another law that will
continue to generate foreign capital flows into new U.S. real estate
developments. EB-5 is a program were foreign nationals can invest
money in the U.S. and receive a green card. An Individual must
invest at least $1,000,000 (or $500,000 in Targeted Employment
Areas) and create or preserve 10 jobs. With regional centers pooling
foreign investors, EB-5 is becoming an increasingly popular source
of equity capital in new real estate development.
Real Capital Analytics, US Capital Trend, 2015 Year Review
Yahoo! Finance, CCT, 2015
U.S. Commercial Real Estate Market Overview
First Quarter 2016
Applied Research
Refer to endnotes for sources
www.aegonrealty.com We use our investment management expertise to help people achieve a lifetime of financial security
Overall, conditions are favorable for continued capital flows into U.S. commercial real estate in the near-term but the abundance of
capital from both foreign and domestic sources are cause for concern for the long-term durability of current asset values.
$0
$10
$20
$30
$40
$50
$60
$70
$80
$90
$100
'05 '06 '07 '08 '09 '10 '11 '12 '13 '14 '15
Billions
Foreign Capital
Latin America Australia Asia Middle East Europe Canada
0.7
0.8
0.9
1
1.1
1.2
1.3
1.4
1.5
RateofExchange
Currency Exchange Rate Indices
CNY/USD CAD/USD EUR/USD
'05 '06 '07 '08 '09 '10 '11 '12 '13 '14 '15
2
Annual Data, CoStar Portfolio Strategy, 2015 Q4
CoStar Portfolio Strategy, 2015 Q4
*Leaders have a favorable vacancy trend and rent growth of 3% or higher.
**Laggards have an unfavorable vacancy trend and rent growth of 0% or lower.
Top And Bottom Trending Markets (Year Over Year)
Vacancy Rent ($/Unit)
Leaders* 14Q4 15Q4 CHANGE 14Q4 15Q4 CHANGE
Tampa 4.8% 3.6% -1.2% $952 $1026 7.8%
Las Vegas 5.9% 4.8% -1.1% $786 $ 842 7.2%
Indianapolis 7.1% 6.2% -0.9% $753 $ 788 4.7%
Jacksonville 5.3% 4.5% -0.8% $852 $ 915 7.5%
San Antonio 6.5% 5.7% -0.8% $862 $ 908 5.3%
Laggards**
All national markets experienced positive rent growth


MSA Count Based on Vacancy
Favorable Vacancy Trend: 28
Unfavorable Vacancy Trend: 25
Neutral Vacancy Trend: 1
Total MSAs: 54
MSA Count Based on Rent
Rent Growth Above 0%: 54
Rent Growth Below 0%: 0
Neutral Rent: 0
Total MSAs: 54

 




APARTMENT
Apartment vacancy was 3.9% in 2015 Q4, down from 4.0%
a year ago.6
Apartment cap rates decreased 30 bps to 5.8%
from 6.1% a year ago.7
Sales volume for apartment properties in the fourth quarter
totaled $50.5 billion, up 43.3% from a year ago.7
Apartment prices increased 12.9% from a year ago, and were
37.5% above the 2007 peak.8
“In most years, transaction volume for the office sector is
ahead of that for the apartment sector but more capital was
invested in the apartment sector than any other in 2015.
In many sectors, strong growth in portfolio sales and entity
level deals provided the lift to volume for 2015. For the
apartment sector however, growth in the sale of individual
assets was still strong, up 28.0% yoy. Deal volume grew in
2015 even as prices continued to rise. Initial estimates of the
Moody’s/RCA CPPITM suggest that prices increased 13.0%
yoy. This growth is not bad, but it is the weakest year of price
growth since 2010.”18
*Effective Apartment Rent- The actual rent after deducting the
value of concessions from the base
rental rate paid by tenant.

0%
4%
8%
12%
16%
-100
0
100
200
300
'94 '97 '00 '03 '06 '09 '12 '15
VacancyRate
ThousandUnits
Apartment Market
Completion Net Absorption Vacancy Rate
U.S. Commercial Real Estate Market Overview
First Quarter 2016
Applied Research
www.aegonrealty.com We use our investment management expertise to help people achieve a lifetime of financial security
-6%
-4%
-2%
0%
2%
4%
6%
8%
'01 '02 '03 '04 '05 '06 '07 '08 '09 '10 '11 '12 '13 '14 '15
Year-over-yeargrowth
Effective Apartment Rent
3
CoStar Portfolio Strategy, 2015 Q4
*Leaders have a favorable vacancy trend and rent growth of 3% or higher.
**Laggards have an unfavorable vacancy trend and rent growth of 0% or lower.
Annual Data, CoStar Portfolio Strategy, 2015 Q4
OFFICE
The office vacancy rate dropped to 10.8% in 2015 Q4
from 11.3% a year ago.6
Transaction volume was $39 billion in 2015 Q4, down 2.0%
from a year ago. Cap rates fell in both CBD and Suburban
locales in Q4. In the suburbs, the decline was 16 bps
from a year earlier with a 7.0% national average while CBD
office cap rates compressed 14 bps to 5.8%.7
Office prices are 18.7% above the 2007 peak. CBD office
prices are up 16.6% from a year ago, while suburban
prices are up only 9.0%.8
“The breadth of the U.S. office market is one of its greatest
strengths. Having options provides value. Secondary office
markets are experiencing higher levels of investment for
just this reason, somewhat greater volatility priced by
higher yields, and the ability to accommodate fast-
growing companies with a volume of new construction
at costs much lower than that available in the primary
downtowns. Interviewees spoke of “pocket markets,”
conversions and redevelopments, and opportunities to
reposition struggling suburban office parks with vast
parking into more effective mixed use.”10
Top And Bottom Trending Markets (Year Over Year)
Vacancy Rent ($/Unit)
Leaders* 14Q4 15Q4 CHANGE 14Q34 15Q4 CHANGE
San Jose 10.0% 7.1% -2.9% $34.70 $38.40 10.8%
East Bay 10.7% 8.6% -2.1% $24.20 $26.50 9.4% 
Miami 11.9% 10.0% -1.9% $29.00 $30.40 4.9%
Atlanta 13.9% 12.2% -1.7% $18.60 $19.60 5.7%
Nashville 6.9% 5.3% -1.6% $20.10 $21.60 7.8%
Laggards**
There were 0 out of 54 MSAs with both unfavorable vacancy trends and negative rent growth.


MSA Count Based on Vacancy
Favorable Vacancy Trend: 44
Unfavorable Vacancy Trend: 7
Neutral Vacancy Trend: 3
Total MSAs: 54
MSA Count Based on Rent
Rent Growth Above 0%: 52
Rent Growth Below 0%: 2
Neutral Rent: 0
Total MSAs: 54


0%
4%
8%
12%
16%
-75
0
75
150
225
'88 '91 '94 '97 '00 '03 '06 '09 '12 '15
VacancyRate
MillionSquareFeet
Office Market
Completion Net Absorption Vacancy Rate
U.S. Commercial Real Estate Market Overview
First Quarter 2016
Applied Research
www.aegonrealty.com We use our investment management expertise to help people achieve a lifetime of financial security
-10%
-8%
-6%
-4%
-2%
0%
2%
4%
6%
8%
10%
12%
'01 '02 '03 '04 '05 '06 '07 '08 '09 '10 '11 '12 '13 '14 '15
Year-over-yeargrowth
Office Asking Rent





4
INDUSTRIAL
The industrial vacancy rate dropped to 5.9% in 2015 Q4
from 6.5% a year ago.6
Transaction volume was $25.7 billion in 2015 Q4, up
66.0% from a year ago. Cap rates fell 30 bps from last year
to 6.7%.7
Industrial property prices are up 6.9% from a year ago, and
are 2.8% above the 2007 peak.8
“As it did last year, warehouse industrial ranks as the top pick
among investors with regard to investment prospects in the
year ahead, according to Emerging Trends in Real Estate®
2016, published by PwC and ULI. Specifically, industrial/
distribution scored a 3.63 on a scale of 1 (abysmal) to 5
(excellent), just above multifamily with a score of 3.50 and
office with a score of 3.43. The results of this year’s
Emerging Trends report also awarded the industrial sector
its highest score since 2004. Looking ahead, all Survey
participants see values rising in this market over the next
12 months. The highest expected value increase is 10.0%
– the average increase is 3.3%.” 9
Annual Data, CoStar Portfolio Strategy, 2015 Q4
CoStar Portfolio Strategy, 2015 Q4
*Leaders have a favorable vacancy trend and rent growth of 3% or higher.
**Laggards have an unfavorable vacancy trend and rent growth of 0% or lower.
Top And Bottom Trending Markets (Year Over Year)
Vacancy Rent ($/Unit)
Leaders* 14Q4 15Q4 CHANGE 14Q4 15Q4 CHANGE
Austin 8.2% 5.6% -2.6% $7.50 $ 8.10 8.9%
Memphis 12.6% 10.2% -2.4% $2.80 $ 2.90 3.2%
Las Vegas 8.2% 5.9% -2.3% $5.80 $ 6.30 8.6%
Raleigh 7.2% 4.9% -2.3% $5.00 $ 5.30 6.5%
San Diego 5.7% 3.8% -1.9% $9.80 $10.30 5.3%
Laggards**
All national markets experienced positive rent growth
 
MSA Count Based on Vacancy
Favorable Vacancy Trend: 45
Unfavorable Vacancy Trend: 7
Neutral Vacancy Trend: 2
Total MSAs: 54
MSA Count Based on Rent
Rent Growth Above 0%: 53
Rent Growth Below 0%: 0
Neutral Rent: 1
Total MSAs: 54
0%
4%
8%
12%
16%
-100
0
100
200
300
'82 '85 '88 '91 '94 '97 '00 '03 '06 '09 '12 '15
VacancyRate
MillionSquareFeet
Industrial Market
Completion Net Absorption Vacancy Rate
U.S. Commercial Real Estate Market Overview
First Quarter 2016
Applied Research
www.aegonrealty.com We use our investment management expertise to help people achieve a lifetime of financial security








-8%
-6%
-4%
-2%
0%
2%
4%
6%
8%
10%
'01 '02 '03 '04 '05 '06 '07 '08 '09 '10 '11 '12 '13 '14 '15
Year-over-yeargrowth
Industrial Asking Rent
5
Annual Data, CoStar Portfolio Strategy, 2015 Q4
CoStar Portfolio Strategy, 2015 Q4
*Leaders have a favorable vacancy trend and rent growth of 3% or higher.
**Laggards have an unfavorable vacancy trend and rent growth of 0% or lower.
RETAIL
Retail vacancy decreased to 5.8% in 2015 Q4, down from
6.1% a year ago.6
Cap rates for the retail sector fell 20 bps
from a year earlier to 6.4% in Q4. Total sales volume for
Q4 was $21.3 billion, down 16.0% from a year earlier.7
Retail property prices increased 12.6% from a year ago,
but are 2.4% below the 2007 peak.8
“Little movement in the vacancy rate for U.S. regional malls
and the ambiguity of U.S. interest rate increases have
some investors feeling uneasy about investing in this
property type. The trepidation felt by some investors with
regard to regional mall investing is noted in this market’s
average initial-year market rent change rate assumption,
which slips 20 basis points this quarter and represents the
first quarterly drop for this key indicator in the past year.
Moreover, in Emerging Trends in Real Estate® 2016,
published by PwC and ULI, regional malls placed last
among the 16 commercial/multifamily subsectors included
in the report with regard to both investment and develop-
ment prospects for the year ahead.” 9
Top And Bottom Trending Markets (Year Over Year)
Vacancy Rent ($/Unit)
Leaders* 14Q4 15Q4 CHANGE 14Q4 15Q4 CHANGE
Austin 4.8% 3.8% -1.0%  $18.00 $19.37 7.6%
Palm Beach County 6.3% 5.5% -0.8%  $18.19 $19.47 7.0%
Orlando 6.6% 5.9% -0.7%  $14.84 $15.51 4.5%
Phoenix 10.1% 9.5% -0.6%  $13.90 $14.37 3.4%
Raleigh 5.1% 4.5% -0.6%  $14.91 $15.98 7.2%
Laggards**
Philadelphia 6.0% 6.3% 0.3% $15.6 $15.6 -0.3%
MSA Count Based on Vacancy
Favorable Vacancy Trend: 39
Unfavorable Vacancy Trend: 6
Neutral Vacancy Trend: 9
Total MSAs: 54
MSA Count Based on Rent
Rent Growth Above 0%: 40
Rent Growth Below 0%: 14
Neutral Rent: 0
Total MSAs: 54





 
0%
4%
8%
12%
16%
0
50
100
150
200
'90 '95 '00 '05 '10 '15
VacancyRate
MillionSquareFeet
Retail Market
Completion Net Absorption Vacancy Rate
U.S. Commercial Real Estate Market Overview
First Quarter 2016
Applied Research
www.aegonrealty.com We use our investment management expertise to help people achieve a lifetime of financial security
-8%
-6%
-4%
-2%
0%
2%
4%
6%
8%
'01 '02 '03 '04 '05 '06 '07 '08 '09 '10 '11 '12 '13 '14 '15
Year-over-yeargrowth
Retail Asking Rent
60-DAY DELINQUENCY RATES
Dec-13 Dec-14 Dec-15
Office 7.8% 5.6% 5.4%
Industrial 9.8% 7.1% 5.2%
Retail 5.7% 5.3% 5.4%
Apartment 5.1% 3.7% 2.6%
Lodging 7.2% 4.2% 2.6%
Total 6.3% 4.7% 4.0%
HIGHEST AND LOWEST DELINQUENCY RATES by MSA
($ Balance in millions, includes Apartment, Retail, Industrial, and Office, top 50 MSAs, Trepp downloaded November 2015)
Highest Delinquent Balance 60+ Days Lowest Delinquent Balance 60+Days
Providence, RI $147 10.0% San Jose, CA $0 0.0%
Cleveland, OH $287 10.0% Portland, OR $5 0.1%
Jacksonville, FL $286 9.9% New Orleans, LA $3 0.2%
Richmond, VA $203 8.9% Salt Lake City, UT $9 0.4%
Buffalo, NY $101 8.8% Austin, TX $40 0.6%
Pittsburgh, PA $217 7.9% Houston, TX $167 1.0%
Las Vegas, NV $465 6.8% Louisville, KY $20 1.0%
Detroit, MI $392 6.6% San Antonio, TX $47 1.1%
Raleigh, NC $161 5.7% San Francisco, CA $112 1.3%
Birmingham, AL $100 5.6% Seattle, WA $114 1.4%
6
CMBS DELINQUENCY
The percentage of loans seriously delinquent*
was
3.97% in December 201511
, down from 4.7% a year
ago. The percentage of loans seriously delinquent
peaked at 9.2% in July 2012.
The retail sector was the most improved sector in
December, increased 0.09% from a year ago. The
other four sectors all decreased, with industrial
declining 1.9%, lodging declining 1.6%, apartment
declining 1.1% and office declining 0.3%.
* Loan 60+ days delinquent, in foreclosure, REO, or non-performing
1
Seriously delinquent percentage may not match Trepp’s monthly
report.
Trepp, December, 2015
0%
5%
10%
15%
20%
'00 '01 '02 '03 '04 '05 '07 '08 '09 '10 '11 '12 '14 '15
CMBS Delinquency Rates
60 Days Delinquent Including Non-Performing Balances
Apartment Industrial Office Retail Lodging
Recessions
U.S. Commercial Real Estate Market Overview
First Quarter 2016
Applied Research
www.aegonrealty.com We use our investment management expertise to help people achieve a lifetime of financial security
CAP RATES (RERC)
2012 Q4 2013 Q4 2014 Q4 2015 Q4
Office 6.1% 5.8% 5.6% 5.4%
Industrial 6.6% 6.4% 6.0% 6.0%
Apartment 5.4% 5.2% 5.0% 4.8%
Retail 6.6% 6.7% 6.2% 5.9%
7
TRANSACTION VOLUME
Sales of commercial real estate totaled $157 billion in
2015 Q4, up 19.5% from a year ago. The industrial
sector was the most improved, recording a 66.0% year-
over-year increase in sales volume. The retail (-16.0%)
and office (-2.0%) sectors recorded volume decreased,
while the apartment properties (+43.3%) saw an
increase in volume.
CAP RATES
Cap rates continued to fall in Q4 across all property
types except Industrial which remained the same
from a year ago. The retail sector had the most cap
rate compression, declining 30 basis points from a
year ago.
Real Capital Analytics, 2015 Q4
Situs RERC, 2015 Q4
Number of Properties sold
2006 Q4 (Peak) 2009 Q1 (Trough) 2015 Q4
Office 1,577 261 1,482
Industrial 1,416 275 2,537
Apartment 1,825 376 2,066
Retail 1,903 351 1,795
U.S. Commercial Real Estate Market Overview
First Quarter 2016
Applied Research
www.aegonrealty.com We use our investment management expertise to help people achieve a lifetime of financial security
$(40)
$(20)
$-
$20
$40
$60
$80
$100
$120
$140
$160
'01 '05 '10 '15
Billions
Commercial Real Estate Transaction Volume
All Property Types - Quarterly
Average Transaction Size
Millions
$16 m
$22 m
$8.6 m
$20 bn
$158 bn
$115 bn
$17.6 m
$14 bn
$16 m
$22 m
$20 bn
$158 bn
$115 bn
$20
$0
4.5%
6.5%
8.5%
10.5%
'94 '97 '00 '03 '06 '09 '12 '15
Apartment Industrial Office Retail
Commercial Real Estate Cap Rates
Quarterly
Recessions
0.7
0.8
0.9
1.0
1.1
1.2
1.3
1.4
'00 '01 '02 '03 '04 '05 '06 '07 '08 '09 '10 '11 '12 '13 '14 '15
Rent Index
Apartment Industrial Office Retail
Recessions
8
NCREIF
The trailing one-year return for the NCREIF
property index (NPI) increased to 13.5% in Q4
2015. The NPI is a measure of unlevered private
equity returns as determined through application
of an appraisal-based exit price.
December 1, 2015
RENTS
Rent levels in the fourth quarter rose modestly
across all property types. The Apartment sector
reported the highest growth in 2015 Q4, with
effective rents 6.0% higher than a year ago.
Annual rates (appreciation + income)
NCREIF, 2015 Q4
CoStar Portfolio Strategy, 2015 Q4
Industrial +5.9%
Office +4.4%
Retail +2.1%
Apartment +6.0%
Rent Index From a Year Ago
U.S. Commercial Real Estate Market Overview
First Quarter 2016
Applied Research
www.aegonrealty.com We use our investment management expertise to help people achieve a lifetime of financial security
-30%
-20%
-10%
0%
10%
20%
30%
'78 '80 '82 '84 '86 '88 '90 '92 '94 '96 '98 '00 '02 '04 '06 '08 '10 '12 '14 '15
NCREIF Property Index (NPI)
Apartment Industrial Office Retail
Recessions
* Industrial, Office and Retail industry are using Asking rent as a standard
for rent index.
* Apartment industry is using Effective rent as a standard for rent index.
9
RETAIL SALES
Nonstore retail (primarily internet sales) were $125
billion in the fourth quarter of 2015, up 6.8% from a
year ago.
Retail sales, excluding nonstore, were $1.3 trillion in
the fourth quarter, up 2.0% from a year ago.
Comparing retail sales categories, gasoline stations
declined the most from a year ago (-18.5%).
Electronics and appliance stores also declined
(-4.5%). Food services and drinking places (+6.7%)
and Motor Vehicle and Parts Dealers (+6.0%) in-
creased from a year ago.
U.S. Census Bureau, December, 2015
CoStar Portfolio Strategy, 2015 Q4
NONSTORE SHARE OF RETAIL
Nonstore (Billions) % Of All Retail Sales
2000Q4 $48 5.8%
2005Q4 $67 6.5%
2010Q4 $88 8.0%
2015Q4 $125 9.3%
CONSUMER CONFIDENCE
The Consumer Confidence Index now stands at 92.2,
down 5.9 points from January 2016. The Consumer
Sentiment Index was 91.7 in February, down from the
final January read of 92.0.
“Consumer confidence slumped in February as
households grew more concerned about the out-
look for the economy and job. Americans said they
believed the high-flying job market wouldn’t get
much better as they turned the most pessimistic
about the outlook for stock prices in more than three
years. While buying plans for automobiles held up,
households said they were less likely to buy homes
or major appliances, raising concern about the
strength of consumer spending, the biggest part of
the economy.”12
Reuters/University of Michigan Consumer Sentiment Index, 26 February, 2016
The Conference Board Consumer Confidence Index, 23 February, 2016
U.S. Commercial Real Estate Market Overview
First Quarter 2016
Applied Research
www.aegonrealty.com We use our investment management expertise to help people achieve a lifetime of financial security
$60
$70
$80
$90
'95 '00 '05 '10 '15
Retail Sales
Quarterly, Inflation Adjusted
Sales/SF (ex nonstore sales) Sales/SF (including nonstore sales)
Recession
0
50
100
150
'00 '01 '02 '03 '04 '05 '06 '07 '08 '09 '10 '11 '12 '13 '14 '15 '16
Consumer Confidence Consumer Confidence
Consumer Sentiment
Recessions
February 2016
: 92.2
: 91.7
10
U.S. Census Bureau, February 1, 2016
CONSTRUCTION SPENDING
The annualized rate for residential construction
spending in December was $429.6 billion, up
23.0% from a year ago and 36.0% lower than the
2006 peak.
The annualized rate for non-residential construc-
tion spending in December was $394.4 billion, up
11.0% from a year ago but 5.0% lower than the
2008 peak.
“U.S. construction spending barely rose in
December as spending on nonresidential
structures recorded its biggest drop since 2013,
suggesting a mild downward revision to the
advance fourth-quarter GDP growth estimate.
Economists polled by Reuters had forecast
construction spending rising 0.6 percent in
December after a previously reported 0.4 percent
drop in November. ”15
USDA, Ag Land Values and Cash Rents Annual Summary, January 2016
International Monetary Fund, Primary Commodity Price Index, January 2016
COMMODITY PRICES
The IMF Commodity Index is 58.0% below the July
2008 peak. For 2015 Q4, Crude Oil (-40.0%) and
Energy (-39.3%) declined from a year ago.13
Commodity prices fell 7.1 percent in December,
extending losses to seven months, led by a sharp
decline in oil prices. Non-fuel prices fell 0.2
percent, and in part reflect appreciation of the U.S.
dollar. During 2015 (Dec’14-Dec’15), commodity
prices fell 30.7 percent with energy dropping 39.3
percent and non fuel prices falling 19.1 percent.14
0
1
2
3
4
5
'93 '95 '97 '99 '01 '03 '05 '07 '09 '11 '13 '15
US Farm Value and Commodity Prices
(Values Indexed, 1992=1)
Commodity Index (IMF)
Farm Value (Last Update August 2015)
$0
$200
$400
$600
$800
'96 '97 '98 '99 '00 '01 '02 '03 '04 '05 '06 '07 '08 '09 '10 '11 '12 '13 '14 '15
Billions
Private Construction Spending
Residential Non-Residential
Recession
U.S. Commercial Real Estate Market Overview
First Quarter 2016
Applied Research
www.aegonrealty.com We use our investment management expertise to help people achieve a lifetime of financial security
ORIGINATIONS BY PROPERTY TYPE
2013 Q4 2014 Q4 2015 Q4
Office 9.4% 8.0% 7.9%
Industrial 4.6% 4.8% 9.4%
Apartment 42.8% 49.5% 48.9%
Retail 10.3% 10.0% 9.7%
Other* 32.9% 27.8% 24.2%
ORIGINATIONS BY INVESTOR CLASS
2013 2014 2015
Life Cos 23.0% 18.7% 18.7%
GSEs 16.0% 30.0% 25.7%
Comm Bank 32.6% 25.8% 33.6%
Conduits 28.4% 25.6% 22.0%
LIFE Cos ORIGINATIONS
(Billions)
2006 Q4 $7.1
2007 Q4 $6.0
2008 Q4 $1.6
2009 Q4 $3.4
2010 Q4 $9.2
2011 Q4 $8.0
2012 Q4 $9.4
2013 Q4 $13.2
2014 Q4 $14.2
2015 Q4 $16.9
0
250
500
750
'04 '05 '06 '07 '08 '09 '10 '11 '12 '13 '14 '15
Commercial Loan Originations
Life Insurance GSE's (Fannie/Freddie)
Commercial Banks CMBS/Conduits
Recession
$0
$2
$4
$6
$8
$10
$12
$14
$16
$18
'03 '04 '05 '06 '07 '08 '09 '10 '11 '12 '13 '14 '15
Billions
Life Company Loan Originations Life Insurance Company's
4Q Trailing
Recession
11
ORIGINATIONS
Mortgage Bankers Association Quarterly Survey of Commercial/Multi-
family Mortgage Bankers Originations, 2015 Q4
Mortgage Bankers Association Quarterly Survey of Commercial/Multifamily
Mortgage Bankers Originations, 2015 Q4
“Fourth quarter 2015 commercial and multifamily
mortgage originations were 35 percent higher than in
the third quarter and 19 percent higher than fourth
quarter of 2014. The fourth quarter was the fourth
highest quarter for borrowing and lending on record.
Banks, life insurance companies, and Fannie Mae and
Freddie Mac saw their highest originations volumes on
record. Of the major investor groups, only the CMBS
market didn’t break a record for originations. In terms
of overall borrowing and lending volumes, 2015 as a
whole was likely second only to 2007.”16
*Other includes hotel and health care
U.S. Commercial Real Estate Market Overview
First Quarter 2016
Applied Research
www.aegonrealty.com We use our investment management expertise to help people achieve a lifetime of financial security
12
EMPLOYMENT
The February unemployment rate was 4.9%, down
from 5.5% a year ago.
Significant payroll increases from a year ago include
construction (+3.8%), professional services (+3.1%),
and leisure and hospitality (+3.0%). Mining and
Logging is the only sector that decreased payroll
(-16.1%).
All sectors experienced payroll increases since the
2010 trough. The job sectors with the
highest increases include construction (+20.6%) and
administrative service (+21.0%). Total nonfarm
employment has increased 10.7% since 2010.
Bureau of Labor Statistics, Employment Situation, March 4, 2016
Employment figures reflect private and government non-farm jobs
REPEAT SALES INDICES
The Commercial Property Price Index reported by RCA is
up 13.0% in December from a year ago and up 17.0%
from the 2007 peak.
The U.S. Investment Grade segment increased 10.5%
over the past 12 months. The U.S. General Commercial
Index increased 9.1% in December from a year ago.17
“Improving CRE fundamentals, surging investor demand
and liquid capital markets propelled the CCRSI composite
indices upward in 2015. Demand for core property
assets was especially strong. The value-weighted U.S.
Composite Index rose 12.5% in 2015 to an all-time high
that is 19.1% above its prerecession peak.”17
“Among
key drivers of the price recovery were the increased
availability and decreased cost of debt and equity capi-
tal, capitalization rate compression, improving property
fundamentals and a declining share of distressed trans-
Real Capital Analytics/Moody’s Investor Service, January 2016
CoStar Commercial Repeat-Sale Indices, January 2016.
The difference between the RCA Index and the CoStar Indices is primarily the methodology weighting
repeat sales, not the data sources.
Commercial Property Price Index (Moody’s/RCA) - Index is based on property sales over $2.5 million.
U.S. Investment Grade (CoStar) - This Index includes Class A and B offices with 35,000 SF or more,
industrial properties with 80,000 SF or more, flex properties with 55,000 SF or more, retail properties
with 25,000 SF or more, multifamily properties with 90,000 SF or more, and hotels with 125,000 SF or
more.
U.S. General Commercial (CoStar) - Only includes properties not meeting the Investment Grade criteria.
0.5
0.6
0.7
0.8
0.9
1.0
1.1
1.2
'08 '09 '10 '11 '12 '13 '14 '15
Price Based on Repeat Sales Indices
Commercial Property Price Index (RCA) U.S. Investment Grade (CoStar)
U.S. General Commercial (CoStar)
U.S. Commercial Real Estate Market Overview
First Quarter 2016
Applied Research
www.aegonrealty.com We use our investment management expertise to help people achieve a lifetime of financial security
2%
4%
6%
8%
10%
12%
-900
-600
-300
0
300
600
'00 '01 '02 '03 '04 '05 '06 '07 '08 '09 '10 '11 '12 '13 '14 '15 '16
UnemploymentRate
PayrollEmploymentM/MChange
Employment Situation Payroll Change
Unemployment Rate
February 2016
: 242,000
: 4.9%
Recessions
Thousands
13
ADDITIONAL OBSERVATIONS
Prepared by Aegon USA Realty Advisors Applied Research Group
Don Guarino, MAI, CRE, CCIM, FRICS
dguarino@aegonusa.com
Brad Bohl
brbohl@aegonusa.com
Felicia Gan, Neil Zhang
ENDNOTES
1
Real Capital Analytics, U.S. Capital Trend-Big Picture, 2015 Year in Review
2
Bloomberg Business, Rates & Bonds, 2016
3
Real Estate Research Corporation (RERC), 2015 Q4
4
European Central Bank, Statisics, Key Euro Area Indicators, March 2016
5
PricewaterhouseCoopers (PWC), Real Estate Tax Alert, February 2015
6
CoStar Portfolio Strategy, 2015Q4
7
Real Capital Analytics, 2015Q4
8
Moody CPPI Report, February 2016
9
PricewaterhouseCoopers (PWC), Real Estate Survey, 2015 Q4
10
PricewaterhouseCoopers (PWC), Emerging Trend in Real Estate, 2016
11
Trepp, Loan Performance by Preperty Type, December 2015
12
Darie, T. ( February 23, 2016). “ Consumer confidence in U.S. sinks to Seven-Month Low”.
13
International Monetary Fund, Monthly data, 2015
14
International Monetary Fund, Commodity Market Monthly, January 15, 2016.
15
Reuters-Market. (February 1, 2016), “U.S. construction spending up slightly in December”
16
Quarterly Survey of Commercial/Multifamily Mortgage Bankers Originations, Q4 2015
17
Costar Commercial Repeat- Sale Indices Press Release, January 2016
18
Real Capital Analytics, U.S. Capital Trend-Apartment, 2015 Year in Review
DISCLOSURES
Aegon USA Realty Advisors, LLC, (AURA) is a U.S.-based real estate asset manager and a member company of Aegon Asset Management, the
global investment management division of the Aegon Group.
The information included in this document should not be construed as investment advice or a recommendation for the purchase or sale of any security, loan, interest in real
estate, or other investment. This material contains general information only on economic and investment matters; it should not be considered as a comprehensive state-
ment on any matter and should not be relied upon as such. The information does not take into account any investor’s investment objectives, particular needs or financial
situation. The value of any investment may fluctuate. This information has been developed internally and may incorporate third party data, text, images and other content
deemed to be reliable. Any opinions, estimates and projections included herein constitute the current judgement of the author as of the date of this document. Aegon USA
Realty Advisors., LLC (AURA) has no obligation to update, modify or amend this document or to otherwise notify the reader in the event that any matter stated herein, or if
any opinion, projection, forecast or estimate set forth herein, changes or subsequently becomes or is determined to be innaccurate. The reader acknowledges that all right,
title and interest in the content of this document is owned by AURA and cannot be further distributed without the prior written consent of AURA.
Copyright © 2016 Aegon USA Realty Advisors, LLC
Ref Code: 032016039OP
Expires: 6/30/2017
U.S. Commercial Real Estate Market Overview
First Quarter 2016
Applied Research
www.aegonrealty.com We use our investment management expertise to help people achieve a lifetime of financial security

More Related Content

What's hot

Capital Markets Insights - Spring 2017
Capital Markets Insights - Spring 2017Capital Markets Insights - Spring 2017
Capital Markets Insights - Spring 2017Duff & Phelps
 
Capital Markets Industry Insights - Q1 2016
Capital Markets Industry Insights - Q1 2016Capital Markets Industry Insights - Q1 2016
Capital Markets Industry Insights - Q1 2016Duff & Phelps
 
rics-brazil-Copy
rics-brazil-Copyrics-brazil-Copy
rics-brazil-CopyEasypeasy
 
Global market-perspective-q1-2014
Global market-perspective-q1-2014Global market-perspective-q1-2014
Global market-perspective-q1-2014Giacinto Tommasini
 
Paul Flood-Market-commentaryMay 18-2013
Paul Flood-Market-commentaryMay 18-2013Paul Flood-Market-commentaryMay 18-2013
Paul Flood-Market-commentaryMay 18-2013PAUL FLOOD
 
Outlook 2015 - Making Sense Of The Markets
Outlook 2015 - Making Sense Of The MarketsOutlook 2015 - Making Sense Of The Markets
Outlook 2015 - Making Sense Of The MarketsPhil Caulfield
 
The Arabian Markets - Neverland
The Arabian Markets - Neverland The Arabian Markets - Neverland
The Arabian Markets - Neverland Tarek Fadlallah
 
Client Alert: Brexit - The Impact on Cost of Capital
Client Alert: Brexit - The Impact on Cost of CapitalClient Alert: Brexit - The Impact on Cost of Capital
Client Alert: Brexit - The Impact on Cost of CapitalDuff & Phelps
 
Valuation Insights - Q3 2016
Valuation Insights - Q3 2016Valuation Insights - Q3 2016
Valuation Insights - Q3 2016Duff & Phelps
 
Capital Markets Industry Insights - Fall 2016
Capital Markets Industry Insights - Fall 2016Capital Markets Industry Insights - Fall 2016
Capital Markets Industry Insights - Fall 2016Duff & Phelps
 
Achieving-prudent-debt-targets-using-fiscal-rules-Rencontres-economiques-d-Ai...
Achieving-prudent-debt-targets-using-fiscal-rules-Rencontres-economiques-d-Ai...Achieving-prudent-debt-targets-using-fiscal-rules-Rencontres-economiques-d-Ai...
Achieving-prudent-debt-targets-using-fiscal-rules-Rencontres-economiques-d-Ai...OECD, Economics Department
 
4Q20 Forbes Market Update
4Q20 Forbes Market Update4Q20 Forbes Market Update
4Q20 Forbes Market UpdateSara Cody
 
1 mysea2020001 blockchain malaysia
1 mysea2020001   blockchain malaysia1 mysea2020001   blockchain malaysia
1 mysea2020001 blockchain malaysiaRein Mahatma
 
Global Capital Confidence Barometer | In an age of M&A complexity, do you pau...
Global Capital Confidence Barometer | In an age of M&A complexity, do you pau...Global Capital Confidence Barometer | In an age of M&A complexity, do you pau...
Global Capital Confidence Barometer | In an age of M&A complexity, do you pau...EY
 
Mercer Capital's Value Focus: Construction and Building Materials | Q2 2020 |...
Mercer Capital's Value Focus: Construction and Building Materials | Q2 2020 |...Mercer Capital's Value Focus: Construction and Building Materials | Q2 2020 |...
Mercer Capital's Value Focus: Construction and Building Materials | Q2 2020 |...Mercer Capital
 
The wildebeests are feeling frisky 2 10-12
The wildebeests are feeling frisky 2 10-12The wildebeests are feeling frisky 2 10-12
The wildebeests are feeling frisky 2 10-12Jeb Terry Sr
 
Why the USA is no longer AAA
Why the USA is no longer AAAWhy the USA is no longer AAA
Why the USA is no longer AAAScope Group
 

What's hot (20)

South East Asia - 2019 M&A Summary
South East Asia - 2019 M&A SummarySouth East Asia - 2019 M&A Summary
South East Asia - 2019 M&A Summary
 
Capital Markets Insights - Spring 2017
Capital Markets Insights - Spring 2017Capital Markets Insights - Spring 2017
Capital Markets Insights - Spring 2017
 
Capital Markets Industry Insights - Q1 2016
Capital Markets Industry Insights - Q1 2016Capital Markets Industry Insights - Q1 2016
Capital Markets Industry Insights - Q1 2016
 
rics-brazil-Copy
rics-brazil-Copyrics-brazil-Copy
rics-brazil-Copy
 
Global market-perspective-q1-2014
Global market-perspective-q1-2014Global market-perspective-q1-2014
Global market-perspective-q1-2014
 
Paul Flood-Market-commentaryMay 18-2013
Paul Flood-Market-commentaryMay 18-2013Paul Flood-Market-commentaryMay 18-2013
Paul Flood-Market-commentaryMay 18-2013
 
Outlook 2015 - Making Sense Of The Markets
Outlook 2015 - Making Sense Of The MarketsOutlook 2015 - Making Sense Of The Markets
Outlook 2015 - Making Sense Of The Markets
 
2017 OECD Business and Finance Outlook Key Findings
2017 OECD Business and Finance Outlook Key Findings2017 OECD Business and Finance Outlook Key Findings
2017 OECD Business and Finance Outlook Key Findings
 
The Arabian Markets - Neverland
The Arabian Markets - Neverland The Arabian Markets - Neverland
The Arabian Markets - Neverland
 
Client Alert: Brexit - The Impact on Cost of Capital
Client Alert: Brexit - The Impact on Cost of CapitalClient Alert: Brexit - The Impact on Cost of Capital
Client Alert: Brexit - The Impact on Cost of Capital
 
Valuation Insights - Q3 2016
Valuation Insights - Q3 2016Valuation Insights - Q3 2016
Valuation Insights - Q3 2016
 
Capital Markets Industry Insights - Fall 2016
Capital Markets Industry Insights - Fall 2016Capital Markets Industry Insights - Fall 2016
Capital Markets Industry Insights - Fall 2016
 
Achieving-prudent-debt-targets-using-fiscal-rules-Rencontres-economiques-d-Ai...
Achieving-prudent-debt-targets-using-fiscal-rules-Rencontres-economiques-d-Ai...Achieving-prudent-debt-targets-using-fiscal-rules-Rencontres-economiques-d-Ai...
Achieving-prudent-debt-targets-using-fiscal-rules-Rencontres-economiques-d-Ai...
 
4Q20 Forbes Market Update
4Q20 Forbes Market Update4Q20 Forbes Market Update
4Q20 Forbes Market Update
 
1 mysea2020001 blockchain malaysia
1 mysea2020001   blockchain malaysia1 mysea2020001   blockchain malaysia
1 mysea2020001 blockchain malaysia
 
Global Capital Confidence Barometer | In an age of M&A complexity, do you pau...
Global Capital Confidence Barometer | In an age of M&A complexity, do you pau...Global Capital Confidence Barometer | In an age of M&A complexity, do you pau...
Global Capital Confidence Barometer | In an age of M&A complexity, do you pau...
 
Mercer Capital's Value Focus: Construction and Building Materials | Q2 2020 |...
Mercer Capital's Value Focus: Construction and Building Materials | Q2 2020 |...Mercer Capital's Value Focus: Construction and Building Materials | Q2 2020 |...
Mercer Capital's Value Focus: Construction and Building Materials | Q2 2020 |...
 
The wildebeests are feeling frisky 2 10-12
The wildebeests are feeling frisky 2 10-12The wildebeests are feeling frisky 2 10-12
The wildebeests are feeling frisky 2 10-12
 
Why the USA is no longer AAA
Why the USA is no longer AAAWhy the USA is no longer AAA
Why the USA is no longer AAA
 
2010 outlook
2010 outlook2010 outlook
2010 outlook
 

Viewers also liked

Us taxation of foreign nationals
Us taxation of foreign nationalsUs taxation of foreign nationals
Us taxation of foreign nationalscutmytaxes
 
April disbursement-reports-hcad
April disbursement-reports-hcadApril disbursement-reports-hcad
April disbursement-reports-hcadcutmytaxes
 
Updated property tax information for texas taxpayers
Updated property tax information for texas taxpayersUpdated property tax information for texas taxpayers
Updated property tax information for texas taxpayerscutmytaxes
 
Texas housing market 2016
Texas housing market 2016Texas housing market 2016
Texas housing market 2016cutmytaxes
 
The Economy at a glance houston
The Economy at a glance houstonThe Economy at a glance houston
The Economy at a glance houstoncutmytaxes
 
Business personal property rendition GCAD
Business personal property rendition GCADBusiness personal property rendition GCAD
Business personal property rendition GCADcutmytaxes
 
2016 property tax case summaries
2016 property tax case summaries2016 property tax case summaries
2016 property tax case summariescutmytaxes
 
Brazoriacad plan
Brazoriacad planBrazoriacad plan
Brazoriacad plancutmytaxes
 
Brazoria trust list
Brazoria trust listBrazoria trust list
Brazoria trust listcutmytaxes
 
FY 2016 adopted budget book CCAD
FY 2016 adopted budget book CCADFY 2016 adopted budget book CCAD
FY 2016 adopted budget book CCADcutmytaxes
 
Sample Appraisal Report Industrial
Sample Appraisal Report IndustrialSample Appraisal Report Industrial
Sample Appraisal Report Industrialcutmytaxes
 
Galveston central appraisal district reappraisalplan 2015 2016
Galveston central appraisal district reappraisalplan 2015 2016Galveston central appraisal district reappraisalplan 2015 2016
Galveston central appraisal district reappraisalplan 2015 2016cutmytaxes
 
Fbcad financial report
Fbcad financial reportFbcad financial report
Fbcad financial reportcutmytaxes
 
Pasa demo graphic update wcad
Pasa demo graphic update wcadPasa demo graphic update wcad
Pasa demo graphic update wcadcutmytaxes
 
Spring 2016 course schedule MCAD
Spring 2016 course schedule MCADSpring 2016 course schedule MCAD
Spring 2016 course schedule MCADcutmytaxes
 
FY17 population report HCAD
FY17 population report HCADFY17 population report HCAD
FY17 population report HCADcutmytaxes
 

Viewers also liked (16)

Us taxation of foreign nationals
Us taxation of foreign nationalsUs taxation of foreign nationals
Us taxation of foreign nationals
 
April disbursement-reports-hcad
April disbursement-reports-hcadApril disbursement-reports-hcad
April disbursement-reports-hcad
 
Updated property tax information for texas taxpayers
Updated property tax information for texas taxpayersUpdated property tax information for texas taxpayers
Updated property tax information for texas taxpayers
 
Texas housing market 2016
Texas housing market 2016Texas housing market 2016
Texas housing market 2016
 
The Economy at a glance houston
The Economy at a glance houstonThe Economy at a glance houston
The Economy at a glance houston
 
Business personal property rendition GCAD
Business personal property rendition GCADBusiness personal property rendition GCAD
Business personal property rendition GCAD
 
2016 property tax case summaries
2016 property tax case summaries2016 property tax case summaries
2016 property tax case summaries
 
Brazoriacad plan
Brazoriacad planBrazoriacad plan
Brazoriacad plan
 
Brazoria trust list
Brazoria trust listBrazoria trust list
Brazoria trust list
 
FY 2016 adopted budget book CCAD
FY 2016 adopted budget book CCADFY 2016 adopted budget book CCAD
FY 2016 adopted budget book CCAD
 
Sample Appraisal Report Industrial
Sample Appraisal Report IndustrialSample Appraisal Report Industrial
Sample Appraisal Report Industrial
 
Galveston central appraisal district reappraisalplan 2015 2016
Galveston central appraisal district reappraisalplan 2015 2016Galveston central appraisal district reappraisalplan 2015 2016
Galveston central appraisal district reappraisalplan 2015 2016
 
Fbcad financial report
Fbcad financial reportFbcad financial report
Fbcad financial report
 
Pasa demo graphic update wcad
Pasa demo graphic update wcadPasa demo graphic update wcad
Pasa demo graphic update wcad
 
Spring 2016 course schedule MCAD
Spring 2016 course schedule MCADSpring 2016 course schedule MCAD
Spring 2016 course schedule MCAD
 
FY17 population report HCAD
FY17 population report HCADFY17 population report HCAD
FY17 population report HCAD
 

Similar to Commercial realestate market overview 2016

Colliers DC YE Report 2014 V11
Colliers DC YE Report 2014 V11Colliers DC YE Report 2014 V11
Colliers DC YE Report 2014 V11William E. Kaye
 
Listed European real estate: solid return prospects continue
Listed European real estate: solid return prospects continueListed European real estate: solid return prospects continue
Listed European real estate: solid return prospects continueJurgen Vluijmans
 
US Capital Trends-The Big Picture
US Capital Trends-The Big PictureUS Capital Trends-The Big Picture
US Capital Trends-The Big PictureLiberty McPartland
 
Usd Business Plan Pdf
Usd Business Plan PdfUsd Business Plan Pdf
Usd Business Plan PdfSagren Pillay
 
Powerpointpresentation 111208023204 Phpapp01
Powerpointpresentation 111208023204 Phpapp01Powerpointpresentation 111208023204 Phpapp01
Powerpointpresentation 111208023204 Phpapp01Sagren Pillay
 
Real Estate Capital Markets Are Alive, If Not Quite Well
Real Estate Capital Markets Are Alive, If Not Quite WellReal Estate Capital Markets Are Alive, If Not Quite Well
Real Estate Capital Markets Are Alive, If Not Quite WellDan Hutchins
 
Mercer Capital's Bank Watch | July 2019 | Bank M&A Mid-Year Update
Mercer Capital's Bank Watch | July 2019 | Bank M&A Mid-Year UpdateMercer Capital's Bank Watch | July 2019 | Bank M&A Mid-Year Update
Mercer Capital's Bank Watch | July 2019 | Bank M&A Mid-Year UpdateMercer Capital
 
Mercer Capital's Value Focus: Auto Dealer Industry | Year-End 2014
Mercer Capital's Value Focus: Auto Dealer Industry | Year-End 2014Mercer Capital's Value Focus: Auto Dealer Industry | Year-End 2014
Mercer Capital's Value Focus: Auto Dealer Industry | Year-End 2014Mercer Capital
 
Q2 2016 industrial brief 7 29-16 final
Q2 2016 industrial brief 7 29-16 finalQ2 2016 industrial brief 7 29-16 final
Q2 2016 industrial brief 7 29-16 finalJustin B. Smith
 
Executive Summary Powerpoint Presentation
Executive Summary Powerpoint PresentationExecutive Summary Powerpoint Presentation
Executive Summary Powerpoint PresentationSagren Pillay
 
Orbit barometer report october 2010
Orbit barometer report october 2010Orbit barometer report october 2010
Orbit barometer report october 2010Frédéric Goblet
 
Cygnet Executive Summary Powerpoint Presentation
Cygnet Executive Summary Powerpoint PresentationCygnet Executive Summary Powerpoint Presentation
Cygnet Executive Summary Powerpoint PresentationSagren Pillay
 
Metro Manila Property Outlook 2014
Metro Manila Property Outlook 2014Metro Manila Property Outlook 2014
Metro Manila Property Outlook 2014KMC Savills, Inc.
 
4Q_2015_RetailReport_email
4Q_2015_RetailReport_email4Q_2015_RetailReport_email
4Q_2015_RetailReport_emailPatrick Anthon
 
Sprung Investment Management Commentary - 1st Quarter, 2018
Sprung Investment Management Commentary - 1st Quarter, 2018Sprung Investment Management Commentary - 1st Quarter, 2018
Sprung Investment Management Commentary - 1st Quarter, 2018Robert Champion
 
Insurance Newsletter 6.30.15
Insurance Newsletter 6.30.15Insurance Newsletter 6.30.15
Insurance Newsletter 6.30.15Jeff Sims
 
US Real Estate Indicators Report
US Real Estate Indicators ReportUS Real Estate Indicators Report
US Real Estate Indicators Reportcutmytaxes
 
Sprung Investment Management Commentary - 1st Quarter, 2019
Sprung Investment Management Commentary - 1st Quarter, 2019Sprung Investment Management Commentary - 1st Quarter, 2019
Sprung Investment Management Commentary - 1st Quarter, 2019Robert Champion
 
Investing in US core real estate
Investing in US core real estateInvesting in US core real estate
Investing in US core real estatecutmytaxes
 

Similar to Commercial realestate market overview 2016 (20)

Colliers DC YE Report 2014 V11
Colliers DC YE Report 2014 V11Colliers DC YE Report 2014 V11
Colliers DC YE Report 2014 V11
 
Listed European real estate: solid return prospects continue
Listed European real estate: solid return prospects continueListed European real estate: solid return prospects continue
Listed European real estate: solid return prospects continue
 
US Capital Trends-The Big Picture
US Capital Trends-The Big PictureUS Capital Trends-The Big Picture
US Capital Trends-The Big Picture
 
Usd Business Plan Pdf
Usd Business Plan PdfUsd Business Plan Pdf
Usd Business Plan Pdf
 
Powerpointpresentation 111208023204 Phpapp01
Powerpointpresentation 111208023204 Phpapp01Powerpointpresentation 111208023204 Phpapp01
Powerpointpresentation 111208023204 Phpapp01
 
Real Estate Capital Markets Are Alive, If Not Quite Well
Real Estate Capital Markets Are Alive, If Not Quite WellReal Estate Capital Markets Are Alive, If Not Quite Well
Real Estate Capital Markets Are Alive, If Not Quite Well
 
Mercer Capital's Bank Watch | July 2019 | Bank M&A Mid-Year Update
Mercer Capital's Bank Watch | July 2019 | Bank M&A Mid-Year UpdateMercer Capital's Bank Watch | July 2019 | Bank M&A Mid-Year Update
Mercer Capital's Bank Watch | July 2019 | Bank M&A Mid-Year Update
 
Mercer Capital's Value Focus: Auto Dealer Industry | Year-End 2014
Mercer Capital's Value Focus: Auto Dealer Industry | Year-End 2014Mercer Capital's Value Focus: Auto Dealer Industry | Year-End 2014
Mercer Capital's Value Focus: Auto Dealer Industry | Year-End 2014
 
Q2 2016 industrial brief 7 29-16 final
Q2 2016 industrial brief 7 29-16 finalQ2 2016 industrial brief 7 29-16 final
Q2 2016 industrial brief 7 29-16 final
 
Executive Summary Powerpoint Presentation
Executive Summary Powerpoint PresentationExecutive Summary Powerpoint Presentation
Executive Summary Powerpoint Presentation
 
Orbit barometer report october 2010
Orbit barometer report october 2010Orbit barometer report october 2010
Orbit barometer report october 2010
 
Cygnet Executive Summary Powerpoint Presentation
Cygnet Executive Summary Powerpoint PresentationCygnet Executive Summary Powerpoint Presentation
Cygnet Executive Summary Powerpoint Presentation
 
LaSalleS16-Final
LaSalleS16-FinalLaSalleS16-Final
LaSalleS16-Final
 
Metro Manila Property Outlook 2014
Metro Manila Property Outlook 2014Metro Manila Property Outlook 2014
Metro Manila Property Outlook 2014
 
4Q_2015_RetailReport_email
4Q_2015_RetailReport_email4Q_2015_RetailReport_email
4Q_2015_RetailReport_email
 
Sprung Investment Management Commentary - 1st Quarter, 2018
Sprung Investment Management Commentary - 1st Quarter, 2018Sprung Investment Management Commentary - 1st Quarter, 2018
Sprung Investment Management Commentary - 1st Quarter, 2018
 
Insurance Newsletter 6.30.15
Insurance Newsletter 6.30.15Insurance Newsletter 6.30.15
Insurance Newsletter 6.30.15
 
US Real Estate Indicators Report
US Real Estate Indicators ReportUS Real Estate Indicators Report
US Real Estate Indicators Report
 
Sprung Investment Management Commentary - 1st Quarter, 2019
Sprung Investment Management Commentary - 1st Quarter, 2019Sprung Investment Management Commentary - 1st Quarter, 2019
Sprung Investment Management Commentary - 1st Quarter, 2019
 
Investing in US core real estate
Investing in US core real estateInvesting in US core real estate
Investing in US core real estate
 

More from cutmytaxes

Commercial property tax appeal services
Commercial property tax appeal servicesCommercial property tax appeal services
Commercial property tax appeal servicescutmytaxes
 
Property Tax Strategy
Property Tax StrategyProperty Tax Strategy
Property Tax Strategycutmytaxes
 
2017 Final Tax Brochure
2017 Final Tax Brochure2017 Final Tax Brochure
2017 Final Tax Brochurecutmytaxes
 
ARB Protest Hearing Procedues - WallerCAD
ARB Protest Hearing Procedues - WallerCADARB Protest Hearing Procedues - WallerCAD
ARB Protest Hearing Procedues - WallerCADcutmytaxes
 
HFF Investment Overview
HFF Investment OverviewHFF Investment Overview
HFF Investment Overviewcutmytaxes
 
HCAD News Release - June 2017
HCAD News Release - June 2017HCAD News Release - June 2017
HCAD News Release - June 2017cutmytaxes
 
FY 2017-2018 State Tax Revenue
FY 2017-2018 State Tax RevenueFY 2017-2018 State Tax Revenue
FY 2017-2018 State Tax Revenuecutmytaxes
 
Notice of a Public Meeting Agenda - Harris County
Notice of a Public Meeting Agenda - Harris CountyNotice of a Public Meeting Agenda - Harris County
Notice of a Public Meeting Agenda - Harris Countycutmytaxes
 
Texas Economy Outlook 2017
Texas Economy Outlook 2017Texas Economy Outlook 2017
Texas Economy Outlook 2017cutmytaxes
 
May 2017 Rev - Tarrant County
May 2017 Rev - Tarrant CountyMay 2017 Rev - Tarrant County
May 2017 Rev - Tarrant Countycutmytaxes
 
Property Tax Appeals Real Property Petition and Instructions for Filing
Property Tax Appeals Real Property Petition and Instructions for FilingProperty Tax Appeals Real Property Petition and Instructions for Filing
Property Tax Appeals Real Property Petition and Instructions for Filingcutmytaxes
 
2017 Commercial Lending Trends Survey
2017 Commercial Lending Trends Survey2017 Commercial Lending Trends Survey
2017 Commercial Lending Trends Surveycutmytaxes
 
Tax Services For Private Capital
Tax Services For Private CapitalTax Services For Private Capital
Tax Services For Private Capitalcutmytaxes
 
HCAD News Release 2017
HCAD News Release 2017HCAD News Release 2017
HCAD News Release 2017cutmytaxes
 
Property Tax Bills 2017
Property Tax Bills 2017Property Tax Bills 2017
Property Tax Bills 2017cutmytaxes
 
Tarrant Tax Sale - 2017
Tarrant Tax Sale - 2017Tarrant Tax Sale - 2017
Tarrant Tax Sale - 2017cutmytaxes
 
Williamson CAD 2017 Protest Procedures
Williamson CAD 2017 Protest ProceduresWilliamson CAD 2017 Protest Procedures
Williamson CAD 2017 Protest Procedurescutmytaxes
 
Commercial Real Estate Market Trends - 2017
Commercial Real Estate Market Trends - 2017Commercial Real Estate Market Trends - 2017
Commercial Real Estate Market Trends - 2017cutmytaxes
 
Tax rates 2017
Tax rates 2017Tax rates 2017
Tax rates 2017cutmytaxes
 
Property Tax Deferral Disabled Senior Citizens
Property Tax Deferral Disabled Senior CitizensProperty Tax Deferral Disabled Senior Citizens
Property Tax Deferral Disabled Senior Citizenscutmytaxes
 

More from cutmytaxes (20)

Commercial property tax appeal services
Commercial property tax appeal servicesCommercial property tax appeal services
Commercial property tax appeal services
 
Property Tax Strategy
Property Tax StrategyProperty Tax Strategy
Property Tax Strategy
 
2017 Final Tax Brochure
2017 Final Tax Brochure2017 Final Tax Brochure
2017 Final Tax Brochure
 
ARB Protest Hearing Procedues - WallerCAD
ARB Protest Hearing Procedues - WallerCADARB Protest Hearing Procedues - WallerCAD
ARB Protest Hearing Procedues - WallerCAD
 
HFF Investment Overview
HFF Investment OverviewHFF Investment Overview
HFF Investment Overview
 
HCAD News Release - June 2017
HCAD News Release - June 2017HCAD News Release - June 2017
HCAD News Release - June 2017
 
FY 2017-2018 State Tax Revenue
FY 2017-2018 State Tax RevenueFY 2017-2018 State Tax Revenue
FY 2017-2018 State Tax Revenue
 
Notice of a Public Meeting Agenda - Harris County
Notice of a Public Meeting Agenda - Harris CountyNotice of a Public Meeting Agenda - Harris County
Notice of a Public Meeting Agenda - Harris County
 
Texas Economy Outlook 2017
Texas Economy Outlook 2017Texas Economy Outlook 2017
Texas Economy Outlook 2017
 
May 2017 Rev - Tarrant County
May 2017 Rev - Tarrant CountyMay 2017 Rev - Tarrant County
May 2017 Rev - Tarrant County
 
Property Tax Appeals Real Property Petition and Instructions for Filing
Property Tax Appeals Real Property Petition and Instructions for FilingProperty Tax Appeals Real Property Petition and Instructions for Filing
Property Tax Appeals Real Property Petition and Instructions for Filing
 
2017 Commercial Lending Trends Survey
2017 Commercial Lending Trends Survey2017 Commercial Lending Trends Survey
2017 Commercial Lending Trends Survey
 
Tax Services For Private Capital
Tax Services For Private CapitalTax Services For Private Capital
Tax Services For Private Capital
 
HCAD News Release 2017
HCAD News Release 2017HCAD News Release 2017
HCAD News Release 2017
 
Property Tax Bills 2017
Property Tax Bills 2017Property Tax Bills 2017
Property Tax Bills 2017
 
Tarrant Tax Sale - 2017
Tarrant Tax Sale - 2017Tarrant Tax Sale - 2017
Tarrant Tax Sale - 2017
 
Williamson CAD 2017 Protest Procedures
Williamson CAD 2017 Protest ProceduresWilliamson CAD 2017 Protest Procedures
Williamson CAD 2017 Protest Procedures
 
Commercial Real Estate Market Trends - 2017
Commercial Real Estate Market Trends - 2017Commercial Real Estate Market Trends - 2017
Commercial Real Estate Market Trends - 2017
 
Tax rates 2017
Tax rates 2017Tax rates 2017
Tax rates 2017
 
Property Tax Deferral Disabled Senior Citizens
Property Tax Deferral Disabled Senior CitizensProperty Tax Deferral Disabled Senior Citizens
Property Tax Deferral Disabled Senior Citizens
 

Recently uploaded

Call Girls In Vasant Vihar Delhi 💯Call Us 🔝8264348440🔝
Call Girls In Vasant Vihar Delhi 💯Call Us 🔝8264348440🔝Call Girls In Vasant Vihar Delhi 💯Call Us 🔝8264348440🔝
Call Girls In Vasant Vihar Delhi 💯Call Us 🔝8264348440🔝soniya singh
 
SVN Live 5.6.24 Weekly Property Broadcast
SVN Live 5.6.24 Weekly Property BroadcastSVN Live 5.6.24 Weekly Property Broadcast
SVN Live 5.6.24 Weekly Property BroadcastSVN International Corp.
 
Call Girls in Karkardooma Delhi +91 84487779280}Woman Seeking Man in Delhi NCR
Call Girls in Karkardooma Delhi +91 84487779280}Woman Seeking Man in Delhi NCRCall Girls in Karkardooma Delhi +91 84487779280}Woman Seeking Man in Delhi NCR
Call Girls in Karkardooma Delhi +91 84487779280}Woman Seeking Man in Delhi NCRasmaqueen5
 
Kolte Patil Kharadi Pune E Brochure.pdf
Kolte Patil Kharadi Pune E  Brochure.pdfKolte Patil Kharadi Pune E  Brochure.pdf
Kolte Patil Kharadi Pune E Brochure.pdfabbu831446
 
Call Girls in shastri nagar Delhi 8264348440 ✅ call girls ❤️
Call Girls in shastri nagar Delhi 8264348440 ✅ call girls ❤️Call Girls in shastri nagar Delhi 8264348440 ✅ call girls ❤️
Call Girls in shastri nagar Delhi 8264348440 ✅ call girls ❤️soniya singh
 
TENANT SCREENING REPORT SERVICES​ How Tenant Screening Reports Work
TENANT SCREENING REPORT SERVICES​ How Tenant Screening Reports WorkTENANT SCREENING REPORT SERVICES​ How Tenant Screening Reports Work
TENANT SCREENING REPORT SERVICES​ How Tenant Screening Reports WorkTurbo Tenant
 
Low Rate ↬Call Girls in Trilokpuri Delhi ↫8447779280}Escorts Service In Delhi
Low Rate ↬Call Girls in Trilokpuri Delhi ↫8447779280}Escorts Service In DelhiLow Rate ↬Call Girls in Trilokpuri Delhi ↫8447779280}Escorts Service In Delhi
Low Rate ↬Call Girls in Trilokpuri Delhi ↫8447779280}Escorts Service In Delhiasmaqueen5
 
3D Architectural Rendering Company by Panoram CGI
3D Architectural Rendering Company by Panoram CGI3D Architectural Rendering Company by Panoram CGI
3D Architectural Rendering Company by Panoram CGIPanoram CGI
 
Call Girls In Laxmi Nagar Delhi +91-8447779280! !Best Woman Seeking Man Escor...
Call Girls In Laxmi Nagar Delhi +91-8447779280! !Best Woman Seeking Man Escor...Call Girls In Laxmi Nagar Delhi +91-8447779280! !Best Woman Seeking Man Escor...
Call Girls In Laxmi Nagar Delhi +91-8447779280! !Best Woman Seeking Man Escor...asmaqueen5
 
2k Shot Call girls Aiims Delhi 9205541914
2k Shot Call girls Aiims Delhi 92055419142k Shot Call girls Aiims Delhi 9205541914
2k Shot Call girls Aiims Delhi 9205541914Delhi Call girls
 
Kohinoor Hinjewadi Phase 2 Pune E-Brochure.pdf
Kohinoor Hinjewadi Phase 2 Pune  E-Brochure.pdfKohinoor Hinjewadi Phase 2 Pune  E-Brochure.pdf
Kohinoor Hinjewadi Phase 2 Pune E-Brochure.pdfManishSaxena95
 
9990771857 Call Girls in Dwarka Sector 1 Delhi (Call Girls) Delhi
9990771857 Call Girls in Dwarka Sector 1 Delhi (Call Girls) Delhi9990771857 Call Girls in Dwarka Sector 1 Delhi (Call Girls) Delhi
9990771857 Call Girls in Dwarka Sector 1 Delhi (Call Girls) Delhidelhimodel235
 
Greater Vancouver Realtors Statistics Package April 2024
Greater Vancouver Realtors Statistics Package April 2024Greater Vancouver Realtors Statistics Package April 2024
Greater Vancouver Realtors Statistics Package April 2024VickyAulakh1
 
Premium Villa Projects in Sarjapur Road Bengaluru
Premium Villa Projects in Sarjapur Road BengaluruPremium Villa Projects in Sarjapur Road Bengaluru
Premium Villa Projects in Sarjapur Road BengaluruShivaSeo3
 
Purva Soukhyam in Guduvancheri Chennai.pdf
Purva Soukhyam in Guduvancheri Chennai.pdfPurva Soukhyam in Guduvancheri Chennai.pdf
Purva Soukhyam in Guduvancheri Chennai.pdfpritika141199
 
2k Shots ≽ 9205541914 ≼ Call Girls In Sainik Farm (Delhi)
2k Shots ≽ 9205541914 ≼ Call Girls In Sainik Farm (Delhi)2k Shots ≽ 9205541914 ≼ Call Girls In Sainik Farm (Delhi)
2k Shots ≽ 9205541914 ≼ Call Girls In Sainik Farm (Delhi)Delhi Call girls
 
Call Girls In Mayur Vihar Delhi ☆↫8447779280 ❤Escorts Service In Delhi
Call Girls In Mayur Vihar Delhi ☆↫8447779280 ❤Escorts Service In DelhiCall Girls In Mayur Vihar Delhi ☆↫8447779280 ❤Escorts Service In Delhi
Call Girls In Mayur Vihar Delhi ☆↫8447779280 ❤Escorts Service In Delhiasmaqueen5
 
9990771857 Call Girls in Dwarka Sector 6 Delhi (Call Girls) Delhi
9990771857 Call Girls in Dwarka Sector 6 Delhi (Call Girls) Delhi9990771857 Call Girls in Dwarka Sector 6 Delhi (Call Girls) Delhi
9990771857 Call Girls in Dwarka Sector 6 Delhi (Call Girls) Delhidelhimodel235
 
BDSM⚡Call Girls in Sector 57 Noida Escorts >༒8448380779 Escort Service
BDSM⚡Call Girls in Sector 57 Noida Escorts >༒8448380779 Escort ServiceBDSM⚡Call Girls in Sector 57 Noida Escorts >༒8448380779 Escort Service
BDSM⚡Call Girls in Sector 57 Noida Escorts >༒8448380779 Escort ServiceDelhi Call girls
 
Kohinoor Flats In Hinjewadi Phase 2 | Homes Built To Suit Your Needs
Kohinoor Flats In Hinjewadi Phase 2 | Homes Built To Suit Your NeedsKohinoor Flats In Hinjewadi Phase 2 | Homes Built To Suit Your Needs
Kohinoor Flats In Hinjewadi Phase 2 | Homes Built To Suit Your Needsaidasheikh47
 

Recently uploaded (20)

Call Girls In Vasant Vihar Delhi 💯Call Us 🔝8264348440🔝
Call Girls In Vasant Vihar Delhi 💯Call Us 🔝8264348440🔝Call Girls In Vasant Vihar Delhi 💯Call Us 🔝8264348440🔝
Call Girls In Vasant Vihar Delhi 💯Call Us 🔝8264348440🔝
 
SVN Live 5.6.24 Weekly Property Broadcast
SVN Live 5.6.24 Weekly Property BroadcastSVN Live 5.6.24 Weekly Property Broadcast
SVN Live 5.6.24 Weekly Property Broadcast
 
Call Girls in Karkardooma Delhi +91 84487779280}Woman Seeking Man in Delhi NCR
Call Girls in Karkardooma Delhi +91 84487779280}Woman Seeking Man in Delhi NCRCall Girls in Karkardooma Delhi +91 84487779280}Woman Seeking Man in Delhi NCR
Call Girls in Karkardooma Delhi +91 84487779280}Woman Seeking Man in Delhi NCR
 
Kolte Patil Kharadi Pune E Brochure.pdf
Kolte Patil Kharadi Pune E  Brochure.pdfKolte Patil Kharadi Pune E  Brochure.pdf
Kolte Patil Kharadi Pune E Brochure.pdf
 
Call Girls in shastri nagar Delhi 8264348440 ✅ call girls ❤️
Call Girls in shastri nagar Delhi 8264348440 ✅ call girls ❤️Call Girls in shastri nagar Delhi 8264348440 ✅ call girls ❤️
Call Girls in shastri nagar Delhi 8264348440 ✅ call girls ❤️
 
TENANT SCREENING REPORT SERVICES​ How Tenant Screening Reports Work
TENANT SCREENING REPORT SERVICES​ How Tenant Screening Reports WorkTENANT SCREENING REPORT SERVICES​ How Tenant Screening Reports Work
TENANT SCREENING REPORT SERVICES​ How Tenant Screening Reports Work
 
Low Rate ↬Call Girls in Trilokpuri Delhi ↫8447779280}Escorts Service In Delhi
Low Rate ↬Call Girls in Trilokpuri Delhi ↫8447779280}Escorts Service In DelhiLow Rate ↬Call Girls in Trilokpuri Delhi ↫8447779280}Escorts Service In Delhi
Low Rate ↬Call Girls in Trilokpuri Delhi ↫8447779280}Escorts Service In Delhi
 
3D Architectural Rendering Company by Panoram CGI
3D Architectural Rendering Company by Panoram CGI3D Architectural Rendering Company by Panoram CGI
3D Architectural Rendering Company by Panoram CGI
 
Call Girls In Laxmi Nagar Delhi +91-8447779280! !Best Woman Seeking Man Escor...
Call Girls In Laxmi Nagar Delhi +91-8447779280! !Best Woman Seeking Man Escor...Call Girls In Laxmi Nagar Delhi +91-8447779280! !Best Woman Seeking Man Escor...
Call Girls In Laxmi Nagar Delhi +91-8447779280! !Best Woman Seeking Man Escor...
 
2k Shot Call girls Aiims Delhi 9205541914
2k Shot Call girls Aiims Delhi 92055419142k Shot Call girls Aiims Delhi 9205541914
2k Shot Call girls Aiims Delhi 9205541914
 
Kohinoor Hinjewadi Phase 2 Pune E-Brochure.pdf
Kohinoor Hinjewadi Phase 2 Pune  E-Brochure.pdfKohinoor Hinjewadi Phase 2 Pune  E-Brochure.pdf
Kohinoor Hinjewadi Phase 2 Pune E-Brochure.pdf
 
9990771857 Call Girls in Dwarka Sector 1 Delhi (Call Girls) Delhi
9990771857 Call Girls in Dwarka Sector 1 Delhi (Call Girls) Delhi9990771857 Call Girls in Dwarka Sector 1 Delhi (Call Girls) Delhi
9990771857 Call Girls in Dwarka Sector 1 Delhi (Call Girls) Delhi
 
Greater Vancouver Realtors Statistics Package April 2024
Greater Vancouver Realtors Statistics Package April 2024Greater Vancouver Realtors Statistics Package April 2024
Greater Vancouver Realtors Statistics Package April 2024
 
Premium Villa Projects in Sarjapur Road Bengaluru
Premium Villa Projects in Sarjapur Road BengaluruPremium Villa Projects in Sarjapur Road Bengaluru
Premium Villa Projects in Sarjapur Road Bengaluru
 
Purva Soukhyam in Guduvancheri Chennai.pdf
Purva Soukhyam in Guduvancheri Chennai.pdfPurva Soukhyam in Guduvancheri Chennai.pdf
Purva Soukhyam in Guduvancheri Chennai.pdf
 
2k Shots ≽ 9205541914 ≼ Call Girls In Sainik Farm (Delhi)
2k Shots ≽ 9205541914 ≼ Call Girls In Sainik Farm (Delhi)2k Shots ≽ 9205541914 ≼ Call Girls In Sainik Farm (Delhi)
2k Shots ≽ 9205541914 ≼ Call Girls In Sainik Farm (Delhi)
 
Call Girls In Mayur Vihar Delhi ☆↫8447779280 ❤Escorts Service In Delhi
Call Girls In Mayur Vihar Delhi ☆↫8447779280 ❤Escorts Service In DelhiCall Girls In Mayur Vihar Delhi ☆↫8447779280 ❤Escorts Service In Delhi
Call Girls In Mayur Vihar Delhi ☆↫8447779280 ❤Escorts Service In Delhi
 
9990771857 Call Girls in Dwarka Sector 6 Delhi (Call Girls) Delhi
9990771857 Call Girls in Dwarka Sector 6 Delhi (Call Girls) Delhi9990771857 Call Girls in Dwarka Sector 6 Delhi (Call Girls) Delhi
9990771857 Call Girls in Dwarka Sector 6 Delhi (Call Girls) Delhi
 
BDSM⚡Call Girls in Sector 57 Noida Escorts >༒8448380779 Escort Service
BDSM⚡Call Girls in Sector 57 Noida Escorts >༒8448380779 Escort ServiceBDSM⚡Call Girls in Sector 57 Noida Escorts >༒8448380779 Escort Service
BDSM⚡Call Girls in Sector 57 Noida Escorts >༒8448380779 Escort Service
 
Kohinoor Flats In Hinjewadi Phase 2 | Homes Built To Suit Your Needs
Kohinoor Flats In Hinjewadi Phase 2 | Homes Built To Suit Your NeedsKohinoor Flats In Hinjewadi Phase 2 | Homes Built To Suit Your Needs
Kohinoor Flats In Hinjewadi Phase 2 | Homes Built To Suit Your Needs
 

Commercial realestate market overview 2016

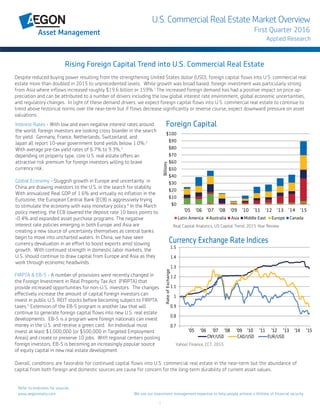
  • 1. 1 Rising Foreign Capital Trend into U.S. Commercial Real Estate Interest Rates - With low and even negative interest rates around the world, foreign investors are looking cross boarder in the search for yield. Germany, France, Netherlands, Switzerland, and Japan all report 10-year government bond yields below 1.0%.2 With average pre-tax yield rates of 6.7% to 9.3%,3 depending on property type, core U.S. real estate offers an attractive risk premium for foreign investors willing to brave currency risk. Global Economy - Sluggish growth in Europe and uncertainty in China are drawing investors to the U.S. in the search for stability. With annualized Real GDP of 1.6% and virtually no inflation in the Eurozone, the European Central Bank (ECB) is aggressively trying to stimulate the economy with easy monetary policy.4 In the March policy meeting, the ECB lowered the deposit rate 10 basis points to -0.4% and expanded asset purchase programs. The negative interest rate policies emerging in both Europe and Asia are creating a new source of uncertainty themselves as central banks begin to move into uncharted waters. In China, we have seen currency devaluation in an effort to boost exports amid slowing growth. With continued strength in domestic labor markets, the U.S. should continue to draw capital from Europe and Asia as they work through economic headwinds. Despite reduced buying power resulting from the strengthening United States dollar (USD), foreign capital flows into U.S. commercial real estate more than doubled in 2015 to unprecedented levels. While growth was broad based, foreign investment was particularly strong from Asia where inflows increased roughly $19.6 billion or 159%.1 The increased foreign demand has had a positive impact on price ap- preciation and can be attributed to a number of drivers including the low global interest rate environment, global economic uncertainties, and regulatory changes. In light of these demand drivers, we expect foreign capital flows into U.S. commercial real estate to continue to trend above historical norms over the near-term but if flows decrease significantly or reverse course, expect downward pressure on asset valuations. FIRPTA & EB-5 - A number of provisions were recently changed in the Foreign Investment in Real Property Tax Act (FIRPTA) that provide increased opportunities for non-U.S. investors. The changes effectively increase the amount of capital foreign investors can invest in public U.S. REIT stocks before becoming subject to FIRPTA taxes.5 Extension of the EB-5 program is another law that will continue to generate foreign capital flows into new U.S. real estate developments. EB-5 is a program were foreign nationals can invest money in the U.S. and receive a green card. An Individual must invest at least $1,000,000 (or $500,000 in Targeted Employment Areas) and create or preserve 10 jobs. With regional centers pooling foreign investors, EB-5 is becoming an increasingly popular source of equity capital in new real estate development. Real Capital Analytics, US Capital Trend, 2015 Year Review Yahoo! Finance, CCT, 2015 U.S. Commercial Real Estate Market Overview First Quarter 2016 Applied Research Refer to endnotes for sources www.aegonrealty.com We use our investment management expertise to help people achieve a lifetime of financial security Overall, conditions are favorable for continued capital flows into U.S. commercial real estate in the near-term but the abundance of capital from both foreign and domestic sources are cause for concern for the long-term durability of current asset values. $0 $10 $20 $30 $40 $50 $60 $70 $80 $90 $100 '05 '06 '07 '08 '09 '10 '11 '12 '13 '14 '15 Billions Foreign Capital Latin America Australia Asia Middle East Europe Canada 0.7 0.8 0.9 1 1.1 1.2 1.3 1.4 1.5 RateofExchange Currency Exchange Rate Indices CNY/USD CAD/USD EUR/USD '05 '06 '07 '08 '09 '10 '11 '12 '13 '14 '15
  • 2. 2 Annual Data, CoStar Portfolio Strategy, 2015 Q4 CoStar Portfolio Strategy, 2015 Q4 *Leaders have a favorable vacancy trend and rent growth of 3% or higher. **Laggards have an unfavorable vacancy trend and rent growth of 0% or lower. Top And Bottom Trending Markets (Year Over Year) Vacancy Rent ($/Unit) Leaders* 14Q4 15Q4 CHANGE 14Q4 15Q4 CHANGE Tampa 4.8% 3.6% -1.2% $952 $1026 7.8% Las Vegas 5.9% 4.8% -1.1% $786 $ 842 7.2% Indianapolis 7.1% 6.2% -0.9% $753 $ 788 4.7% Jacksonville 5.3% 4.5% -0.8% $852 $ 915 7.5% San Antonio 6.5% 5.7% -0.8% $862 $ 908 5.3% Laggards** All national markets experienced positive rent growth   MSA Count Based on Vacancy Favorable Vacancy Trend: 28 Unfavorable Vacancy Trend: 25 Neutral Vacancy Trend: 1 Total MSAs: 54 MSA Count Based on Rent Rent Growth Above 0%: 54 Rent Growth Below 0%: 0 Neutral Rent: 0 Total MSAs: 54        APARTMENT Apartment vacancy was 3.9% in 2015 Q4, down from 4.0% a year ago.6 Apartment cap rates decreased 30 bps to 5.8% from 6.1% a year ago.7 Sales volume for apartment properties in the fourth quarter totaled $50.5 billion, up 43.3% from a year ago.7 Apartment prices increased 12.9% from a year ago, and were 37.5% above the 2007 peak.8 “In most years, transaction volume for the office sector is ahead of that for the apartment sector but more capital was invested in the apartment sector than any other in 2015. In many sectors, strong growth in portfolio sales and entity level deals provided the lift to volume for 2015. For the apartment sector however, growth in the sale of individual assets was still strong, up 28.0% yoy. Deal volume grew in 2015 even as prices continued to rise. Initial estimates of the Moody’s/RCA CPPITM suggest that prices increased 13.0% yoy. This growth is not bad, but it is the weakest year of price growth since 2010.”18 *Effective Apartment Rent- The actual rent after deducting the value of concessions from the base rental rate paid by tenant.  0% 4% 8% 12% 16% -100 0 100 200 300 '94 '97 '00 '03 '06 '09 '12 '15 VacancyRate ThousandUnits Apartment Market Completion Net Absorption Vacancy Rate U.S. Commercial Real Estate Market Overview First Quarter 2016 Applied Research www.aegonrealty.com We use our investment management expertise to help people achieve a lifetime of financial security -6% -4% -2% 0% 2% 4% 6% 8% '01 '02 '03 '04 '05 '06 '07 '08 '09 '10 '11 '12 '13 '14 '15 Year-over-yeargrowth Effective Apartment Rent
  • 3. 3 CoStar Portfolio Strategy, 2015 Q4 *Leaders have a favorable vacancy trend and rent growth of 3% or higher. **Laggards have an unfavorable vacancy trend and rent growth of 0% or lower. Annual Data, CoStar Portfolio Strategy, 2015 Q4 OFFICE The office vacancy rate dropped to 10.8% in 2015 Q4 from 11.3% a year ago.6 Transaction volume was $39 billion in 2015 Q4, down 2.0% from a year ago. Cap rates fell in both CBD and Suburban locales in Q4. In the suburbs, the decline was 16 bps from a year earlier with a 7.0% national average while CBD office cap rates compressed 14 bps to 5.8%.7 Office prices are 18.7% above the 2007 peak. CBD office prices are up 16.6% from a year ago, while suburban prices are up only 9.0%.8 “The breadth of the U.S. office market is one of its greatest strengths. Having options provides value. Secondary office markets are experiencing higher levels of investment for just this reason, somewhat greater volatility priced by higher yields, and the ability to accommodate fast- growing companies with a volume of new construction at costs much lower than that available in the primary downtowns. Interviewees spoke of “pocket markets,” conversions and redevelopments, and opportunities to reposition struggling suburban office parks with vast parking into more effective mixed use.”10 Top And Bottom Trending Markets (Year Over Year) Vacancy Rent ($/Unit) Leaders* 14Q4 15Q4 CHANGE 14Q34 15Q4 CHANGE San Jose 10.0% 7.1% -2.9% $34.70 $38.40 10.8% East Bay 10.7% 8.6% -2.1% $24.20 $26.50 9.4%  Miami 11.9% 10.0% -1.9% $29.00 $30.40 4.9% Atlanta 13.9% 12.2% -1.7% $18.60 $19.60 5.7% Nashville 6.9% 5.3% -1.6% $20.10 $21.60 7.8% Laggards** There were 0 out of 54 MSAs with both unfavorable vacancy trends and negative rent growth.   MSA Count Based on Vacancy Favorable Vacancy Trend: 44 Unfavorable Vacancy Trend: 7 Neutral Vacancy Trend: 3 Total MSAs: 54 MSA Count Based on Rent Rent Growth Above 0%: 52 Rent Growth Below 0%: 2 Neutral Rent: 0 Total MSAs: 54   0% 4% 8% 12% 16% -75 0 75 150 225 '88 '91 '94 '97 '00 '03 '06 '09 '12 '15 VacancyRate MillionSquareFeet Office Market Completion Net Absorption Vacancy Rate U.S. Commercial Real Estate Market Overview First Quarter 2016 Applied Research www.aegonrealty.com We use our investment management expertise to help people achieve a lifetime of financial security -10% -8% -6% -4% -2% 0% 2% 4% 6% 8% 10% 12% '01 '02 '03 '04 '05 '06 '07 '08 '09 '10 '11 '12 '13 '14 '15 Year-over-yeargrowth Office Asking Rent     
  • 4. 4 INDUSTRIAL The industrial vacancy rate dropped to 5.9% in 2015 Q4 from 6.5% a year ago.6 Transaction volume was $25.7 billion in 2015 Q4, up 66.0% from a year ago. Cap rates fell 30 bps from last year to 6.7%.7 Industrial property prices are up 6.9% from a year ago, and are 2.8% above the 2007 peak.8 “As it did last year, warehouse industrial ranks as the top pick among investors with regard to investment prospects in the year ahead, according to Emerging Trends in Real Estate® 2016, published by PwC and ULI. Specifically, industrial/ distribution scored a 3.63 on a scale of 1 (abysmal) to 5 (excellent), just above multifamily with a score of 3.50 and office with a score of 3.43. The results of this year’s Emerging Trends report also awarded the industrial sector its highest score since 2004. Looking ahead, all Survey participants see values rising in this market over the next 12 months. The highest expected value increase is 10.0% – the average increase is 3.3%.” 9 Annual Data, CoStar Portfolio Strategy, 2015 Q4 CoStar Portfolio Strategy, 2015 Q4 *Leaders have a favorable vacancy trend and rent growth of 3% or higher. **Laggards have an unfavorable vacancy trend and rent growth of 0% or lower. Top And Bottom Trending Markets (Year Over Year) Vacancy Rent ($/Unit) Leaders* 14Q4 15Q4 CHANGE 14Q4 15Q4 CHANGE Austin 8.2% 5.6% -2.6% $7.50 $ 8.10 8.9% Memphis 12.6% 10.2% -2.4% $2.80 $ 2.90 3.2% Las Vegas 8.2% 5.9% -2.3% $5.80 $ 6.30 8.6% Raleigh 7.2% 4.9% -2.3% $5.00 $ 5.30 6.5% San Diego 5.7% 3.8% -1.9% $9.80 $10.30 5.3% Laggards** All national markets experienced positive rent growth   MSA Count Based on Vacancy Favorable Vacancy Trend: 45 Unfavorable Vacancy Trend: 7 Neutral Vacancy Trend: 2 Total MSAs: 54 MSA Count Based on Rent Rent Growth Above 0%: 53 Rent Growth Below 0%: 0 Neutral Rent: 1 Total MSAs: 54 0% 4% 8% 12% 16% -100 0 100 200 300 '82 '85 '88 '91 '94 '97 '00 '03 '06 '09 '12 '15 VacancyRate MillionSquareFeet Industrial Market Completion Net Absorption Vacancy Rate U.S. Commercial Real Estate Market Overview First Quarter 2016 Applied Research www.aegonrealty.com We use our investment management expertise to help people achieve a lifetime of financial security         -8% -6% -4% -2% 0% 2% 4% 6% 8% 10% '01 '02 '03 '04 '05 '06 '07 '08 '09 '10 '11 '12 '13 '14 '15 Year-over-yeargrowth Industrial Asking Rent
  • 5. 5 Annual Data, CoStar Portfolio Strategy, 2015 Q4 CoStar Portfolio Strategy, 2015 Q4 *Leaders have a favorable vacancy trend and rent growth of 3% or higher. **Laggards have an unfavorable vacancy trend and rent growth of 0% or lower. RETAIL Retail vacancy decreased to 5.8% in 2015 Q4, down from 6.1% a year ago.6 Cap rates for the retail sector fell 20 bps from a year earlier to 6.4% in Q4. Total sales volume for Q4 was $21.3 billion, down 16.0% from a year earlier.7 Retail property prices increased 12.6% from a year ago, but are 2.4% below the 2007 peak.8 “Little movement in the vacancy rate for U.S. regional malls and the ambiguity of U.S. interest rate increases have some investors feeling uneasy about investing in this property type. The trepidation felt by some investors with regard to regional mall investing is noted in this market’s average initial-year market rent change rate assumption, which slips 20 basis points this quarter and represents the first quarterly drop for this key indicator in the past year. Moreover, in Emerging Trends in Real Estate® 2016, published by PwC and ULI, regional malls placed last among the 16 commercial/multifamily subsectors included in the report with regard to both investment and develop- ment prospects for the year ahead.” 9 Top And Bottom Trending Markets (Year Over Year) Vacancy Rent ($/Unit) Leaders* 14Q4 15Q4 CHANGE 14Q4 15Q4 CHANGE Austin 4.8% 3.8% -1.0%  $18.00 $19.37 7.6% Palm Beach County 6.3% 5.5% -0.8%  $18.19 $19.47 7.0% Orlando 6.6% 5.9% -0.7%  $14.84 $15.51 4.5% Phoenix 10.1% 9.5% -0.6%  $13.90 $14.37 3.4% Raleigh 5.1% 4.5% -0.6%  $14.91 $15.98 7.2% Laggards** Philadelphia 6.0% 6.3% 0.3% $15.6 $15.6 -0.3% MSA Count Based on Vacancy Favorable Vacancy Trend: 39 Unfavorable Vacancy Trend: 6 Neutral Vacancy Trend: 9 Total MSAs: 54 MSA Count Based on Rent Rent Growth Above 0%: 40 Rent Growth Below 0%: 14 Neutral Rent: 0 Total MSAs: 54        0% 4% 8% 12% 16% 0 50 100 150 200 '90 '95 '00 '05 '10 '15 VacancyRate MillionSquareFeet Retail Market Completion Net Absorption Vacancy Rate U.S. Commercial Real Estate Market Overview First Quarter 2016 Applied Research www.aegonrealty.com We use our investment management expertise to help people achieve a lifetime of financial security -8% -6% -4% -2% 0% 2% 4% 6% 8% '01 '02 '03 '04 '05 '06 '07 '08 '09 '10 '11 '12 '13 '14 '15 Year-over-yeargrowth Retail Asking Rent
  • 6. 60-DAY DELINQUENCY RATES Dec-13 Dec-14 Dec-15 Office 7.8% 5.6% 5.4% Industrial 9.8% 7.1% 5.2% Retail 5.7% 5.3% 5.4% Apartment 5.1% 3.7% 2.6% Lodging 7.2% 4.2% 2.6% Total 6.3% 4.7% 4.0% HIGHEST AND LOWEST DELINQUENCY RATES by MSA ($ Balance in millions, includes Apartment, Retail, Industrial, and Office, top 50 MSAs, Trepp downloaded November 2015) Highest Delinquent Balance 60+ Days Lowest Delinquent Balance 60+Days Providence, RI $147 10.0% San Jose, CA $0 0.0% Cleveland, OH $287 10.0% Portland, OR $5 0.1% Jacksonville, FL $286 9.9% New Orleans, LA $3 0.2% Richmond, VA $203 8.9% Salt Lake City, UT $9 0.4% Buffalo, NY $101 8.8% Austin, TX $40 0.6% Pittsburgh, PA $217 7.9% Houston, TX $167 1.0% Las Vegas, NV $465 6.8% Louisville, KY $20 1.0% Detroit, MI $392 6.6% San Antonio, TX $47 1.1% Raleigh, NC $161 5.7% San Francisco, CA $112 1.3% Birmingham, AL $100 5.6% Seattle, WA $114 1.4% 6 CMBS DELINQUENCY The percentage of loans seriously delinquent* was 3.97% in December 201511 , down from 4.7% a year ago. The percentage of loans seriously delinquent peaked at 9.2% in July 2012. The retail sector was the most improved sector in December, increased 0.09% from a year ago. The other four sectors all decreased, with industrial declining 1.9%, lodging declining 1.6%, apartment declining 1.1% and office declining 0.3%. * Loan 60+ days delinquent, in foreclosure, REO, or non-performing 1 Seriously delinquent percentage may not match Trepp’s monthly report. Trepp, December, 2015 0% 5% 10% 15% 20% '00 '01 '02 '03 '04 '05 '07 '08 '09 '10 '11 '12 '14 '15 CMBS Delinquency Rates 60 Days Delinquent Including Non-Performing Balances Apartment Industrial Office Retail Lodging Recessions U.S. Commercial Real Estate Market Overview First Quarter 2016 Applied Research www.aegonrealty.com We use our investment management expertise to help people achieve a lifetime of financial security
  • 7. CAP RATES (RERC) 2012 Q4 2013 Q4 2014 Q4 2015 Q4 Office 6.1% 5.8% 5.6% 5.4% Industrial 6.6% 6.4% 6.0% 6.0% Apartment 5.4% 5.2% 5.0% 4.8% Retail 6.6% 6.7% 6.2% 5.9% 7 TRANSACTION VOLUME Sales of commercial real estate totaled $157 billion in 2015 Q4, up 19.5% from a year ago. The industrial sector was the most improved, recording a 66.0% year- over-year increase in sales volume. The retail (-16.0%) and office (-2.0%) sectors recorded volume decreased, while the apartment properties (+43.3%) saw an increase in volume. CAP RATES Cap rates continued to fall in Q4 across all property types except Industrial which remained the same from a year ago. The retail sector had the most cap rate compression, declining 30 basis points from a year ago. Real Capital Analytics, 2015 Q4 Situs RERC, 2015 Q4 Number of Properties sold 2006 Q4 (Peak) 2009 Q1 (Trough) 2015 Q4 Office 1,577 261 1,482 Industrial 1,416 275 2,537 Apartment 1,825 376 2,066 Retail 1,903 351 1,795 U.S. Commercial Real Estate Market Overview First Quarter 2016 Applied Research www.aegonrealty.com We use our investment management expertise to help people achieve a lifetime of financial security $(40) $(20) $- $20 $40 $60 $80 $100 $120 $140 $160 '01 '05 '10 '15 Billions Commercial Real Estate Transaction Volume All Property Types - Quarterly Average Transaction Size Millions $16 m $22 m $8.6 m $20 bn $158 bn $115 bn $17.6 m $14 bn $16 m $22 m $20 bn $158 bn $115 bn $20 $0 4.5% 6.5% 8.5% 10.5% '94 '97 '00 '03 '06 '09 '12 '15 Apartment Industrial Office Retail Commercial Real Estate Cap Rates Quarterly Recessions
  • 8. 0.7 0.8 0.9 1.0 1.1 1.2 1.3 1.4 '00 '01 '02 '03 '04 '05 '06 '07 '08 '09 '10 '11 '12 '13 '14 '15 Rent Index Apartment Industrial Office Retail Recessions 8 NCREIF The trailing one-year return for the NCREIF property index (NPI) increased to 13.5% in Q4 2015. The NPI is a measure of unlevered private equity returns as determined through application of an appraisal-based exit price. December 1, 2015 RENTS Rent levels in the fourth quarter rose modestly across all property types. The Apartment sector reported the highest growth in 2015 Q4, with effective rents 6.0% higher than a year ago. Annual rates (appreciation + income) NCREIF, 2015 Q4 CoStar Portfolio Strategy, 2015 Q4 Industrial +5.9% Office +4.4% Retail +2.1% Apartment +6.0% Rent Index From a Year Ago U.S. Commercial Real Estate Market Overview First Quarter 2016 Applied Research www.aegonrealty.com We use our investment management expertise to help people achieve a lifetime of financial security -30% -20% -10% 0% 10% 20% 30% '78 '80 '82 '84 '86 '88 '90 '92 '94 '96 '98 '00 '02 '04 '06 '08 '10 '12 '14 '15 NCREIF Property Index (NPI) Apartment Industrial Office Retail Recessions * Industrial, Office and Retail industry are using Asking rent as a standard for rent index. * Apartment industry is using Effective rent as a standard for rent index.
  • 9. 9 RETAIL SALES Nonstore retail (primarily internet sales) were $125 billion in the fourth quarter of 2015, up 6.8% from a year ago. Retail sales, excluding nonstore, were $1.3 trillion in the fourth quarter, up 2.0% from a year ago. Comparing retail sales categories, gasoline stations declined the most from a year ago (-18.5%). Electronics and appliance stores also declined (-4.5%). Food services and drinking places (+6.7%) and Motor Vehicle and Parts Dealers (+6.0%) in- creased from a year ago. U.S. Census Bureau, December, 2015 CoStar Portfolio Strategy, 2015 Q4 NONSTORE SHARE OF RETAIL Nonstore (Billions) % Of All Retail Sales 2000Q4 $48 5.8% 2005Q4 $67 6.5% 2010Q4 $88 8.0% 2015Q4 $125 9.3% CONSUMER CONFIDENCE The Consumer Confidence Index now stands at 92.2, down 5.9 points from January 2016. The Consumer Sentiment Index was 91.7 in February, down from the final January read of 92.0. “Consumer confidence slumped in February as households grew more concerned about the out- look for the economy and job. Americans said they believed the high-flying job market wouldn’t get much better as they turned the most pessimistic about the outlook for stock prices in more than three years. While buying plans for automobiles held up, households said they were less likely to buy homes or major appliances, raising concern about the strength of consumer spending, the biggest part of the economy.”12 Reuters/University of Michigan Consumer Sentiment Index, 26 February, 2016 The Conference Board Consumer Confidence Index, 23 February, 2016 U.S. Commercial Real Estate Market Overview First Quarter 2016 Applied Research www.aegonrealty.com We use our investment management expertise to help people achieve a lifetime of financial security $60 $70 $80 $90 '95 '00 '05 '10 '15 Retail Sales Quarterly, Inflation Adjusted Sales/SF (ex nonstore sales) Sales/SF (including nonstore sales) Recession 0 50 100 150 '00 '01 '02 '03 '04 '05 '06 '07 '08 '09 '10 '11 '12 '13 '14 '15 '16 Consumer Confidence Consumer Confidence Consumer Sentiment Recessions February 2016 : 92.2 : 91.7
  • 10. 10 U.S. Census Bureau, February 1, 2016 CONSTRUCTION SPENDING The annualized rate for residential construction spending in December was $429.6 billion, up 23.0% from a year ago and 36.0% lower than the 2006 peak. The annualized rate for non-residential construc- tion spending in December was $394.4 billion, up 11.0% from a year ago but 5.0% lower than the 2008 peak. “U.S. construction spending barely rose in December as spending on nonresidential structures recorded its biggest drop since 2013, suggesting a mild downward revision to the advance fourth-quarter GDP growth estimate. Economists polled by Reuters had forecast construction spending rising 0.6 percent in December after a previously reported 0.4 percent drop in November. ”15 USDA, Ag Land Values and Cash Rents Annual Summary, January 2016 International Monetary Fund, Primary Commodity Price Index, January 2016 COMMODITY PRICES The IMF Commodity Index is 58.0% below the July 2008 peak. For 2015 Q4, Crude Oil (-40.0%) and Energy (-39.3%) declined from a year ago.13 Commodity prices fell 7.1 percent in December, extending losses to seven months, led by a sharp decline in oil prices. Non-fuel prices fell 0.2 percent, and in part reflect appreciation of the U.S. dollar. During 2015 (Dec’14-Dec’15), commodity prices fell 30.7 percent with energy dropping 39.3 percent and non fuel prices falling 19.1 percent.14 0 1 2 3 4 5 '93 '95 '97 '99 '01 '03 '05 '07 '09 '11 '13 '15 US Farm Value and Commodity Prices (Values Indexed, 1992=1) Commodity Index (IMF) Farm Value (Last Update August 2015) $0 $200 $400 $600 $800 '96 '97 '98 '99 '00 '01 '02 '03 '04 '05 '06 '07 '08 '09 '10 '11 '12 '13 '14 '15 Billions Private Construction Spending Residential Non-Residential Recession U.S. Commercial Real Estate Market Overview First Quarter 2016 Applied Research www.aegonrealty.com We use our investment management expertise to help people achieve a lifetime of financial security
  • 11. ORIGINATIONS BY PROPERTY TYPE 2013 Q4 2014 Q4 2015 Q4 Office 9.4% 8.0% 7.9% Industrial 4.6% 4.8% 9.4% Apartment 42.8% 49.5% 48.9% Retail 10.3% 10.0% 9.7% Other* 32.9% 27.8% 24.2% ORIGINATIONS BY INVESTOR CLASS 2013 2014 2015 Life Cos 23.0% 18.7% 18.7% GSEs 16.0% 30.0% 25.7% Comm Bank 32.6% 25.8% 33.6% Conduits 28.4% 25.6% 22.0% LIFE Cos ORIGINATIONS (Billions) 2006 Q4 $7.1 2007 Q4 $6.0 2008 Q4 $1.6 2009 Q4 $3.4 2010 Q4 $9.2 2011 Q4 $8.0 2012 Q4 $9.4 2013 Q4 $13.2 2014 Q4 $14.2 2015 Q4 $16.9 0 250 500 750 '04 '05 '06 '07 '08 '09 '10 '11 '12 '13 '14 '15 Commercial Loan Originations Life Insurance GSE's (Fannie/Freddie) Commercial Banks CMBS/Conduits Recession $0 $2 $4 $6 $8 $10 $12 $14 $16 $18 '03 '04 '05 '06 '07 '08 '09 '10 '11 '12 '13 '14 '15 Billions Life Company Loan Originations Life Insurance Company's 4Q Trailing Recession 11 ORIGINATIONS Mortgage Bankers Association Quarterly Survey of Commercial/Multi- family Mortgage Bankers Originations, 2015 Q4 Mortgage Bankers Association Quarterly Survey of Commercial/Multifamily Mortgage Bankers Originations, 2015 Q4 “Fourth quarter 2015 commercial and multifamily mortgage originations were 35 percent higher than in the third quarter and 19 percent higher than fourth quarter of 2014. The fourth quarter was the fourth highest quarter for borrowing and lending on record. Banks, life insurance companies, and Fannie Mae and Freddie Mac saw their highest originations volumes on record. Of the major investor groups, only the CMBS market didn’t break a record for originations. In terms of overall borrowing and lending volumes, 2015 as a whole was likely second only to 2007.”16 *Other includes hotel and health care U.S. Commercial Real Estate Market Overview First Quarter 2016 Applied Research www.aegonrealty.com We use our investment management expertise to help people achieve a lifetime of financial security
  • 12. 12 EMPLOYMENT The February unemployment rate was 4.9%, down from 5.5% a year ago. Significant payroll increases from a year ago include construction (+3.8%), professional services (+3.1%), and leisure and hospitality (+3.0%). Mining and Logging is the only sector that decreased payroll (-16.1%). All sectors experienced payroll increases since the 2010 trough. The job sectors with the highest increases include construction (+20.6%) and administrative service (+21.0%). Total nonfarm employment has increased 10.7% since 2010. Bureau of Labor Statistics, Employment Situation, March 4, 2016 Employment figures reflect private and government non-farm jobs REPEAT SALES INDICES The Commercial Property Price Index reported by RCA is up 13.0% in December from a year ago and up 17.0% from the 2007 peak. The U.S. Investment Grade segment increased 10.5% over the past 12 months. The U.S. General Commercial Index increased 9.1% in December from a year ago.17 “Improving CRE fundamentals, surging investor demand and liquid capital markets propelled the CCRSI composite indices upward in 2015. Demand for core property assets was especially strong. The value-weighted U.S. Composite Index rose 12.5% in 2015 to an all-time high that is 19.1% above its prerecession peak.”17 “Among key drivers of the price recovery were the increased availability and decreased cost of debt and equity capi- tal, capitalization rate compression, improving property fundamentals and a declining share of distressed trans- Real Capital Analytics/Moody’s Investor Service, January 2016 CoStar Commercial Repeat-Sale Indices, January 2016. The difference between the RCA Index and the CoStar Indices is primarily the methodology weighting repeat sales, not the data sources. Commercial Property Price Index (Moody’s/RCA) - Index is based on property sales over $2.5 million. U.S. Investment Grade (CoStar) - This Index includes Class A and B offices with 35,000 SF or more, industrial properties with 80,000 SF or more, flex properties with 55,000 SF or more, retail properties with 25,000 SF or more, multifamily properties with 90,000 SF or more, and hotels with 125,000 SF or more. U.S. General Commercial (CoStar) - Only includes properties not meeting the Investment Grade criteria. 0.5 0.6 0.7 0.8 0.9 1.0 1.1 1.2 '08 '09 '10 '11 '12 '13 '14 '15 Price Based on Repeat Sales Indices Commercial Property Price Index (RCA) U.S. Investment Grade (CoStar) U.S. General Commercial (CoStar) U.S. Commercial Real Estate Market Overview First Quarter 2016 Applied Research www.aegonrealty.com We use our investment management expertise to help people achieve a lifetime of financial security 2% 4% 6% 8% 10% 12% -900 -600 -300 0 300 600 '00 '01 '02 '03 '04 '05 '06 '07 '08 '09 '10 '11 '12 '13 '14 '15 '16 UnemploymentRate PayrollEmploymentM/MChange Employment Situation Payroll Change Unemployment Rate February 2016 : 242,000 : 4.9% Recessions Thousands
  • 13. 13 ADDITIONAL OBSERVATIONS Prepared by Aegon USA Realty Advisors Applied Research Group Don Guarino, MAI, CRE, CCIM, FRICS dguarino@aegonusa.com Brad Bohl brbohl@aegonusa.com Felicia Gan, Neil Zhang ENDNOTES 1 Real Capital Analytics, U.S. Capital Trend-Big Picture, 2015 Year in Review 2 Bloomberg Business, Rates & Bonds, 2016 3 Real Estate Research Corporation (RERC), 2015 Q4 4 European Central Bank, Statisics, Key Euro Area Indicators, March 2016 5 PricewaterhouseCoopers (PWC), Real Estate Tax Alert, February 2015 6 CoStar Portfolio Strategy, 2015Q4 7 Real Capital Analytics, 2015Q4 8 Moody CPPI Report, February 2016 9 PricewaterhouseCoopers (PWC), Real Estate Survey, 2015 Q4 10 PricewaterhouseCoopers (PWC), Emerging Trend in Real Estate, 2016 11 Trepp, Loan Performance by Preperty Type, December 2015 12 Darie, T. ( February 23, 2016). “ Consumer confidence in U.S. sinks to Seven-Month Low”. 13 International Monetary Fund, Monthly data, 2015 14 International Monetary Fund, Commodity Market Monthly, January 15, 2016. 15 Reuters-Market. (February 1, 2016), “U.S. construction spending up slightly in December” 16 Quarterly Survey of Commercial/Multifamily Mortgage Bankers Originations, Q4 2015 17 Costar Commercial Repeat- Sale Indices Press Release, January 2016 18 Real Capital Analytics, U.S. Capital Trend-Apartment, 2015 Year in Review DISCLOSURES Aegon USA Realty Advisors, LLC, (AURA) is a U.S.-based real estate asset manager and a member company of Aegon Asset Management, the global investment management division of the Aegon Group. The information included in this document should not be construed as investment advice or a recommendation for the purchase or sale of any security, loan, interest in real estate, or other investment. This material contains general information only on economic and investment matters; it should not be considered as a comprehensive state- ment on any matter and should not be relied upon as such. The information does not take into account any investor’s investment objectives, particular needs or financial situation. The value of any investment may fluctuate. This information has been developed internally and may incorporate third party data, text, images and other content deemed to be reliable. Any opinions, estimates and projections included herein constitute the current judgement of the author as of the date of this document. Aegon USA Realty Advisors., LLC (AURA) has no obligation to update, modify or amend this document or to otherwise notify the reader in the event that any matter stated herein, or if any opinion, projection, forecast or estimate set forth herein, changes or subsequently becomes or is determined to be innaccurate. The reader acknowledges that all right, title and interest in the content of this document is owned by AURA and cannot be further distributed without the prior written consent of AURA. Copyright © 2016 Aegon USA Realty Advisors, LLC Ref Code: 032016039OP Expires: 6/30/2017 U.S. Commercial Real Estate Market Overview First Quarter 2016 Applied Research www.aegonrealty.com We use our investment management expertise to help people achieve a lifetime of financial security