SlideShare una empresa de Scribd logo
1 de 37
Descargar para leer sin conexión
AB C Company, Inc.
Es timate d State me nt of Ope rations
For The Years Ended December 31, 2010. 2011, 2012, and 2013


                                                           Dollars (000's omitte d)                                Pe rce nt (%) of Re ve nue
                                               2010             2011            2012            2013        2010       2011        2012         2013
Re ve nue :
  Installation Revenue                     $      450      $      3,825     $    21,038     $    73,633       77.1%      84.3%       82.3%       80.6%
  Non-Installation Revenue
    Service Fees                           $          89   $       623      $     4,361     $    17,444       15.2%      13.7%       17.1%       19.1%
    Other Non-Installation Revenue         $          45   $           90   $      158      $      237         7.7%       2.0%        0.6%        0.3%


               Total Revenue:              $      584       $    4,538      $   25,557      $   91,314      100.0%     100.0%      100.0%       100.0%


Dire ct Cos ts:
    Installation Costs                     $      338      $      2,678     $    12,623     $    36,817       57.9%      59.0%       49.4%       40.3%
    Non-Installation Costs                 $          38   $       193      $     1,175     $     4,420        6.5%       4.3%        4.6%        4.8%
               Direct Costs:               $      376      $      2,871     $    13,798     $    41,237       64.4%      63.3%       54.0%       45.2%


Othe r Cos t of Se rvice s                 $          88   $       567      $     2,556     $     6,849       15.1%      12.5%       10.0%        7.5%


Gros s M argin ($)                         $      120       $    1,100      $    9,203      $   43,228       20.5%      24.2%       36.0%       47.3%
Gross Margin (%)                                20.5%            24.2%           36.0%           47.3%

Ope rating Expe nse s:
    Sales                                  $      292      $      1,588     $     6,389     $    18,263       50.0%      35.0%       25.0%       20.0%
    Marketing                              $      263      $      1,361     $     5,111     $    13,697       45.0%      30.0%       20.0%       15.0%
    Research & Development                 $      175      $       998      $     2,811     $     8,218       30.0%      22.0%       11.0%        9.0%
    General & Administration               $          44   $       295      $     1,533     $     4,566        7.5%       6.5%        6.0%        5.0%
               Total Operating Expenses:   $      774      $      4,242     $    15,844     $    44,744      132.5%      93.5%       62.0%       49.0%


EBITDA                                     $     (654)      $   (3,142)     $   (6,641)     $   (1,516)     -112.0%     -69.2%     -26.0%        -1.7%


Othe r (Re ve nue ) & Expe ns e s :
    Interest                               $          80   $       156      $          32   $          80     13.7%       3.4%        0.1%        0.1%
    Taxes                                  $          8    $           9    $          11   $          15      1.4%       0.2%        0.0%        0.0%
    Depreciation & Amortization            $          13   $           67   $      268      $      874         2.2%       1.5%        1.0%        1.0%
            Total Other (Revenue) & Expenses
                                         $        101      $       232      $      311      $      969        17.3%       5.1%        1.2%        1.1%


Ne t Income (Loss )                        $     (755)     $    (3,374)     $   (6,952)     $   (2,485)     -129.3%     -74.3%     -27.2%        -2.7%


State me nt Note s :
Re ve nue
    Market 1                               $          43   $      2,320     $    12,205     $    46,232        7.4%      51.1%       47.8%       50.6%
    Market 2                               $      230      $      1,201     $     7,652     $    26,450       39.4%      26.5%       29.9%       29.0%
    Market 3                               $      256      $       932      $     3,250     $    12,658       43.8%      20.5%       12.7%       13.9%
    Market 4                               $          55   $           85   $     2,450     $     5,974        9.4%       1.9%        9.6%        6.5%
Total Re ve nue                            $      584      $     4,538      $   25,557      $   91,314


He adcount
Existing                                   $     13.00     $      18.00     $     61.00     $   298.00
New Hires                                  $      5.00     $      43.00     $    237.00     $   830.00
Total Headcount                            $     18.00     $      61.00     $    298.00     $ 1,128.00

Capital Expe nditure s                     $    126.00     $     424.00     $ 1,584.00      $ 4,474.00


                                                                 COPYRIGHT © 2010
                                                                   COPYRIGHT © 2011
Rule #1:
    If you cannot read the
financial statement from two
     feet away the font is
            too small

(i.e. there are too many details)


             COPYRIGHT © 2011
ABC Company, Inc.
Estimate d State ment of Operations
For The Years Ended December 31, 2010. 2011, 2012, and 2013

                                                          Dollars (000's omitte d)
                                            2010           2011           2012             2013
Revenue:
   Market 1                            $           43 $       2,320 $      12,205 $         46,232
   Market 2                            $       230 $          1,201 $       7,652 $         26,450
   Market 3                            $       256 $            932 $       3,250 $         12,658
   Market 4                            $           55 $           85 $      2,450 $          5,974
Total Reve nue                         $      584     $      4,538    $    25,557      $    91,314


Gross Margin ($)                        $     120     $      1,100    $     9,203      $    43,228
Gross Margin (%)                             20.5%            24.2%         36.0%            47.3%

Ope rating Expense s:
   Sales & Marketing                   $       555 $          2,949 $      11,500 $         31,960
   Research & Development              $       175 $            998 $       2,811 $          8,218
   General & Administration            $           44 $         295 $       1,533 $          4,566
           Total Operating Expenses:    $      774    $       4,242   $    15,844      $    44,744


Other Expense/(Income)                  $      101 $            232   $          311   $          969
Net Income (Loss)                      $      (755) $        (3,374) $     (6,952) $        (2,485)


Statement Notes:
Headcount
Existing                               $           13 $           18 $            61 $         298
New Hires                              $            5 $           43 $           237 $         830
Total Headcount                        $           18 $           61 $           298 $       1,128

Capital Expe nditure s                 $       126 $            424 $       1,584 $          4,474


                                       COPYRIGHT © 2011
Rule #2:
Use $ (dollar signs) on the
 first and last row only.

 Unless, of course, you are
mixing rows of $ and %, etc.


           COPYRIGHT © 2011
FORMAT CREDIBILITY
The presentation format does
      not interfere with
     (or create noise for)
          the reader


           COPYRIGHT © 2011
Rule #3:
  Numbers with thousands or
  millions must have commas

This:       54,556
Not this:   54556


            COPYRIGHT © 2011
ABC Company, Inc.
Projecte d Statement of Operations
For The Years Ended December 31, 2010 through 2013


                                                                     Dollars
                                              2010           2011            2012             2013
                    Revenue:
                      Market 1            $          43 $         2,320 $         12,205 $         46,232
                      Market 2                   230              1,201            7,652           26,450
                      Market 3                   256                932            3,250           12,658
                      Market 4                       55              85            2,450            5,974
                Total Revenue                   584               4,538        25,557             91,314


                  Gross Margin ($)              120               1,100           9,203           43,228
                   Gross Margin (%) 20.5%                 24.2%           36.0%            47.3%

              Operating Expense s:
                   Sales & Marketing 555                     2,949                 11,500 31,960
            Research & Development 175                        998                   2,811 8,218
            General & Administration 44                       295                   1,533 4,566
           Total Operating Expenses: 774                     4,242                 15,844 44,744


            Other Expense/(Income)               101                232             311               969
                   Net Income (Loss) $          (755) $       (3,374) $           (6,952) $        (2,485)


                  S t at em ent Not es:
                          Headcount
                             Exis t ing              13              18              61               298
                           New Hir es                 5              43             237               830
                    Tot al Headc ount                18              61             298             1,128

               Capital Expenditure s $           126 $              424 $          1,584 $          4,474

                                              COPYRIGHT © 2011
Rule #4:
 Don’t mix fonts


  Or font   size……
And do not use a silly font

            COPYRIGHT © 2011
Rule #5:
   Text is left justified
Numbers are right justified

Violators confuse the reader


           COPYRIGHT © 2011
Rule #6:
    Do not overdo color
             and
Do not highlight in


                         Use Spot color!


           COPYRIGHT © 2011
Rule #7:
Round your numbers to the
   nearest thousand for
      presentations

This:       $456,000
Not this:   $456,000,000


              COPYRIGHT © 2011
Rule #8:
     Spelle Check
And do not tell me you relied
     on Microsoft…….


           COPYRIGHT © 2011
Financial Forecast in
 your Slide deck is a
  Marketing Effort!


        COPYRIGHT © 2011
• Provide cost-effective outsourced (part-time)
  CFO support
• Clients range from pre-revenue startups to later
  stage privately held companies
• Goal = provide strategic financial advice and
  handle all accounting/ financial matters so the
  entrepreneurs can focus on driving the business


                     COPYRIGHT © 2011
David Fogel, CPA
Serial entrepreneurial CFO
Principal of Swifton CFOs LLC
Experience with high tech companies ranging from biotech
to telecom services to healthcare IT to social media to…
Adjunct Instructor of WPI MBA Program
Judge & Mentor:

Sponsor:
Associations:


                      COPYRIGHT © 2011
Ty Danco
     Member, Mass Medical Angels
     Member, North Country Angels

"I'll never believe your revenue numbers
anyway, but I sure want to scrutinize your
        assumptions and expenses!"


                 COPYRIGHT © 2011
Developing The Financial Forecast
1. What about the assumptions?
Document the source of each number you produce - Why?
   - Knowledge of the assumptions proves that the
     entrepreneur understands the business
          “Does the story make sense?”
          “Does the story add up?”
Sources of assumptions
   - Estimated or best guess (really try not to SWAG)
   - Desired goal to be obtained
   - Primary market research – surveys, vendor quotes
   - Second market research – purchased or gov’t information

                        COPYRIGHT © 2011
Set your goals from top down
               but…..
Prepare the model from the bottom up
           then….start over
      with your top down goals


              COPYRIGHT © 2011
Developing The Financial Forecast
 1. What about the assumptions? (part 2)
 Start-up costs (uses of $)
 Financing (sources of $)
 Capital expenditures (costs with >1 yr life)
 Fixed expense (cost of being in business)
 Variable expense (cost of doing business)
 Projected sales (anticipated revenue earned)
 Cash flow (anticipated $ received and spent)


                    COPYRIGHT © 2011
Developing The Financial Forecast

 2. Creating the sales forecast
 BEST - Predict by customer as detailed as
 possible
 ….but include customer turnover

 BETTER – Predict by market


                   COPYRIGHT © 2011
Developing The Financial Forecast
 2. Creating the sales forecast (part 2)
  Predict by client (customer) types
     • By market
     • By size
  Then ID certain characteristics
                        Small      Medium Large
                        Client     Client Client
   Average Hours Per    4 Hours 8 Hours      16 Hours
   Week
   Average Contract $   $500       $1,250    $2,500
   Per Week


                          COPYRIGHT © 2011
Forecast Trap:
Why they call them “Gross Sales”
 • Returns
 • Discounts
 • Rebates
 • Chargebacks
 • Markdowns


            COPYRIGHT © 2011
Forecast Trap:

      Do not over-estimate
       first year revenue
(what, we can’t sell millions in first month?)


                   COPYRIGHT © 2011
Developing The Financial Forecast
   3. Spreading the Numbers
• Yes, you need to do it monthly -- for the entire period
• No flat numbers – consider the meaning – use %
  increases or $ per some indice
• Think: As headcount increases rent increases (just
  not variably)
• Start with revenue, then cost of services


                        COPYRIGHT © 2011
Forecast Trap:
               Multiple Models

But…why not?

Make changes to the base model but forget
to change the other models
One investor model, Multiple options
(with triggers)


                  COPYRIGHT © 2011
Tip:
              Integration
Must use an integrated model

Headcount added
Payroll and benefits calculation
Summarized employee costs
Income Statement
Cash Flow


                COPYRIGHT © 2011
Tip:
       Use Rounding

Use the MS Excel “rounding
function” --- otherwise your
  numbers may not add up


          COPYRIGHT © 2011
Tip:
          Project payroll & benefits

•   Employee compensation is often the most costly
    expense yet they are often neglected.
      • Sales commissions – Direct connect with sales
      • Bonuses – If you are lucky enough……
      • Recruiting expenses – Peg to new employees

•   Project monthly to handle start dates correctly
•   Match additions of people with milestones


                      COPYRIGHT © 2011
Tip:
  Projection Numbers are not separate from
               the Company Plans

Company Plans

    Milestone   Projects         Responsible   Revenue/   Dates
                                                 Cost


                           COPYRIGHT © 2011
Ben Littauer
  Member, Boston Harbor Angels

"I like to see a business model spreadsheet with
 the assumptions clearly called out as variables.
    Then I can twiddle the knobs and see how
     sensitive profits are to the assumptions."


                    COPYRIGHT © 2011
ABC Co.
($ 000's omitted)
                                        2010           2011       2012         2013         2014        Income
Pro Forma Financial Statement
Revenue                             $      -         $ 1,875     $ 44,953    $ 108,238    $ 180,161
                                                                                                       Statement
Cost of Service                            -           1,162       12,739        5,369          -
Gross Margin                               -             712       32,214      102,868      180,161
                                                          38%          72%         95%         100%
Operating Expenses
Employee Costs                          1,303           2,972       3,587        4,198        4,379
Professional Fees                         253             637       1,780        1,230        1,135
Marketing & Travel                         61             525       2,340          293          658
Administrative Expenses                    60              55         232           41           47
Development & Pilot Manufacturing         409             819         262          965        1,733
Facility & Other                          195             801       1,206        1,612        2,023
Total Expenses                          2,282           5,807       9,407        8,340        9,976

Depreciation & Amortization                 42             98         301          590          791
EBIT                                    (2,324)        (5,193)     22,507       93,939      169,394
                                                                                                       Cash Flow
Net Income                              (2,639)        (5,411)     16,893       55,530      100,603
                                               0%       -289%          38%         51%          56%    Statement
Pro Forma Cash Flow
Cash from   Operations                  (2,597)        (5,313)     17,193       56,120      101,393
Cash from   Working Capital                (31)          (936)     (2,879)      (2,754)      (3,437)
Cash from   Investments                    (57)          (297)     (1,052)        (607)        (600)
Cash from   Financing                    7,000            -        42,000          -            -

Net Cash Flow                         4,315            (6,545)     55,262       52,759       97,357
Ending Cash                         $ 6,644          $     99    $ 55,360    $ 108,119    $ 205,476


                                                    COPYRIGHT © 2011
ABC Company – Financials by Year
                                       ($ 000’s omitted)

$225,000                                                           Seeking $250k Investment
            Milestone #1
            Prototype


$175,000
                       Milestone #2
                       Pilots


                                        Milestone #3
$125,000                                Commercialization
                                                                                              Revenue
                                                                                              Income
                                                                                              Cash
 $75,000


 $25,000


                2010             2011          2012         2013      2014

($25,000)


                                             COPYRIGHT © 2011
Universal Truths:

1. Project monthly, Present annually
2. Projections constantly change,
   let them. Not an annual exercise.
   Develop as a monthly exercise.
3. Financials must be consistent with rest
   of presentation
4. Do not need to be hung up with GAAP,
   but….don’t go rogue

                    COPYRIGHT © 2011
Even More Universal Truths:
5. Be consistent – Don’t portray
   expenses in different categories
   differently by year
6. Have “Checks”
7. P&L Income ≠ Cash Flow
   (we know this right?)


               COPYRIGHT © 2011
Developing The Financial Forecast
Contact Information:


Email:
Website:
Twitter:

Phone:
Cell:


                 COPYRIGHT © 2010
COPYRIGHT © 2010

Más contenido relacionado

La actualidad más candente

3q07_Supplement
3q07_Supplement3q07_Supplement
3q07_Supplementfinance27
 
Gta office market statistics 2011 q2
Gta office market statistics 2011 q2Gta office market statistics 2011 q2
Gta office market statistics 2011 q2Chris Fyvie
 
alltel 1Q06_Supplement
alltel  1Q06_Supplementalltel  1Q06_Supplement
alltel 1Q06_Supplementfinance27
 
ecolab 2003BusinessDescription
ecolab  2003BusinessDescriptionecolab  2003BusinessDescription
ecolab 2003BusinessDescriptionfinance37
 
dollar general annual reports 2002
dollar general annual reports 2002dollar general annual reports 2002
dollar general annual reports 2002finance41
 
Acme Company Financial Model
Acme Company Financial ModelAcme Company Financial Model
Acme Company Financial ModelBruceSlides555
 
morgan stanley Annual Reports 2001
morgan stanley  Annual Reports 2001 morgan stanley  Annual Reports 2001
morgan stanley Annual Reports 2001 finance2
 
reliance steel & aluminum 2005_Annual_Report
reliance steel & aluminum  2005_Annual_Reportreliance steel & aluminum  2005_Annual_Report
reliance steel & aluminum 2005_Annual_Reportfinance32
 
alltel 2q 07_supplement
alltel  2q 07_supplementalltel  2q 07_supplement
alltel 2q 07_supplementfinance27
 
alltel 2q 07_Supplement
alltel  2q 07_Supplementalltel  2q 07_Supplement
alltel 2q 07_Supplementfinance27
 
Anthem Southeast Historical Data
Anthem Southeast Historical DataAnthem Southeast Historical Data
Anthem Southeast Historical Datafinance4
 
J.S. Die & Mold - Operations Review 2006-12-21
J.S. Die & Mold - Operations Review 2006-12-21J.S. Die & Mold - Operations Review 2006-12-21
J.S. Die & Mold - Operations Review 2006-12-21Bob Sloma
 
Investor Relations Site Graphics Placemat
Investor Relations Site Graphics PlacematInvestor Relations Site Graphics Placemat
Investor Relations Site Graphics Placematnelnetir
 
Financial Analysis with Microsoft Excel 7th Edition Mayes Solutions Manual
Financial Analysis with Microsoft Excel 7th Edition Mayes Solutions ManualFinancial Analysis with Microsoft Excel 7th Edition Mayes Solutions Manual
Financial Analysis with Microsoft Excel 7th Edition Mayes Solutions Manualtuqykogod
 
qwest communications 1231 06
qwest communications 1231 06qwest communications 1231 06
qwest communications 1231 06finance19
 
alcoa 3Q08 Analyst Presentation
alcoa 3Q08 Analyst Presentation alcoa 3Q08 Analyst Presentation
alcoa 3Q08 Analyst Presentation finance8
 

La actualidad más candente (20)

3q07_Supplement
3q07_Supplement3q07_Supplement
3q07_Supplement
 
Gta office market statistics 2011 q2
Gta office market statistics 2011 q2Gta office market statistics 2011 q2
Gta office market statistics 2011 q2
 
alltel 1Q06_Supplement
alltel  1Q06_Supplementalltel  1Q06_Supplement
alltel 1Q06_Supplement
 
ecolab 2003BusinessDescription
ecolab  2003BusinessDescriptionecolab  2003BusinessDescription
ecolab 2003BusinessDescription
 
dollar general annual reports 2002
dollar general annual reports 2002dollar general annual reports 2002
dollar general annual reports 2002
 
Dcf
DcfDcf
Dcf
 
Fm
FmFm
Fm
 
Acme Company Financial Model
Acme Company Financial ModelAcme Company Financial Model
Acme Company Financial Model
 
morgan stanley Annual Reports 2001
morgan stanley  Annual Reports 2001 morgan stanley  Annual Reports 2001
morgan stanley Annual Reports 2001
 
reliance steel & aluminum 2005_Annual_Report
reliance steel & aluminum  2005_Annual_Reportreliance steel & aluminum  2005_Annual_Report
reliance steel & aluminum 2005_Annual_Report
 
alltel 2q 07_supplement
alltel  2q 07_supplementalltel  2q 07_supplement
alltel 2q 07_supplement
 
alltel 2q 07_Supplement
alltel  2q 07_Supplementalltel  2q 07_Supplement
alltel 2q 07_Supplement
 
Anthem Southeast Historical Data
Anthem Southeast Historical DataAnthem Southeast Historical Data
Anthem Southeast Historical Data
 
Anexo 1
Anexo 1Anexo 1
Anexo 1
 
J.S. Die & Mold - Operations Review 2006-12-21
J.S. Die & Mold - Operations Review 2006-12-21J.S. Die & Mold - Operations Review 2006-12-21
J.S. Die & Mold - Operations Review 2006-12-21
 
Profit blueprint
Profit blueprintProfit blueprint
Profit blueprint
 
Investor Relations Site Graphics Placemat
Investor Relations Site Graphics PlacematInvestor Relations Site Graphics Placemat
Investor Relations Site Graphics Placemat
 
Financial Analysis with Microsoft Excel 7th Edition Mayes Solutions Manual
Financial Analysis with Microsoft Excel 7th Edition Mayes Solutions ManualFinancial Analysis with Microsoft Excel 7th Edition Mayes Solutions Manual
Financial Analysis with Microsoft Excel 7th Edition Mayes Solutions Manual
 
qwest communications 1231 06
qwest communications 1231 06qwest communications 1231 06
qwest communications 1231 06
 
alcoa 3Q08 Analyst Presentation
alcoa 3Q08 Analyst Presentation alcoa 3Q08 Analyst Presentation
alcoa 3Q08 Analyst Presentation
 

Similar a Swifton CFOs LLC - Boston BizSpark presentation - Financial Projections for Investor Presentations

brunswick annual reports 2005
brunswick annual reports 2005brunswick annual reports 2005
brunswick annual reports 2005finance36
 
pulte homes 2003 AR
pulte homes 2003 ARpulte homes 2003 AR
pulte homes 2003 ARfinance42
 
Erin Parker Atvidcf V1
Erin Parker Atvidcf V1Erin Parker Atvidcf V1
Erin Parker Atvidcf V1Caneskid05
 
alltel 3Q05_Highlights
alltel  3Q05_Highlightsalltel  3Q05_Highlights
alltel 3Q05_Highlightsfinance27
 
Page 1 Front PagePage 2 Stocks & BondsPage 3 Financial Sum.docx
Page 1 Front PagePage 2 Stocks & BondsPage 3 Financial Sum.docxPage 1 Front PagePage 2 Stocks & BondsPage 3 Financial Sum.docx
Page 1 Front PagePage 2 Stocks & BondsPage 3 Financial Sum.docxalfred4lewis58146
 
Big_Lots_AR2003
Big_Lots_AR2003Big_Lots_AR2003
Big_Lots_AR2003finance50
 
ACG_Cup_-_Valuation
ACG_Cup_-_ValuationACG_Cup_-_Valuation
ACG_Cup_-_ValuationIke Ekeh
 
BBB2005Annual
BBB2005AnnualBBB2005Annual
BBB2005Annualfinance44
 
BBB2005Annual
BBB2005AnnualBBB2005Annual
BBB2005Annualfinance44
 
alltel 2q 07_highlights
alltel  2q 07_highlightsalltel  2q 07_highlights
alltel 2q 07_highlightsfinance27
 
112612 fcs council presentation
112612 fcs council presentation112612 fcs council presentation
112612 fcs council presentationTheDalles
 
alltel 4q 06_highlights
alltel  4q 06_highlightsalltel  4q 06_highlights
alltel 4q 06_highlightsfinance27
 
Google - Investment Analysis & Mgmt 120213 10pm v4 final
Google - Investment Analysis & Mgmt  120213 10pm v4 finalGoogle - Investment Analysis & Mgmt  120213 10pm v4 final
Google - Investment Analysis & Mgmt 120213 10pm v4 finalRichard Chan, MBA
 
Campus clothiers semmiannual financial projection
Campus clothiers semmiannual financial projectionCampus clothiers semmiannual financial projection
Campus clothiers semmiannual financial projectionbrittneytaylor
 
Copy Tested Of Imc09 Payback Analysis Jc 072209
Copy Tested  Of Imc09 Payback Analysis Jc 072209Copy Tested  Of Imc09 Payback Analysis Jc 072209
Copy Tested Of Imc09 Payback Analysis Jc 072209ccaywood
 
As of June 30, 2017
As of June 30, 2017As of June 30, 2017
As of June 30, 2017nelnetir
 

Similar a Swifton CFOs LLC - Boston BizSpark presentation - Financial Projections for Investor Presentations (20)

brunswick annual reports 2005
brunswick annual reports 2005brunswick annual reports 2005
brunswick annual reports 2005
 
Anexo 2
Anexo 2Anexo 2
Anexo 2
 
pulte homes 2003 AR
pulte homes 2003 ARpulte homes 2003 AR
pulte homes 2003 AR
 
Erin Parker Atvidcf V1
Erin Parker Atvidcf V1Erin Parker Atvidcf V1
Erin Parker Atvidcf V1
 
ACG Cup - Valuation
ACG Cup - ValuationACG Cup - Valuation
ACG Cup - Valuation
 
alltel 3Q05_Highlights
alltel  3Q05_Highlightsalltel  3Q05_Highlights
alltel 3Q05_Highlights
 
proforma sample
proforma sampleproforma sample
proforma sample
 
Page 1 Front PagePage 2 Stocks & BondsPage 3 Financial Sum.docx
Page 1 Front PagePage 2 Stocks & BondsPage 3 Financial Sum.docxPage 1 Front PagePage 2 Stocks & BondsPage 3 Financial Sum.docx
Page 1 Front PagePage 2 Stocks & BondsPage 3 Financial Sum.docx
 
Big_Lots_AR2003
Big_Lots_AR2003Big_Lots_AR2003
Big_Lots_AR2003
 
ACG_Cup_-_Valuation
ACG_Cup_-_ValuationACG_Cup_-_Valuation
ACG_Cup_-_Valuation
 
BBB2005Annual
BBB2005AnnualBBB2005Annual
BBB2005Annual
 
BBB2005Annual
BBB2005AnnualBBB2005Annual
BBB2005Annual
 
alltel 2q 07_highlights
alltel  2q 07_highlightsalltel  2q 07_highlights
alltel 2q 07_highlights
 
112612 fcs council presentation
112612 fcs council presentation112612 fcs council presentation
112612 fcs council presentation
 
alltel 4q 06_highlights
alltel  4q 06_highlightsalltel  4q 06_highlights
alltel 4q 06_highlights
 
Google - Investment Analysis & Mgmt 120213 10pm v4 final
Google - Investment Analysis & Mgmt  120213 10pm v4 finalGoogle - Investment Analysis & Mgmt  120213 10pm v4 final
Google - Investment Analysis & Mgmt 120213 10pm v4 final
 
Campus clothiers semmiannual financial projection
Campus clothiers semmiannual financial projectionCampus clothiers semmiannual financial projection
Campus clothiers semmiannual financial projection
 
3 d pie chart
3 d pie chart3 d pie chart
3 d pie chart
 
Copy Tested Of Imc09 Payback Analysis Jc 072209
Copy Tested  Of Imc09 Payback Analysis Jc 072209Copy Tested  Of Imc09 Payback Analysis Jc 072209
Copy Tested Of Imc09 Payback Analysis Jc 072209
 
As of June 30, 2017
As of June 30, 2017As of June 30, 2017
As of June 30, 2017
 

Más de David Fogel

TechStars presentation - Financial presentations for investors
TechStars presentation - Financial presentations for investorsTechStars presentation - Financial presentations for investors
TechStars presentation - Financial presentations for investorsDavid Fogel
 
Financial Forecasting for Investor Presentations - Bus Fundamentals Bootcamp
Financial Forecasting for Investor Presentations - Bus Fundamentals BootcampFinancial Forecasting for Investor Presentations - Bus Fundamentals Bootcamp
Financial Forecasting for Investor Presentations - Bus Fundamentals BootcampDavid Fogel
 
128 Innovation Capital Group (128 ICG) - Presented Compelling Financials for ...
128 Innovation Capital Group (128 ICG) - Presented Compelling Financials for ...128 Innovation Capital Group (128 ICG) - Presented Compelling Financials for ...
128 Innovation Capital Group (128 ICG) - Presented Compelling Financials for ...David Fogel
 
Financial Projections for Investor Presentations - Sept 18 2013
Financial Projections for Investor Presentations - Sept 18 2013Financial Projections for Investor Presentations - Sept 18 2013
Financial Projections for Investor Presentations - Sept 18 2013David Fogel
 
Swifton mc carter english - fin projections 091713
Swifton   mc carter english - fin projections 091713Swifton   mc carter english - fin projections 091713
Swifton mc carter english - fin projections 091713David Fogel
 
MIT Enterprise Forum Smart Start Presentation
MIT Enterprise Forum Smart Start PresentationMIT Enterprise Forum Smart Start Presentation
MIT Enterprise Forum Smart Start PresentationDavid Fogel
 
Extreme Networking
Extreme NetworkingExtreme Networking
Extreme NetworkingDavid Fogel
 
CFO Magazine - January 2007
CFO Magazine - January 2007CFO Magazine - January 2007
CFO Magazine - January 2007David Fogel
 

Más de David Fogel (8)

TechStars presentation - Financial presentations for investors
TechStars presentation - Financial presentations for investorsTechStars presentation - Financial presentations for investors
TechStars presentation - Financial presentations for investors
 
Financial Forecasting for Investor Presentations - Bus Fundamentals Bootcamp
Financial Forecasting for Investor Presentations - Bus Fundamentals BootcampFinancial Forecasting for Investor Presentations - Bus Fundamentals Bootcamp
Financial Forecasting for Investor Presentations - Bus Fundamentals Bootcamp
 
128 Innovation Capital Group (128 ICG) - Presented Compelling Financials for ...
128 Innovation Capital Group (128 ICG) - Presented Compelling Financials for ...128 Innovation Capital Group (128 ICG) - Presented Compelling Financials for ...
128 Innovation Capital Group (128 ICG) - Presented Compelling Financials for ...
 
Financial Projections for Investor Presentations - Sept 18 2013
Financial Projections for Investor Presentations - Sept 18 2013Financial Projections for Investor Presentations - Sept 18 2013
Financial Projections for Investor Presentations - Sept 18 2013
 
Swifton mc carter english - fin projections 091713
Swifton   mc carter english - fin projections 091713Swifton   mc carter english - fin projections 091713
Swifton mc carter english - fin projections 091713
 
MIT Enterprise Forum Smart Start Presentation
MIT Enterprise Forum Smart Start PresentationMIT Enterprise Forum Smart Start Presentation
MIT Enterprise Forum Smart Start Presentation
 
Extreme Networking
Extreme NetworkingExtreme Networking
Extreme Networking
 
CFO Magazine - January 2007
CFO Magazine - January 2007CFO Magazine - January 2007
CFO Magazine - January 2007
 

Último

Horngren’s Financial & Managerial Accounting, 7th edition by Miller-Nobles so...
Horngren’s Financial & Managerial Accounting, 7th edition by Miller-Nobles so...Horngren’s Financial & Managerial Accounting, 7th edition by Miller-Nobles so...
Horngren’s Financial & Managerial Accounting, 7th edition by Miller-Nobles so...ssuserf63bd7
 
20200128 Ethical by Design - Whitepaper.pdf
20200128 Ethical by Design - Whitepaper.pdf20200128 Ethical by Design - Whitepaper.pdf
20200128 Ethical by Design - Whitepaper.pdfChris Skinner
 
Traction part 2 - EOS Model JAX Bridges.
Traction part 2 - EOS Model JAX Bridges.Traction part 2 - EOS Model JAX Bridges.
Traction part 2 - EOS Model JAX Bridges.Anamaria Contreras
 
Technical Leaders - Working with the Management Team
Technical Leaders - Working with the Management TeamTechnical Leaders - Working with the Management Team
Technical Leaders - Working with the Management TeamArik Fletcher
 
Go for Rakhi Bazaar and Pick the Latest Bhaiya Bhabhi Rakhi.pptx
Go for Rakhi Bazaar and Pick the Latest Bhaiya Bhabhi Rakhi.pptxGo for Rakhi Bazaar and Pick the Latest Bhaiya Bhabhi Rakhi.pptx
Go for Rakhi Bazaar and Pick the Latest Bhaiya Bhabhi Rakhi.pptxRakhi Bazaar
 
Planetary and Vedic Yagyas Bring Positive Impacts in Life
Planetary and Vedic Yagyas Bring Positive Impacts in LifePlanetary and Vedic Yagyas Bring Positive Impacts in Life
Planetary and Vedic Yagyas Bring Positive Impacts in LifeBhavana Pujan Kendra
 
14680-51-4.pdf Good quality CAS Good quality CAS
14680-51-4.pdf  Good  quality CAS Good  quality CAS14680-51-4.pdf  Good  quality CAS Good  quality CAS
14680-51-4.pdf Good quality CAS Good quality CAScathy664059
 
Interoperability and ecosystems: Assembling the industrial metaverse
Interoperability and ecosystems:  Assembling the industrial metaverseInteroperability and ecosystems:  Assembling the industrial metaverse
Interoperability and ecosystems: Assembling the industrial metaverseSiemens
 
Introducing the Analogic framework for business planning applications
Introducing the Analogic framework for business planning applicationsIntroducing the Analogic framework for business planning applications
Introducing the Analogic framework for business planning applicationsKnowledgeSeed
 
Church Building Grants To Assist With New Construction, Additions, And Restor...
Church Building Grants To Assist With New Construction, Additions, And Restor...Church Building Grants To Assist With New Construction, Additions, And Restor...
Church Building Grants To Assist With New Construction, Additions, And Restor...Americas Got Grants
 
Excvation Safety for safety officers reference
Excvation Safety for safety officers referenceExcvation Safety for safety officers reference
Excvation Safety for safety officers referencessuser2c065e
 
PSCC - Capability Statement Presentation
PSCC - Capability Statement PresentationPSCC - Capability Statement Presentation
PSCC - Capability Statement PresentationAnamaria Contreras
 
Darshan Hiranandani [News About Next CEO].pdf
Darshan Hiranandani [News About Next CEO].pdfDarshan Hiranandani [News About Next CEO].pdf
Darshan Hiranandani [News About Next CEO].pdfShashank Mehta
 
Psychic Reading | Spiritual Guidance – Astro Ganesh Ji
Psychic Reading | Spiritual Guidance – Astro Ganesh JiPsychic Reading | Spiritual Guidance – Astro Ganesh Ji
Psychic Reading | Spiritual Guidance – Astro Ganesh Jiastral oracle
 
WSMM Technology February.March Newsletter_vF.pdf
WSMM Technology February.March Newsletter_vF.pdfWSMM Technology February.March Newsletter_vF.pdf
WSMM Technology February.March Newsletter_vF.pdfJamesConcepcion7
 
Healthcare Feb. & Mar. Healthcare Newsletter
Healthcare Feb. & Mar. Healthcare NewsletterHealthcare Feb. & Mar. Healthcare Newsletter
Healthcare Feb. & Mar. Healthcare NewsletterJamesConcepcion7
 
1911 Gold Corporate Presentation Apr 2024.pdf
1911 Gold Corporate Presentation Apr 2024.pdf1911 Gold Corporate Presentation Apr 2024.pdf
1911 Gold Corporate Presentation Apr 2024.pdfShaun Heinrichs
 
Pitch Deck Teardown: Xpanceo's $40M Seed deck
Pitch Deck Teardown: Xpanceo's $40M Seed deckPitch Deck Teardown: Xpanceo's $40M Seed deck
Pitch Deck Teardown: Xpanceo's $40M Seed deckHajeJanKamps
 
Fordham -How effective decision-making is within the IT department - Analysis...
Fordham -How effective decision-making is within the IT department - Analysis...Fordham -How effective decision-making is within the IT department - Analysis...
Fordham -How effective decision-making is within the IT department - Analysis...Peter Ward
 

Último (20)

Horngren’s Financial & Managerial Accounting, 7th edition by Miller-Nobles so...
Horngren’s Financial & Managerial Accounting, 7th edition by Miller-Nobles so...Horngren’s Financial & Managerial Accounting, 7th edition by Miller-Nobles so...
Horngren’s Financial & Managerial Accounting, 7th edition by Miller-Nobles so...
 
20200128 Ethical by Design - Whitepaper.pdf
20200128 Ethical by Design - Whitepaper.pdf20200128 Ethical by Design - Whitepaper.pdf
20200128 Ethical by Design - Whitepaper.pdf
 
Traction part 2 - EOS Model JAX Bridges.
Traction part 2 - EOS Model JAX Bridges.Traction part 2 - EOS Model JAX Bridges.
Traction part 2 - EOS Model JAX Bridges.
 
Technical Leaders - Working with the Management Team
Technical Leaders - Working with the Management TeamTechnical Leaders - Working with the Management Team
Technical Leaders - Working with the Management Team
 
Go for Rakhi Bazaar and Pick the Latest Bhaiya Bhabhi Rakhi.pptx
Go for Rakhi Bazaar and Pick the Latest Bhaiya Bhabhi Rakhi.pptxGo for Rakhi Bazaar and Pick the Latest Bhaiya Bhabhi Rakhi.pptx
Go for Rakhi Bazaar and Pick the Latest Bhaiya Bhabhi Rakhi.pptx
 
Planetary and Vedic Yagyas Bring Positive Impacts in Life
Planetary and Vedic Yagyas Bring Positive Impacts in LifePlanetary and Vedic Yagyas Bring Positive Impacts in Life
Planetary and Vedic Yagyas Bring Positive Impacts in Life
 
14680-51-4.pdf Good quality CAS Good quality CAS
14680-51-4.pdf  Good  quality CAS Good  quality CAS14680-51-4.pdf  Good  quality CAS Good  quality CAS
14680-51-4.pdf Good quality CAS Good quality CAS
 
Interoperability and ecosystems: Assembling the industrial metaverse
Interoperability and ecosystems:  Assembling the industrial metaverseInteroperability and ecosystems:  Assembling the industrial metaverse
Interoperability and ecosystems: Assembling the industrial metaverse
 
Introducing the Analogic framework for business planning applications
Introducing the Analogic framework for business planning applicationsIntroducing the Analogic framework for business planning applications
Introducing the Analogic framework for business planning applications
 
Church Building Grants To Assist With New Construction, Additions, And Restor...
Church Building Grants To Assist With New Construction, Additions, And Restor...Church Building Grants To Assist With New Construction, Additions, And Restor...
Church Building Grants To Assist With New Construction, Additions, And Restor...
 
Excvation Safety for safety officers reference
Excvation Safety for safety officers referenceExcvation Safety for safety officers reference
Excvation Safety for safety officers reference
 
WAM Corporate Presentation April 12 2024.pdf
WAM Corporate Presentation April 12 2024.pdfWAM Corporate Presentation April 12 2024.pdf
WAM Corporate Presentation April 12 2024.pdf
 
PSCC - Capability Statement Presentation
PSCC - Capability Statement PresentationPSCC - Capability Statement Presentation
PSCC - Capability Statement Presentation
 
Darshan Hiranandani [News About Next CEO].pdf
Darshan Hiranandani [News About Next CEO].pdfDarshan Hiranandani [News About Next CEO].pdf
Darshan Hiranandani [News About Next CEO].pdf
 
Psychic Reading | Spiritual Guidance – Astro Ganesh Ji
Psychic Reading | Spiritual Guidance – Astro Ganesh JiPsychic Reading | Spiritual Guidance – Astro Ganesh Ji
Psychic Reading | Spiritual Guidance – Astro Ganesh Ji
 
WSMM Technology February.March Newsletter_vF.pdf
WSMM Technology February.March Newsletter_vF.pdfWSMM Technology February.March Newsletter_vF.pdf
WSMM Technology February.March Newsletter_vF.pdf
 
Healthcare Feb. & Mar. Healthcare Newsletter
Healthcare Feb. & Mar. Healthcare NewsletterHealthcare Feb. & Mar. Healthcare Newsletter
Healthcare Feb. & Mar. Healthcare Newsletter
 
1911 Gold Corporate Presentation Apr 2024.pdf
1911 Gold Corporate Presentation Apr 2024.pdf1911 Gold Corporate Presentation Apr 2024.pdf
1911 Gold Corporate Presentation Apr 2024.pdf
 
Pitch Deck Teardown: Xpanceo's $40M Seed deck
Pitch Deck Teardown: Xpanceo's $40M Seed deckPitch Deck Teardown: Xpanceo's $40M Seed deck
Pitch Deck Teardown: Xpanceo's $40M Seed deck
 
Fordham -How effective decision-making is within the IT department - Analysis...
Fordham -How effective decision-making is within the IT department - Analysis...Fordham -How effective decision-making is within the IT department - Analysis...
Fordham -How effective decision-making is within the IT department - Analysis...
 

Swifton CFOs LLC - Boston BizSpark presentation - Financial Projections for Investor Presentations

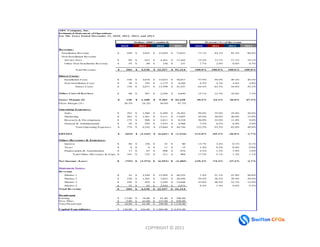
  • 1. AB C Company, Inc. Es timate d State me nt of Ope rations For The Years Ended December 31, 2010. 2011, 2012, and 2013 Dollars (000's omitte d) Pe rce nt (%) of Re ve nue 2010 2011 2012 2013 2010 2011 2012 2013 Re ve nue : Installation Revenue $ 450 $ 3,825 $ 21,038 $ 73,633 77.1% 84.3% 82.3% 80.6% Non-Installation Revenue Service Fees $ 89 $ 623 $ 4,361 $ 17,444 15.2% 13.7% 17.1% 19.1% Other Non-Installation Revenue $ 45 $ 90 $ 158 $ 237 7.7% 2.0% 0.6% 0.3% Total Revenue: $ 584 $ 4,538 $ 25,557 $ 91,314 100.0% 100.0% 100.0% 100.0% Dire ct Cos ts: Installation Costs $ 338 $ 2,678 $ 12,623 $ 36,817 57.9% 59.0% 49.4% 40.3% Non-Installation Costs $ 38 $ 193 $ 1,175 $ 4,420 6.5% 4.3% 4.6% 4.8% Direct Costs: $ 376 $ 2,871 $ 13,798 $ 41,237 64.4% 63.3% 54.0% 45.2% Othe r Cos t of Se rvice s $ 88 $ 567 $ 2,556 $ 6,849 15.1% 12.5% 10.0% 7.5% Gros s M argin ($) $ 120 $ 1,100 $ 9,203 $ 43,228 20.5% 24.2% 36.0% 47.3% Gross Margin (%) 20.5% 24.2% 36.0% 47.3% Ope rating Expe nse s: Sales $ 292 $ 1,588 $ 6,389 $ 18,263 50.0% 35.0% 25.0% 20.0% Marketing $ 263 $ 1,361 $ 5,111 $ 13,697 45.0% 30.0% 20.0% 15.0% Research & Development $ 175 $ 998 $ 2,811 $ 8,218 30.0% 22.0% 11.0% 9.0% General & Administration $ 44 $ 295 $ 1,533 $ 4,566 7.5% 6.5% 6.0% 5.0% Total Operating Expenses: $ 774 $ 4,242 $ 15,844 $ 44,744 132.5% 93.5% 62.0% 49.0% EBITDA $ (654) $ (3,142) $ (6,641) $ (1,516) -112.0% -69.2% -26.0% -1.7% Othe r (Re ve nue ) & Expe ns e s : Interest $ 80 $ 156 $ 32 $ 80 13.7% 3.4% 0.1% 0.1% Taxes $ 8 $ 9 $ 11 $ 15 1.4% 0.2% 0.0% 0.0% Depreciation & Amortization $ 13 $ 67 $ 268 $ 874 2.2% 1.5% 1.0% 1.0% Total Other (Revenue) & Expenses $ 101 $ 232 $ 311 $ 969 17.3% 5.1% 1.2% 1.1% Ne t Income (Loss ) $ (755) $ (3,374) $ (6,952) $ (2,485) -129.3% -74.3% -27.2% -2.7% State me nt Note s : Re ve nue Market 1 $ 43 $ 2,320 $ 12,205 $ 46,232 7.4% 51.1% 47.8% 50.6% Market 2 $ 230 $ 1,201 $ 7,652 $ 26,450 39.4% 26.5% 29.9% 29.0% Market 3 $ 256 $ 932 $ 3,250 $ 12,658 43.8% 20.5% 12.7% 13.9% Market 4 $ 55 $ 85 $ 2,450 $ 5,974 9.4% 1.9% 9.6% 6.5% Total Re ve nue $ 584 $ 4,538 $ 25,557 $ 91,314 He adcount Existing $ 13.00 $ 18.00 $ 61.00 $ 298.00 New Hires $ 5.00 $ 43.00 $ 237.00 $ 830.00 Total Headcount $ 18.00 $ 61.00 $ 298.00 $ 1,128.00 Capital Expe nditure s $ 126.00 $ 424.00 $ 1,584.00 $ 4,474.00 COPYRIGHT © 2010 COPYRIGHT © 2011
  • 2. Rule #1: If you cannot read the financial statement from two feet away the font is too small (i.e. there are too many details) COPYRIGHT © 2011
  • 3. ABC Company, Inc. Estimate d State ment of Operations For The Years Ended December 31, 2010. 2011, 2012, and 2013 Dollars (000's omitte d) 2010 2011 2012 2013 Revenue: Market 1 $ 43 $ 2,320 $ 12,205 $ 46,232 Market 2 $ 230 $ 1,201 $ 7,652 $ 26,450 Market 3 $ 256 $ 932 $ 3,250 $ 12,658 Market 4 $ 55 $ 85 $ 2,450 $ 5,974 Total Reve nue $ 584 $ 4,538 $ 25,557 $ 91,314 Gross Margin ($) $ 120 $ 1,100 $ 9,203 $ 43,228 Gross Margin (%) 20.5% 24.2% 36.0% 47.3% Ope rating Expense s: Sales & Marketing $ 555 $ 2,949 $ 11,500 $ 31,960 Research & Development $ 175 $ 998 $ 2,811 $ 8,218 General & Administration $ 44 $ 295 $ 1,533 $ 4,566 Total Operating Expenses: $ 774 $ 4,242 $ 15,844 $ 44,744 Other Expense/(Income) $ 101 $ 232 $ 311 $ 969 Net Income (Loss) $ (755) $ (3,374) $ (6,952) $ (2,485) Statement Notes: Headcount Existing $ 13 $ 18 $ 61 $ 298 New Hires $ 5 $ 43 $ 237 $ 830 Total Headcount $ 18 $ 61 $ 298 $ 1,128 Capital Expe nditure s $ 126 $ 424 $ 1,584 $ 4,474 COPYRIGHT © 2011
  • 4. Rule #2: Use $ (dollar signs) on the first and last row only. Unless, of course, you are mixing rows of $ and %, etc. COPYRIGHT © 2011
  • 5. FORMAT CREDIBILITY The presentation format does not interfere with (or create noise for) the reader COPYRIGHT © 2011
  • 6. Rule #3: Numbers with thousands or millions must have commas This: 54,556 Not this: 54556 COPYRIGHT © 2011
  • 7. ABC Company, Inc. Projecte d Statement of Operations For The Years Ended December 31, 2010 through 2013 Dollars 2010 2011 2012 2013 Revenue: Market 1 $ 43 $ 2,320 $ 12,205 $ 46,232 Market 2 230 1,201 7,652 26,450 Market 3 256 932 3,250 12,658 Market 4 55 85 2,450 5,974 Total Revenue 584 4,538 25,557 91,314 Gross Margin ($) 120 1,100 9,203 43,228 Gross Margin (%) 20.5% 24.2% 36.0% 47.3% Operating Expense s: Sales & Marketing 555 2,949 11,500 31,960 Research & Development 175 998 2,811 8,218 General & Administration 44 295 1,533 4,566 Total Operating Expenses: 774 4,242 15,844 44,744 Other Expense/(Income) 101 232 311 969 Net Income (Loss) $ (755) $ (3,374) $ (6,952) $ (2,485) S t at em ent Not es: Headcount Exis t ing 13 18 61 298 New Hir es 5 43 237 830 Tot al Headc ount 18 61 298 1,128 Capital Expenditure s $ 126 $ 424 $ 1,584 $ 4,474 COPYRIGHT © 2011
  • 8. Rule #4: Don’t mix fonts Or font size…… And do not use a silly font COPYRIGHT © 2011
  • 9. Rule #5: Text is left justified Numbers are right justified Violators confuse the reader COPYRIGHT © 2011
  • 10. Rule #6: Do not overdo color and Do not highlight in Use Spot color! COPYRIGHT © 2011
  • 11. Rule #7: Round your numbers to the nearest thousand for presentations This: $456,000 Not this: $456,000,000 COPYRIGHT © 2011
  • 12. Rule #8: Spelle Check And do not tell me you relied on Microsoft……. COPYRIGHT © 2011
  • 13. Financial Forecast in your Slide deck is a Marketing Effort! COPYRIGHT © 2011
  • 14. • Provide cost-effective outsourced (part-time) CFO support • Clients range from pre-revenue startups to later stage privately held companies • Goal = provide strategic financial advice and handle all accounting/ financial matters so the entrepreneurs can focus on driving the business COPYRIGHT © 2011
  • 15. David Fogel, CPA Serial entrepreneurial CFO Principal of Swifton CFOs LLC Experience with high tech companies ranging from biotech to telecom services to healthcare IT to social media to… Adjunct Instructor of WPI MBA Program Judge & Mentor: Sponsor: Associations: COPYRIGHT © 2011
  • 16. Ty Danco Member, Mass Medical Angels Member, North Country Angels "I'll never believe your revenue numbers anyway, but I sure want to scrutinize your assumptions and expenses!" COPYRIGHT © 2011
  • 17. Developing The Financial Forecast 1. What about the assumptions? Document the source of each number you produce - Why? - Knowledge of the assumptions proves that the entrepreneur understands the business “Does the story make sense?” “Does the story add up?” Sources of assumptions - Estimated or best guess (really try not to SWAG) - Desired goal to be obtained - Primary market research – surveys, vendor quotes - Second market research – purchased or gov’t information COPYRIGHT © 2011
  • 18. Set your goals from top down but….. Prepare the model from the bottom up then….start over with your top down goals COPYRIGHT © 2011
  • 19. Developing The Financial Forecast 1. What about the assumptions? (part 2) Start-up costs (uses of $) Financing (sources of $) Capital expenditures (costs with >1 yr life) Fixed expense (cost of being in business) Variable expense (cost of doing business) Projected sales (anticipated revenue earned) Cash flow (anticipated $ received and spent) COPYRIGHT © 2011
  • 20. Developing The Financial Forecast 2. Creating the sales forecast BEST - Predict by customer as detailed as possible ….but include customer turnover BETTER – Predict by market COPYRIGHT © 2011
  • 21. Developing The Financial Forecast 2. Creating the sales forecast (part 2) Predict by client (customer) types • By market • By size Then ID certain characteristics Small Medium Large Client Client Client Average Hours Per 4 Hours 8 Hours 16 Hours Week Average Contract $ $500 $1,250 $2,500 Per Week COPYRIGHT © 2011
  • 22. Forecast Trap: Why they call them “Gross Sales” • Returns • Discounts • Rebates • Chargebacks • Markdowns COPYRIGHT © 2011
  • 23. Forecast Trap: Do not over-estimate first year revenue (what, we can’t sell millions in first month?) COPYRIGHT © 2011
  • 24. Developing The Financial Forecast 3. Spreading the Numbers • Yes, you need to do it monthly -- for the entire period • No flat numbers – consider the meaning – use % increases or $ per some indice • Think: As headcount increases rent increases (just not variably) • Start with revenue, then cost of services COPYRIGHT © 2011
  • 25. Forecast Trap: Multiple Models But…why not? Make changes to the base model but forget to change the other models One investor model, Multiple options (with triggers) COPYRIGHT © 2011
  • 26. Tip: Integration Must use an integrated model Headcount added Payroll and benefits calculation Summarized employee costs Income Statement Cash Flow COPYRIGHT © 2011
  • 27. Tip: Use Rounding Use the MS Excel “rounding function” --- otherwise your numbers may not add up COPYRIGHT © 2011
  • 28. Tip: Project payroll & benefits • Employee compensation is often the most costly expense yet they are often neglected. • Sales commissions – Direct connect with sales • Bonuses – If you are lucky enough…… • Recruiting expenses – Peg to new employees • Project monthly to handle start dates correctly • Match additions of people with milestones COPYRIGHT © 2011
  • 29. Tip: Projection Numbers are not separate from the Company Plans Company Plans Milestone Projects Responsible Revenue/ Dates Cost COPYRIGHT © 2011
  • 30. Ben Littauer Member, Boston Harbor Angels "I like to see a business model spreadsheet with the assumptions clearly called out as variables. Then I can twiddle the knobs and see how sensitive profits are to the assumptions." COPYRIGHT © 2011
  • 31. ABC Co. ($ 000's omitted) 2010 2011 2012 2013 2014 Income Pro Forma Financial Statement Revenue $ - $ 1,875 $ 44,953 $ 108,238 $ 180,161 Statement Cost of Service - 1,162 12,739 5,369 - Gross Margin - 712 32,214 102,868 180,161 38% 72% 95% 100% Operating Expenses Employee Costs 1,303 2,972 3,587 4,198 4,379 Professional Fees 253 637 1,780 1,230 1,135 Marketing & Travel 61 525 2,340 293 658 Administrative Expenses 60 55 232 41 47 Development & Pilot Manufacturing 409 819 262 965 1,733 Facility & Other 195 801 1,206 1,612 2,023 Total Expenses 2,282 5,807 9,407 8,340 9,976 Depreciation & Amortization 42 98 301 590 791 EBIT (2,324) (5,193) 22,507 93,939 169,394 Cash Flow Net Income (2,639) (5,411) 16,893 55,530 100,603 0% -289% 38% 51% 56% Statement Pro Forma Cash Flow Cash from Operations (2,597) (5,313) 17,193 56,120 101,393 Cash from Working Capital (31) (936) (2,879) (2,754) (3,437) Cash from Investments (57) (297) (1,052) (607) (600) Cash from Financing 7,000 - 42,000 - - Net Cash Flow 4,315 (6,545) 55,262 52,759 97,357 Ending Cash $ 6,644 $ 99 $ 55,360 $ 108,119 $ 205,476 COPYRIGHT © 2011
  • 32. ABC Company – Financials by Year ($ 000’s omitted) $225,000 Seeking $250k Investment Milestone #1 Prototype $175,000 Milestone #2 Pilots Milestone #3 $125,000 Commercialization Revenue Income Cash $75,000 $25,000 2010 2011 2012 2013 2014 ($25,000) COPYRIGHT © 2011
  • 33. Universal Truths: 1. Project monthly, Present annually 2. Projections constantly change, let them. Not an annual exercise. Develop as a monthly exercise. 3. Financials must be consistent with rest of presentation 4. Do not need to be hung up with GAAP, but….don’t go rogue COPYRIGHT © 2011
  • 34. Even More Universal Truths: 5. Be consistent – Don’t portray expenses in different categories differently by year 6. Have “Checks” 7. P&L Income ≠ Cash Flow (we know this right?) COPYRIGHT © 2011