
Recommended
Recommended
More Related Content
Featured
Featured (20)
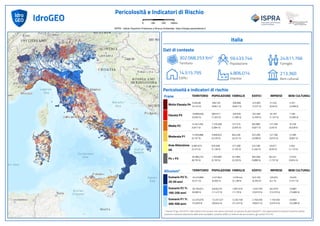
Pericolosità e Indicatori di Rischio
- 1. ISPRA - Istituto Superiore Protezione e Ricerca Ambientale https://idrogeo.isprambiente.it Dati di contesto Territorio Edifici 14.515.795 59.433.744 Popolazione 4.806.014 Imprese Famiglie 24.611.766 302.068,253 Km² Pericolosità e Indicatori di Rischio Pericolosità e indicatori di rischio Frane POPOLAZIONE FAMIGLIE EDIFICI IMPRESE Molto Elevata P4 Elevata P3 Media P2 Moderata P1 Aree Attenzione AA P4 + P3 Scenario P3 Tr. 20-50 anni Scenario P2 Tr. 100-200 anni Scenario P1 Tr. 300-500 anni Alluvioni* Beni culturali 213.360 TERRITORIO BENI CULTURALI POPOLAZIONE EDIFICI TERRITORIO IMPRESE FAMIGLIE BENI CULTURALI 9.494,84 499.749 (0,841 %) (3,143 %) 206.968 (0,841 %) 223.065 (1,537 %) 31.244 (0,65 %) 5.351 (2,508 %) Italia (1,107 %) 803.917 342.483 (1,353 %) (2,359 %) 53.197 (3,366 %) (1,385 %) 340.926 7.182 16.890,636 (5,592 %) (3,877 %) (2,65 %) 562.800 (2,894 %) (4,817 %) 1.720.208 14.551,493 (5,028 %) 127.356 (2,955 %) 727.315 10.728 (3,431 %) (3,376 %) (3,598 %) 2.006.643 (5,807 %) 147.766 (4,157 %) (3,075 %) 522.206 12.390 12.555,868 844.536 (1,173 %) (1,492 %) (2,313 %) 2.502 676.948 (1,102 %) (1,139 %) 271.208 6.987,673 522.206 45.677 (0,95 %) 26.385,476 1.303.666 (5,874 %) 84.441 (8,735 %) (3,896 %) 565.548 (1,757 %) (2,193 %) (2,226 %) 547.894 12.533 16.025 1.018.444 2.431.847 225.874 (4,138 %) 623.192 (4,092 %) (4,293 %) (7,511 %) (4,7 %) (5,371 %) 16.223,869 1.549.759 (11,472 %) (9,996 %) 30.195,631 (10,676 %) 6.818.375 642.979 33.887 2.901.616 (15,883 %) (13,379 %) (11,79 %) 2.703.030 42.375,676 49.903 5.226.748 (23,389 %) (20,624 %) 12.257.427 (21,237 %) (18,621 %) (23,915 %) (14,029 %) 1.149.340 * Scenari D.Lgs .49/2010. I dati relativi ai tre scenari non vanno sommati; lo scenario di pericolosità P1, che rappresenta lo scenario massimo atteso ovvero la massima estensione delle aree inondabili, contiene infatti, al netto di alcune eccezioni, gli scenari P3 e P2
- 2. ISPRA - Istituto Superiore Protezione e Ricerca Ambientale https://idrogeo.isprambiente.it Dati di contesto Territorio Edifici 980.291 4.342.135 Popolazione 403.272 Imprese Famiglie 1.916.735 22.444,543 Km² Pericolosità e Indicatori di Rischio Pericolosità e indicatori di rischio Frane POPOLAZIONE FAMIGLIE EDIFICI IMPRESE Molto Elevata P4 Elevata P3 Media P2 Moderata P1 Aree Attenzione AA P4 + P3 Scenario P3 Tr. 20-50 anni Scenario P2 Tr. 100-200 anni Scenario P1 Tr. 300-500 anni Alluvioni* Beni culturali 22.445 TERRITORIO BENI CULTURALI POPOLAZIONE EDIFICI TERRITORIO IMPRESE FAMIGLIE BENI CULTURALI 1.080,945 23.608 (0,544 %) (4,816 %) 10.494 (0,547 %) 12.775 (1,303 %) 1.845 (0,458 %) 297 (1,323 %) Emilia-Romagna (1,221 %) 63.031 40.238 (1,452 %) (4,105 %) 4.923 (3,564 %) (1,522 %) 29.166 800 2.189,405 (9,755 %) (0,881 %) (0,35 %) 8.635 (0,425 %) (1,365 %) 18.435 306,443 (1,043 %) 1.413 (0,432 %) 8.273 234 (0,706 %) (0,683 %) (1,08 %) 29.676 (1,096 %) 2.377 (0,713 %) (0,589 %) 10.589 246 159,983 13.538 (1,515 %) (1,722 %) (2,957 %) 340 53.163 (1,251 %) (1,224 %) 23.985 663,688 10.589 4.522 (1,121 %) 3.270,35 86.639 (4,888 %) 6.768 (14,571 %) (5,408 %) 53.013 (1,678 %) (1,995 %) (2,069 %) 39.660 1.097 1.891 183.533 428.568 36.529 (9,575 %) 99.710 (9,87 %) (10,171 %) (8,425 %) (9,058 %) (11,582 %) 2.599,624 578.088 (62,522 %) (45,603 %) 10.235,423 (58,971 %) 2.714.773 245.460 12.811 1.183.878 (57,077 %) (60,867 %) (61,765 %) 623.824 10.617,627 14.752 1.319.657 (65,725 %) (69,431 %) 3.014.805 (68,849 %) (63,637 %) (68,619 %) (47,306 %) 276.721 * Scenari D.Lgs .49/2010. I dati relativi ai tre scenari non vanno sommati; lo scenario di pericolosità P1, che rappresenta lo scenario massimo atteso ovvero la massima estensione delle aree inondabili, contiene infatti, al netto di alcune eccezioni, gli scenari P3 e P2
- 3. ISPRA - Istituto Superiore Protezione e Ricerca Ambientale https://idrogeo.isprambiente.it Dati di contesto Territorio Edifici 1.135.209 4.363.916 Popolazione 369.062 Imprese Famiglie 1.953.360 25.386,697 Km² Pericolosità e Indicatori di Rischio Pericolosità e indicatori di rischio Frane POPOLAZIONE FAMIGLIE EDIFICI IMPRESE Molto Elevata P4 Elevata P3 Media P2 Moderata P1 Aree Attenzione AA P4 + P3 Scenario P3 Tr. 20-50 anni Scenario P2 Tr. 100-200 anni Scenario P1 Tr. 300-500 anni Alluvioni* Beni culturali 14.617 TERRITORIO BENI CULTURALI POPOLAZIONE EDIFICI TERRITORIO IMPRESE FAMIGLIE BENI CULTURALI 697,659 36.843 (0,844 %) (2,748 %) 17.128 (0,877 %) 22.292 (1,964 %) 2.498 (0,677 %) 370 (2,531 %) Piemonte (0,91 %) 45.771 24.263 (1,049 %) (2,137 %) 3.360 (2,695 %) (1,077 %) 21.047 394 885,118 (3,487 %) (2,103 %) (1,475 %) 23.878 (1,487 %) (0,526 %) 64.891 133,514 (3,298 %) 5.442 (1,522 %) 29.729 482 (0 %) (0 %) (0 %) 0 (0 %) 0 (0,001 %) (0 %) 1 0 0,149 0 (0 %) (0 %) (0 %) 0 0 (0 %) (0 %) 0 0 1 0 (0 %) 1.582,777 82.614 (5,227 %) 5.858 (6,235 %) (4,101 %) 46.555 (1,587 %) (1,893 %) (1,954 %) 38.175 764 657 28.454 64.503 6.594 (1,457 %) 24.110 (1,478 %) (2,124 %) (4,495 %) (1,787 %) (5,075 %) 1.288,461 66.330 (4,896 %) (8,304 %) 2.108,229 (5,843 %) 213.655 18.957 1.353 94.115 (9,256 %) (5,137 %) (4,818 %) 180.351 3.294,874 2.857 309.170 (19,546 %) (16,032 %) 699.621 (15,828 %) (15,887 %) (16,109 %) (12,979 %) 59.453 * Scenari D.Lgs .49/2010. I dati relativi ai tre scenari non vanno sommati; lo scenario di pericolosità P1, che rappresenta lo scenario massimo atteso ovvero la massima estensione delle aree inondabili, contiene infatti, al netto di alcune eccezioni, gli scenari P3 e P2
- 4. ISPRA - Istituto Superiore Protezione e Ricerca Ambientale https://idrogeo.isprambiente.it Dati di contesto Territorio Edifici 604.234 1.639.362 Popolazione 117.588 Imprese Famiglie 676.777 24.099,453 Km² Pericolosità e Indicatori di Rischio Pericolosità e indicatori di rischio Frane POPOLAZIONE FAMIGLIE EDIFICI IMPRESE Molto Elevata P4 Elevata P3 Media P2 Moderata P1 Aree Attenzione AA P4 + P3 Scenario P3 Tr. 20-50 anni Scenario P2 Tr. 100-200 anni Scenario P1 Tr. 300-500 anni Alluvioni* Beni culturali 5.590 TERRITORIO BENI CULTURALI POPOLAZIONE EDIFICI TERRITORIO IMPRESE FAMIGLIE BENI CULTURALI 341,346 6.896 (0,421 %) (1,416 %) 2.975 (0,44 %) 3.729 (0,617 %) 457 (0,389 %) 101 (1,807 %) Sardegna (0,747 %) 15.054 8.337 (0,918 %) (1,38 %) 878 (3,989 %) (0,949 %) 6.422 223 1.307,988 (5,427 %) (6,977 %) (4,387 %) 42.159 (4,944 %) (10,862 %) 81.042 2.617,795 (10,215 %) 5.159 (5,106 %) 34.556 571 (14,099 %) (14,14 %) (16,722 %) 231.798 (13,649 %) 15.855 (9,159 %) (13,484 %) 101.038 763 2.207,317 95.420 (0 %) (0 %) (0 %) 0 0 (0 %) (0 %) 0 0 101.038 0 (0 %) 1.649,334 21.950 (5,796 %) 1.335 (6,844 %) (1,997 %) 12.066 (1,135 %) (1,339 %) (1,388 %) 9.397 324 352 32.202 78.485 6.613 (4,758 %) 29.574 (4,788 %) (4,894 %) (6,297 %) (5,624 %) (3,431 %) 826,899 45.459 (7,501 %) (4,041 %) 973,969 (7,523 %) 122.963 9.854 432 50.361 (7,728 %) (8,38 %) (7,441 %) 90.054 1.676,409 660 108.351 (11,807 %) (16,402 %) 268.893 (16,01 %) (14,904 %) (15,956 %) (6,956 %) 18.762 * Scenari D.Lgs .49/2010. I dati relativi ai tre scenari non vanno sommati; lo scenario di pericolosità P1, che rappresenta lo scenario massimo atteso ovvero la massima estensione delle aree inondabili, contiene infatti, al netto di alcune eccezioni, gli scenari P3 e P2
- 5. ISPRA - Istituto Superiore Protezione e Ricerca Ambientale https://idrogeo.isprambiente.it Dati di contesto Territorio Edifici 890.257 3.672.202 Popolazione 358.984 Imprese Famiglie 1.569.378 22.987,437 Km² Pericolosità e Indicatori di Rischio Pericolosità e indicatori di rischio Frane POPOLAZIONE FAMIGLIE EDIFICI IMPRESE Molto Elevata P4 Elevata P3 Media P2 Moderata P1 Aree Attenzione AA P4 + P3 Scenario P3 Tr. 20-50 anni Scenario P2 Tr. 100-200 anni Scenario P1 Tr. 300-500 anni Alluvioni* Beni culturali 18.594 TERRITORIO BENI CULTURALI POPOLAZIONE EDIFICI TERRITORIO IMPRESE FAMIGLIE BENI CULTURALI 724,933 32.431 (0,883 %) (3,154 %) 13.839 (0,882 %) 12.746 (1,432 %) 2.445 (0,681 %) 402 (2,162 %) Toscana (2,409 %) 121.437 49.548 (3,307 %) (5,566 %) 8.648 (5,851 %) (3,302 %) 51.816 1.088 2.982,952 (12,976 %) (9,605 %) (6,611 %) 85.513 (8,58 %) (9,983 %) 315.061 2.294,904 (12,074 %) 23.733 (8,158 %) 128.034 2.245 (16,245 %) (16,663 %) (18,322 %) 611.896 (21,857 %) 51.337 (20,565 %) (14,301 %) 163.113 4.064 4.727,253 254.949 (0,296 %) (0,382 %) (0,565 %) 55 5.850 (0,171 %) (0,159 %) 2.688 129,829 163.113 499 (0,139 %) 3.707,885 153.868 (8,013 %) 11.093 (16,13 %) (6,997 %) 62.294 (3,09 %) (4,19 %) (4,184 %) 65.655 1.490 1.388 113.073 271.208 28.923 (7,205 %) 67.939 (7,385 %) (7,631 %) (7,465 %) (8,057 %) (6,148 %) 1.413,166 197.612 (25,549 %) (12,157 %) 2.794,511 (22,197 %) 938.199 102.517 3.489 398.160 (18,764 %) (28,558 %) (25,371 %) 474.288 4.877,194 7.134 1.012.411 (38,367 %) (64,25 %) 2.359.397 (64,51 %) (53,275 %) (72,181 %) (21,217 %) 259.117 * Scenari D.Lgs .49/2010. I dati relativi ai tre scenari non vanno sommati; lo scenario di pericolosità P1, che rappresenta lo scenario massimo atteso ovvero la massima estensione delle aree inondabili, contiene infatti, al netto di alcune eccezioni, gli scenari P3 e P2
- 6. ISPRA - Istituto Superiore Protezione e Ricerca Ambientale https://idrogeo.isprambiente.it Dati di contesto Territorio Edifici 1.726.443 5.002.904 Popolazione 291.506 Imprese Famiglie 1.963.577 25.832,545 Km² Pericolosità e Indicatori di Rischio Pericolosità e indicatori di rischio Frane POPOLAZIONE FAMIGLIE EDIFICI IMPRESE Molto Elevata P4 Elevata P3 Media P2 Moderata P1 Aree Attenzione AA P4 + P3 Scenario P3 Tr. 20-50 anni Scenario P2 Tr. 100-200 anni Scenario P1 Tr. 300-500 anni Alluvioni* Beni culturali 8.411 TERRITORIO BENI CULTURALI POPOLAZIONE EDIFICI TERRITORIO IMPRESE FAMIGLIE BENI CULTURALI 379,533 48.187 (0,963 %) (1,469 %) 19.430 (0,99 %) 24.598 (1,425 %) 2.131 (0,731 %) 399 (4,744 %) Sicilia (0,716 %) 41.081 23.123 (0,821 %) (1,339 %) 2.088 (2,83 %) (0,876 %) 17.200 238 198,887 (0,77 %) (0,89 %) (0,407 %) 15.370 (0,473 %) (3,109 %) 23.663 803,069 (1,046 %) 1.186 (0,494 %) 9.703 88 (0,418 %) (0,408 %) (0,639 %) 20.414 (0,939 %) 1.010 (0,866 %) (0,346 %) 11.036 79 223,649 8.217 (4,506 %) (1,629 %) (0,804 %) 379 185.880 (3,788 %) (3,715 %) 74.383 207,589 11.036 16.057 (5,508 %) 578,42 89.268 (7,573 %) 4.219 (2,239 %) (2,764 %) 47.721 (1,447 %) (1,784 %) (1,865 %) 36.630 637 466 49.459 126.751 8.939 (2,519 %) 37.127 (2,534 %) (2,15 %) (5,54 %) (3,066 %) (1,568 %) 405,12 39.225 (2,629 %) (1,955 %) 504,981 (2,272 %) 131.545 9.490 473 51.293 (5,624 %) (3,256 %) (2,612 %) 42.153 581,072 475 53.689 (5,647 %) (2,754 %) 137.791 (2,734 %) (2,442 %) (3,386 %) (2,249 %) 9.870 * Scenari D.Lgs .49/2010. I dati relativi ai tre scenari non vanno sommati; lo scenario di pericolosità P1, che rappresenta lo scenario massimo atteso ovvero la massima estensione delle aree inondabili, contiene infatti, al netto di alcune eccezioni, gli scenari P3 e P2
- 7. ISPRA - Istituto Superiore Protezione e Ricerca Ambientale https://idrogeo.isprambiente.it Dati di contesto Territorio Edifici 750.522 1.959.050 Popolazione 117.904 Imprese Famiglie 772.977 15.221,614 Km² Pericolosità e Indicatori di Rischio Pericolosità e indicatori di rischio Frane POPOLAZIONE FAMIGLIE EDIFICI IMPRESE Molto Elevata P4 Elevata P3 Media P2 Moderata P1 Aree Attenzione AA P4 + P3 Scenario P3 Tr. 20-50 anni Scenario P2 Tr. 100-200 anni Scenario P1 Tr. 300-500 anni Alluvioni* Beni culturali 5.020 TERRITORIO BENI CULTURALI POPOLAZIONE EDIFICI TERRITORIO IMPRESE FAMIGLIE BENI CULTURALI 145,555 28.534 (1,457 %) (0,956 %) 11.991 (1,551 %) 16.888 (2,25 %) 1.242 (1,053 %) 297 (5,916 %) Calabria (1,357 %) 36.428 19.627 (1,859 %) (2,615 %) 1.600 (4,044 %) (1,928 %) 14.902 203 208,764 (1,371 %) (4,12 %) (2,483 %) 30.920 (3,353 %) (1,899 %) 65.689 288,985 (6,474 %) 2.927 (3,467 %) 26.798 325 (0,344 %) (0,325 %) (0,392 %) 6.362 (1,096 %) 269 (0,093 %) (0,228 %) 2.941 55 14,08 2.660 (0,139 %) (0,523 %) (0,317 %) 7 10.473 (0,523 %) (0,535 %) 4.039 48,249 2.941 424 (0,36 %) 354,319 64.962 (9,96 %) 2.842 (2,328 %) (4,865 %) 36.515 (2,41 %) (3,316 %) (3,479 %) 26.893 500 804 92.184 236.707 14.213 (11,926 %) 89.118 (12,083 %) (11,874 %) (16,016 %) (12,055 %) (17,113 %) 2.604,93 92.850 (12,763 %) (17,229 %) 2.622,579 (12,371 %) 250.035 15.506 828 97.464 (16,494 %) (13,151 %) (12,609 %) 102.096 2.661,288 891 110.295 (17,749 %) (14,424 %) 282.577 (14,269 %) (13,603 %) (15,514 %) (17,484 %) 18.292 * Scenari D.Lgs .49/2010. I dati relativi ai tre scenari non vanno sommati; lo scenario di pericolosità P1, che rappresenta lo scenario massimo atteso ovvero la massima estensione delle aree inondabili, contiene infatti, al netto di alcune eccezioni, gli scenari P3 e P2