Sales Forecasting Chart
•
0 likes•406 views

Get this template plus 350+ other premium business tools & templates at www.demandmetric.com

Recommended
More Related Content
Similar to Sales Forecasting Chart
Similar to Sales Forecasting Chart (20)
More from Demand Metric
More from Demand Metric (20)
Recently uploaded
Recently uploaded (15)
Sales Forecasting Chart
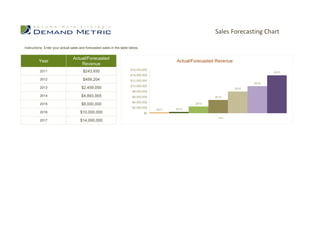
- 1. Sales Forecasting Chart Instructions: Enter your actual sales and forecasted sales in the table below. Actual/Forecasted Year Actual/Forecasted Revenue Revenue $16,000,000 2011 $243,930 2017 $14,000,000 2012 $459,204 $12,000,000 2016 $10,000,000 2013 $2,459,050 2015 $8,000,000 2014 $4,893,005 $6,000,000 2014 $4,000,000 2015 $8,000,000 2013 $2,000,000 2012 2011 2016 $10,000,000 $0 Year 2017 $14,000,000