Elliott wave and Fibonacci analysis on 011809
•
2 recomendaciones•475 vistas

Elliott wave zigzag, motive wave, corrective wave, counting waves, Fibonacci extension, Fibonacci retracement and nested waves are profiled in this report by TheMarketDetective.com

Recomendados
Más contenido relacionado
Último
Último (20)
Destacado
Destacado (20)
Elliott wave and Fibonacci analysis on 011809
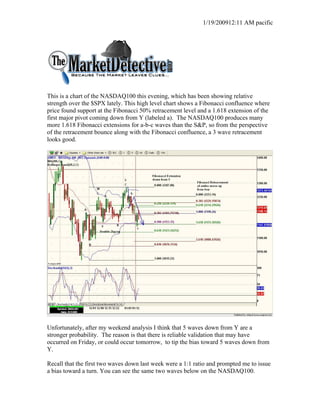
- 1. 1/19/200912:11 AM pacific This is a chart of the NASDAQ100 this evening, which has been showing relative strength over the $SPX lately. This high level chart shows a Fibonacci confluence where price found support at the Fibonacci 50% retracement level and a 1.618 extension of the first major pivot coming down from Y (labeled a). The NASDAQ100 produces many more 1.618 Fibonacci extensions for a-b-c waves than the S&P, so from the perspective of the retracement bounce along with the Fibonacci confluence, a 3 wave retracement looks good. Unfortunately, after my weekend analysis I think that 5 waves down from Y are a stronger probability. The reason is that there is reliable validation that may have occurred on Friday, or could occur tomorrow, to tip the bias toward 5 waves down from Y. Recall that the first two waves down last week were a 1:1 ratio and prompted me to issue a bias toward a turn. You can see the same two waves below on the NASDAQ100.
- 2. 1/19/200912:11 AM pacific Although I am not showing the Fibonacci ratio for it, wave 3 is a perfect 1.00 extension of wave 1. In Elliott wave analysis, wave 3 is the most commonly extended wave. The Elliott rule is that wave 3 cannot be the shortest wave, but it doesn’t have to be the longest. If there are 5 waves down from Y, than this is an extended 5th wave pattern since 1&3 are the same. I am showing the count for this probability on the chart. The fact that waves 2-5 are a 1.618 extension of wave 1 also supports this option. There is a characteristic behavior following a 5th wave extension that repeats with very high frequency and produces a very high probability outcome. The characteristic is that the entire retracement following a 5th wave extension, or, wave A of the retracement, will hit resistance at the high of wave (2). I have observed this phenomenon many times and it is very accurate. I have drawn a red horizontal at this level on the chart. Was 1202 on Friday close enough to the line (1206) to validate the phenomenon? Possibly, and if not, there is still the risk Extended 5th wave? that the wave (2) high is the turn. You can also see on the chart that it is a confluence with the .618 extension of the first wave up from 1140.
- 3. 1/19/200912:11 AM pacific If Price is able to break through this level, then the next target is1230 before a significant retracement or turn. The indexes are running in tandem so even if you are trading the S&P, you can play these levels in the NASDAQ100. TMD/DW The market detective provides personal market opinion based on sound technical analysis and research. However, no warranty is given or implied as to its true reliability. The market detective will make errors and mistakes. The market detective is not an investment adviser and is not making recommendations to buy, sell, or place orders relating to the futures contracts, ETFs, or stocks that he writes about. The responsibility for decisions made from information contained in this service are solely that of the individual subscriber. The individual must fully research and make his/her own decisions before acting on any information provided by the market detective. The market detective assumes no responsibility for subscriber investment or trading results.