SlideShare una empresa de Scribd logo
1 de 64
Page 1 of 64
1. Conceptualframework for financial reporting
In financial reporting, a conceptual framework is a theory of accounting prepared by a
standard-setting body against which practical problems can be tested objectively. A
conceptual framework deals with fundamental financial reporting issues such as the
objectives and users of financial statements, the characteristics that make accounting
information useful, the basic elements of financial statements (e.g., assets, liabilities, equity,
income, and expenses), and the concepts for recognizing and measuring these elements in the
financial statements.
First level: Basic objective
Financial reporting should provide information:
 That is useful to present and future investors, creditors who are making decision about
investment, credit or similar.
 That is useful to present and future investors, creditors in assessing the future cash
flows.
 About the economic resources of the organization, claims on those resources and
changes in them.
Page 2 of 64
Second level: Fundamental concepts
Second level of conceptual framework forms a bridge between why of accounting which is
the first level and how of accounting which is third level of accounting. Second level of
conceptual framework is consisting of:
2. Qualitative characteristics ofaccounting information:
Qualitative characteristics of accounting information are identified as a way to distinguish
more useful information from the less useful information for decision-making purpose.
Qualitative characteristics divided into two types:
Primary qualities: Relevance and reliability are two types of primary qualities which makes
accounting information more useful for decision-making purpose.
 Relevance of information means that the information must be capable of making a
difference in decision making. If the information does not make any difference in the
decision, then it will be irrelevant. For information to be relevant, it must have a
predictive or feedback value and must be presented in a timely basis. The Predictive
value of information means an information that help user to make a prediction about
past, present and future events. An information which helps a user to confirm prior
expectations is called the feedback value of that information. Timeliness means
information must be available to the user before it loses its capability to influence.
 Information is reliable when it is verifiable, faithfully represented and free from error
and bBAS. Verifiability helps user assure that information is faithfully represented.
An Information is faithful when it represents what really existed or happened and an
information is neutral, when it is free from error or bBAS.
Secondary qualities: Comparability and consistency are two types of secondary qualities
which influence the decision-making
 Information that has been measured and reported in a similar manner for different
enterprises is considered as comparable. Comparability lets a user identify the real
similarities and differences in economic phenomena.
 Consistency means a company should follow a particular method for similar events
from period to period. For example, if a company follows the straight line method to
charging depreciation, then it should always follow it.
Page 3 of 64
Elements of financial statement:
 Asset: Asset is a resource which can obtain the probable future economic benefit.
 Liability: Liability is a present obligation arising from past events. In other words,
liability is the claim against the asset.
 Expenses: Expense is an expenditure whose benefit is not fulfilled or enjoyed
immediately.
 Revenues: Revenue is the inflow of assets which results an increase of owners’ equity.
 Equity: Equity is the right to claim ownership when the company dissolves.
 Gain: Gain is an increase in the company asset which is not related to sales.
 Loss: Loss is a decrease in the company asset which is not related to sales.
Third level: Recognition and measurement concept
Third level consists of:
Basic assumption
 Economic entity: Economic entity means that the activity of a business enterprise can
be kept separate from its owner and any other business unit. The entity concept does
not necessarily refer to a legal entity.
 Going concern: The going concern assumption means that the organization will have a
long life. It will last long enough to fulfill its objectives and commitments.
 Monetary Unit: The monetary unit assumption explains money is the common
denominator of an economic activity. The monetary unit is relevant, simple,
universally available, understandable and useful.
 Periodicity: Periodicity assumption explains that the economic activity of an
organization can be divided into artificial time periods. These artificial time periods
can vary depending on the organization but most commonly used time periods are
monthly, quarterly and yearly.
Basic principles
 Historical cost: Historical cost principle explains that an asset should be recorded at
its cost price (purchase price). It also includes all the cost that was necessary to get the
asset ready for use. Historical cost helps an organization distinguish an asset’s original
cost from its current cost.
 Revenue recognition: Revenue recognition principle states that revenue is recognized
when it is earned. For example, ABC Company got an order to produce three hundred
shirts. ABC Company will recognize the revenue when they will actually deliver the
order and receive the payment.
Page 4 of 64
 Matching principle: Matching principle means expense is recognized at the time
revenue is recognized. For example, ABC Company will recognize the cost of
producing three hundred shirts when produced shirts will make a contribution to
revenue.
 Full disclosure: Full disclosure principle holds that organization should provide all the
information that is important enough to make a change in judgment or decision of the
user.
Constraints:
 Cost Benefit Relationship: The costs of providing the information must be weighed
against the benefits that can be derived from using the information.
 Materiality: Sound and acceptable standards should be followed if the amount
involved is significant when compared with the other revenues and expenses, assets
and liabilities, or net income of the entity.
 Industry Practices: Follow the general practices in the firm's industry, which
sometimes requires departure from basic theory.
 Conservatism: Conservatism means when in doubt, choose the solution that will be
least likely to overstate assets and income.
3. List of BAS& BFRS
BAS
No.
1
BAS Title
Presentation of Financial Statements
BAS Effective Date
on or after 1 Jan 2010
2 Inventories
on or after 1 January
2007
7 Statement of Cash Flows
on or after 1 January
1999
8
Accounting Policies, Changes in Accounting Estimates and
Errors
on or after 1 January
2007
10
Events after the Reporting
Period
on or after 1 January
1999
11 Construction Contracts
on or after 1 January
1999
Page 5 of 64
12 Income Taxes
on or after 1 January
1999
16 Property, Plant & Equipment
on or after 1 January
2007
17 Leases
on or after 1 January
2007
18 Revenue
on or after 1 January
2007
19 Employee Benefits
on or after 1 January
2013
20
Accounting of Government Grants and Disclosure of
Government Assistance
on or after 1 January
1999
21 The Effects of Changes in Foreign Exchange Rates
on or after 1 January
2007
23 Borrowing Costs
on or after 1 January
2010
24 Related Party Disclosures
on or after 1 January
2007
26 Accounting and Reporting by Retirement Benefit Plans
on or after 1 January
2007
27 Separate Financial Statements
on or after 1 January
2013
28 Investments in Associates and Joint Ventures
on or after 1 January
2013
BAS
29
Financial Reporting in Hyperinflationary Economics
on or after 1 January
2015
31 Interest in Joint Ventures
on or after 1 January
2007
32 Financial Instruments: Presentation
on or after 1 January
2010
33 Earnings per Share
on or after 1 January
2007
34 Interim Financial Reporting
on or after 1 January
1999
36 Impairment of Assets
on or after 1st January
2005
37 Provisions, Contingent Liabilities and Contingent Assets
on or after 1 January
2007
38 Intangible Assets
on or after 1 January
2005
39 Financial Instruments: Recognition and Measurement
on or after 1 January
2010
40 Investment Property
on or after 1 January
2007
41 Agriculture
on or after 1 January
2007
Page 6 of 64
4. BFRS with details
Bangladesh Financial Reporting Standard 1
First-time Adoption of Bangladesh Financial Reporting Standards
Objective
1 The objective of this BFRS is to ensure that an entity’s first BFRS financial
statements, and its interim financial reports for part of the period covered by those
financial statements, contain high quality information that:
(a) is transparent for users and comparable over all periods presented;
(b) provides a suitable starting point for accounting in accordance with
Bangladesh Financial Reporting Standards (BFRSs); and
(c) Can be generated at a cost that does not exceed the benefits.
BFRS /
BFRS
Title Effective Date on or after
BFRS 1
First-time adoption of International Financial
Reporting Standards
1 January 2009
BFRS 2 Share-based Payment 1 January 2007
BFRS 3 Business Combinations 1 January 2010
BFRS 4 Insurance Contracts 1 January 2010
BFRS 5
Non-current Assets Held for Sale and
Discontinued Operations
1 January 2007
BFRS 6
Exploration for and Evaluation of Mineral
Resources
1 January 2007
BFRS 7 Financial Instruments: Disclosures 1 January 2010
BFRS 8 Operating Segments 1 January 2010
BFRS 9 Financial Instruments
NA (Not yet adopted but under review
process)
BFRS
10
Consolidated Financial Statements 1 January 2013
BFRS
11
Joint Arrangements 1 January 2013
BFRS
12
Disclosure of Interests in other Entities 1 January 2013
BFRS
13
Fair Value Measurement 1 January 2013
Page 7 of 64
Scope
2 An entity shall apply this BFRS in:
(a) its first BFRS financial statements; and
(b) each interim financial report, if any, that it presents in accordance with
BAS 34 Interim Financial Reporting for part of the period covered by its
first BFRS financial statements.
3 An entity’s first BFRS financial statements are the first annual financial
statements in which the entity adopts BFRSs, by an explicit and unreserved
statement in those financial statements of compliance with BFRSs. Financial
statements in accordance with BFRSs are an entity’s first BFRS financial
statements if, for example, the entity:
(a) presented its most recent previous financial statements:
(i) in accordance with national requirements that are not consistent
with BFRSs in all respects;
(ii) in conformity with BFRSs in all respects, except that the financial
statements did not contain an explicit and unreserved statement
that they complied with BFRSs;
(iii) containing an explicit statement of compliance with some, but not all,
BFRSs;
(iv) in accordance with national requirements inconsistent with
BFRSs, using some individual BFRSs to account for items for
which national requirements did not exist; or
(v) in accordance with national requirements, with a reconciliation of
some amounts to the amounts determined in accordance with
BFRSs;
(b) prepared financial statements in accordance with BFRSs for internal use
only, without making them available to the entity’s owners or any other
external users;
(c) prepared a reporting package in accordance with BFRSs for consolidation
purposes without preparing a complete set of financial statements as
defined in BAS 1 Presentation of Financial Statements (as revised in
2007); or
(d) did not present financial statements for previous periods.
4 This BFRS applies when an entity first adopts BFRSs. It does not apply when, for
example, an entity:
(a) stops presenting financial statements in accordance with national
requirements, having previously presented them as well as another set of
financial statements that contained an explicit and unreserved statement of
compliance with BFRSs;
Page 8 of 64
Definition of share-based payment
A share-based payment is a transaction in which the entity receives goods or services either
as consideration for its equity instruments or by incurring liabilities for amounts based on the
price of the entity's shares or other equity instruments of the entity. The accounting
requirements for the share-based payment depend on how the transaction will be settled, that
is, by the issuance of (a) equity, (b) cash, or (c) equity or cash.
Scope
The concept of share-based payments is broader than employee share options. BFRS 2
encompasses the issuance of shares, or rights to shares, in return for services and goods.
Examples of items included in the scope of BFRS 2 are share appreciation rights, employee
share purchase plans, employee share ownership plans, share option plans and plans where
the issuance of shares (or rights to shares) may depend on market or non-market related
conditions.
BFRS 2 applies to all entities. There is no exemption for private or smaller entities.
Furthermore, subsidiaries using their parent's or fellow subsidiary's equity as consideration
for goods or services are within the scope of the Standard.
There are two exemptions to the general scope principle:
 First, the issuance of shares in a business combination should be accounted for under
BFRS 3Business Combinations. However, care should be taken to distinguish share-
based payments related to the acquisition from those related to continuing employee
services
 Second, BFRS 2 does not address share-based payments within the scope of
paragraphs 8-10 of BAS 32Financial Instruments: Presentation, or paragraphs 5-7 of
BAS 39Financial Instruments: Recognition and Measurement. Therefore, BAS 32
and BAS 39 should be applied for commodity-based derivative contracts that may be
settled in shares or rights to shares.
BFRS 2 Share-based Payment
Page 9 of 64
Background
BFRS 3 (2008) seeks to enhance the relevance, reliability and comparability of information
provided about business combinations (e.g. acquisitions and mergers) and their effects. It sets
out the principles on the recognition and measurement of acquired assets and liabilities, the
determination of goodwill and the necessary disclosures.
Scope
BFRS 3 must be applied when accounting for business combinations, but does not apply to:
 The formation of a joint venture* [BFRS 3.2(a)]
 The acquisition of an asset or group of assets that is not a business, although general
guidance is provided on how such transactions should be accounted for [BFRS 3.2(b)]
 Combinations of entities or businesses under common control (the BASB has a
separate agenda project on common control transactions) [BFRS 3.2(c)]
 Acquisitions by an investment entity of a subsidiary that is required to be measured at
fair value through profit or loss under BFRS 10 Consolidated Financial Statements.
[BFRS 3.2A]
Definition of insurance contract
An insurance contract is a "contract under which one party (the insurer) accepts significant
insurance risk from another party (the policyholder) by agreeing to compensate the
policyholder if a specified uncertain future event (the insured event) adversely affects the
policyholder." [BFRS4.Appendix A]
Accounting policies
The BFRS exempts an insurer temporarily (until completion of Phase II of the Insurance
Project) from some requirements of other BFRSs, including the requirement to consider BAS
8Accounting Policies, Changes in Accounting Estimates and Errors in selecting accounting
policies for insurance contracts. However, the standard: [BFRS 4.14]
 prohibits provisions for possible claims under contracts that are not in existence at the
reporting date (such as catastrophe and equalization provisions)
BFRS 3 Business Combinations
BFRS 4 Insurance Contracts
Page 10 of 64
 requires a test for the adequacy of recognized insurance liabilities and an impairment
test for reinsurance assets
 requires an insurer to keep insurance liabilities in its balance sheet until they are
discharged or cancelled, or expire, and prohibits offsetting insurance liabilities against
related reinsurance assets and income or expense from reinsurance contracts against
the expense or income from the related insurance contract.
Changes in accounting policies
BFRS 4 permits an insurer to change its accounting policies for insurance contracts only if, as
a result, its financial statements present information that is more relevant and no less reliable,
or more reliable and no less relevant. [BFRS 4.22] In particular, an insurer cannot introduce
any of the following practices, although it may continue using accounting policies that
involve them: [BFRS 4.25]
 measuring insurance liabilities on an undiscounted basis
 measuring contractual rights to future investment management fees at an amount that
exceeds their fair value as implied by a comparison with current market-based fees for
similar services
 using non-uniform accounting policies for the insurance liabilities of subsidiaries.
Key provisions of BFRS 5 relating to assets held for sale
Held-for-sale classification
In general, the following conditions must be met for an asset (or 'disposal group') to be
classified as held for sale: [BFRS 5.6-8]
 management is committed to a plan to sell
 the asset is available for immediate sale
 an active programmer to locate a buyer is initiated
 the sale is highly probable, within 12 months of classification as held for sale (subject
to limited exceptions)
 the asset is being actively marketed for sale at a sales price reasonable in relation to its
fair value
 actions required to complete the plan indicate that it is unlikely that plan will be
significantly changed or withdrawn
BFRS 5 Non-current Assets Held for Sale and Discontinued Operations
Page 11 of 64
The assets need to be disposed of through sale. Therefore, operations that are expected to be
wound down or abandoned would not meet the definition (but may be classified as
discontinued once abandoned). [BFRS 5.13]
An entity that is committed to a sale involving loss of control of a subsidiary that qualifies for
held-for-sale classification under BFRS 5 classifies all of the assets and liabilities of that
subsidiary as held for sale, even if the entity will retain a non-controlling interest in its former
subsidiary after the sale. [BFRS 5.8A]
Held for distribution to owner’s classification
The classification, presentation and measurement requirements of BFRS 5 also apply to a
non-current asset (or disposal group) that is classified as held for distribution to owners.
[BFRS 5.5A and IFRIC 17] The entity must be committed to the distribution, the assets must
be available for immediate distribution and the distribution must be highly probable. [BFRS
5.12A]
Disposal group concept
A 'disposal group' is a group of assets, possibly with some associated liabilities, which an
entity intends to dispose of in a single transaction. The measurement basis required for non-
current assets classified as held for sale is applied to the group as a whole, and any resulting
impairment loss reduces the carrying amount of the non-current assets in the disposal group
in the order of allocation required by BAS 36. [BFRS 5.4]
Definitions
Exploration for and evaluation of mineral resources means the search for mineral resources,
including minerals, oil, natural gas and similar non-regenerative resources after the entity has
obtained legal rights to explore in a specific area, as well as the determination of the technical
feasibility and commercial viability of extracting the mineral resource.
Exploration and evaluation expenditures are expenditures incurred in connection with the
exploration and evaluation of mineral resources before the technical feasibility and
commercial viability of extracting a mineral resource is demonstrable.
Accounting policies for exploration and evaluation
BFRS 6 permits an entity to develop an accounting policy for recognition of exploration and
evaluation expenditures as assets without specifically considering the requirements of
paragraphs 11 and 12 of BAS 8Accounting Policies, Changes in Accounting Estimates and
Errors. [BFRS 6.9] Thus, an entity adopting BFRS 6 may continue to use the accounting
BFRS 6 Exploration for and Evaluation of Mineral Resources
Page 12 of 64
policies applied immediately before adopting the BFRS. This includes continuing to use
recognition and measurement practices that are part of those accounting policies.
Impairment
BFRS 6 effectively modifies the application of BAS 36Impairment of Assets to exploration
and evaluation assets recognized by an entity under its accounting policy. Specifically:
 Entities recognizing exploration and evaluation assets are required to perform an
impairment test on those assets when specific facts and circumstances outlined in the
standard indicate an impairment test is required. The facts and circumstances outlined
in BFRS 6 are non-exhaustive, and are applied instead of the 'indicators of
impairment' in BAS 36 [BFRS 6.19-20]
 Entities are permitted to determine an accounting policy for allocating exploration and
evaluation assets to cash-generating units or groups of CGUs. [BFRS 6.21] This
accounting policy may result in a different allocation than might otherwise arise on
applying the requirements of BAS 36
 If an impairment test is required, any impairment loss is measured, presented and
disclosed in accordance with BAS 36. [BFRS 6.18]
BFRS 7:
 adds certain new disclosures about financial instruments to those previously required
by BAS 32mFinancial Instruments: Disclosure and Presentation (as it was then cited)
 replaces the disclosures previously required by BAS 30 Disclosures in the Financial
Statements of Banks and Similar Financial Institutions
 puts all of those financial instruments disclosures together in a new standard on
Financial Instruments: Disclosures. The remaining parts of BAS 32 deal only with
financial instruments presentation matters.
BFRS 7 Financial Instruments: Disclosures
Page 13 of 64
Disclosure requirements of BFRS 7
BFRS requires certain disclosures to be presented by category of instrument based on the
BAS 39 measurement categories. Certain other disclosures are required by class of financial
instrument. For those disclosures an entity must group its financial instruments into classes of
similar instruments as appropriate to the nature of the information presented. [BFRS 7.6]
The two main categories of disclosures required by BFRS 7 are:
1. information about the significance of financial instruments.
2. information about the nature and extent of risks arising from financial instruments
Information about the significance of financial instruments
Statement of financial position
 Disclose the significance of financial instruments for an entity's financial position and
performance. [BFRS 7.7] This includes disclosures for each of the following
categories: [BFRS 7.8]
o financial assets measured at fair value through profit and loss, showing
separately those held for trading and those designated at initial recognition
o held-to-maturity investments
o loans and receivables
o available-for-sale assets
o financial liabilities at fair value through profit and loss, showing separately
those held for trading and those designated at initial recognition
o financial liabilities measured at amortized cost
Scope
BFRS 8 applies to the separate or individual financial statements of an entity (and to the
consolidated financial statements of a group with a parent):
 whose debt or equity instruments are traded in a public market or
 that files, or is in the process of filing, its (consolidated) financial statements with a
securities commission or other regulatory organization for the purpose of issuing any
class of instruments in a public market [BFRS 8.2]
However, when both separate and consolidated financial statements for the parent are
presented in a single financial report, segment information need be presented only on the
basis of the consolidated financial statements [BFRS 8.4]
BFRS 8 Operating Segments
Page 14 of 64
Operating segments
BFRS 8 defines an operating segment as follows. An operating segment is a component of an
entity: [BFRS 8.2]
 that engages in business activities from which it may earn revenues and incur
expenses (including revenues and expenses relating to transactions with other
components of the same entity)
 whose operating results are reviewed regularly by the entity's chief operating decision
maker to make decisions about resources to be allocated to the segment and assess its
performance and
 for which discrete financial information is available
Reportable segments
BFRS 8 requires an entity to report financial and descriptive information about its reportable
segments. Reportable segments are operating segments or aggregations of operating segments
that meet specified criteria: [BFRS 8.13]
 its reported revenue, from both external customers and intersegment sales or transfers,
is 10 per cent or more of the combined revenue, internal and external, of all operating
segments, or
 the absolute measure of its reported profit or loss is 10 per cent or more of the greater,
in absolute amount, of (i) the combined reported profit of all operating segments that
did not report a loss and (ii) the combined reported loss of all operating segments that
reported a loss, or
 its assets are 10 per cent or more of the combined assets of all operating segments.
Two or more operating segments may be aggregated into a single operating segment if
aggregation is consistent with the core principles of the the standard, the segments have
similar economic characteristics and are similar in various prescribed respects. [BFRS 8.12]
If the total external revenue reported by operating segments constitutes less than 75 per cent
of the entity's revenue, additional operating segments must be identified as reportable
segments (even if they do not meet the quantitative thresholds set out above) until at least 75
per cent of the entity's revenue is included in reportable segments.
Page 15 of 64
Initial measurement of financial instruments
All financial instruments are initially measured at fair value plus or minus, in the case of a
financial asset or financial liability not at fair value through profit or loss, transaction costs.
[BFRS 9, paragraph 5.1.1]
Subsequent measurement of financial assets
BFRS 9 divides all financial assets that are currently in the scope of BAS 39 into two
classifications - those measured at amortized cost and those measured at fair value.
Where assets are measured at fair value, gains and losses are either recognized entirely in
profit or loss (fair value through profit or loss, FVTPL), or recognized in other
comprehensive income (fair value through other comprehensive income, FVTOCI).
For debt instruments the FVTOCI classification is mandatory for certain assets unless the fair
value option is elected. Whilst for equity investments, the FVTOCI classification is an
election. Furthermore, the requirements for reclassifying gains or losses recognized in other
comprehensive income are different for debt instruments and equity investments.
The classification of a financial asset is made at the time it is initially recognized, namely
when the entity becomes a party to the contractual provisions of the instrument. [BFRS 9,
paragraph 4.1.1] If certain conditions are met, the classification of an asset may subsequently
need to be reclassified.
Debt instruments
A debt instrument that meets the following two conditions must be measured at amortised
cost (net of any write down for impairment) unless the asset is designated at FVTPL under
the fair value option
model test: The objective of the entity's business model is to hold the financial
asset to collect the contractual cash flows (rather than to sell the instrument prior to its
contractual maturity to realize its fair value changes).
flow characteristics test: The contractual terms of the financial asset give rise on
specified dates to cash flows that are solely payments of principal and interest on the
principal amount outstanding.
BFRS 9 Financial Instruments
Page 16 of 64
The objective of BFRS 10 is to establish principles for the presentation and preparation of
consolidated financial statements when an entity controls one or more other entities. [BFRS
10:1]
The Standard: [BFRS 10:1]
 requires a parent entity (an entity that controls one or more other entities) to present
consolidated financial statements
 defines the principle of control, and establishes control as the basis for consolidation
 set out how to apply the principle of control to identify whether an investor controls
an investee and therefore must consolidate the investee
 sets out the accounting requirements for the preparation of consolidated financial
statements
 defines an investment entity and sets out an exception to consolidating particular
subsidiaries of an investment entity
Changes in ownership interests
Changes in a parent's ownership interest in a subsidiary that do not result in the parent losing
control of the subsidiary are equity transactions (i.e. transactions with owners in their
capacity as owners). When the proportion of the equity held by non-controlling interests
changes, the carrying amounts of the controlling and non-controlling interests area adjusted to
reflect the changes in their relative interests in the subsidiary. Any difference between the
amount by which the non-controlling interests are adjusted and the fair value of the
consideration paid or received is recognized directly in equity and attributed to the owners of
the parent
Joint arrangements
A joint arrangement is an arrangement of which two or more parties have joint control.
[BFRS 11:4]
A joint arrangement has the following characteristics: [BFRS 11:5]
 the parties are bound by a contractual arrangement, and
 the contractual arrangement gives two or more of those parties joint control of the
arrangement.
BFRS 10 Consolidated Financial Statements
BFRS 11 Joint Arrangements
Page 17 of 64
A joint arrangement is either a joint operation or a joint venture. [BFRS 11:6]
Joint control
Joint control is the contractually agreed sharing of control of an arrangement, which exists
only when decisions about the relevant activities require the unanimous consent of the parties
sharing control. [BFRS 11:7]
Before assessing whether an entity has joint control over an arrangement, an entity first
assesses whether the parties, or a group of the parties, control the arrangement (in accordance
with the definition of control in BFRS 10Consolidated Financial Statements). [BFRS 11:B5]
After concluding that all the parties, or a group of the parties, control the arrangement
collectively, an entity shall assess whether it has joint control of the arrangement. Joint
control exists only when decisions about the relevant activities require the unanimous consent
of the parties that collectively control the arrangement. [BFRS 11:B6]
The requirement for unanimous consent means that any party with joint control of the
arrangement can prevent any of the other parties, or a group of the parties, from making
unilateral decisions (about the relevant activities) without its consent. [BFRS 11:B9]
Types of joint arrangements
Joint arrangements are either joint operations or joint ventures:
 A joint operation is a joint arrangement whereby the parties that have joint control of
the arrangement have rights to the assets, and obligations for the liabilities, relating to
the arrangement. Those parties are called joint operators. [BFRS 11:15]
 A joint venture is a joint arrangement whereby the parties that have joint control of
the arrangement have rights to the net assets of the arrangement. Those parties are
called joint ventures. [BFRS 11:16]
Objective and scope
The objective of BFRS 12 is to require the disclosure of information that enables users of
financial statements to evaluate: [BFRS 12:1]
 the nature of, and risks associated with, its interests in other entities
 the effects of those interests on its financial position, financial performance and cash
flows.
Where the disclosures required by BFRS 12, together with the disclosures required by other
BFRSs, do not meet the above objective, an entity is required to disclose whatever additional
information is necessary to meet the objective. [BFRS 12:3]
BFRS 12 Disclosure of Interests in other Entities
Page 18 of 64
BFRS 12 is required to be applied by an entity that has an interest in any of the following:
[BFRS 12:5]
 subsidiaries
 joint arrangements (joint operations or joint ventures)
 associates
 unconsolidated structured entities
BFRS 12 does not apply to certain employee benefit plans, separate financial statements to
which BAS 27Separate Financial Statements applies (except in relation to unconsolidated
structured entities and investment entities in some cases), certain interests in joint ventures
held by an entity that does not share in joint control, and the majority of interests in another
entity accounted for in accordance with BFRS 9Financial Instruments. [BFRS 12:6]
An investment entity that prepares financial statements in which all of its subsidiaries are
measured at fair value through profit or loss presents the disclosures relating to investment
entities required by BFRS 12.
Objective
BFRS 13: [BFRS 13:1]
 defines fair value
 sets out in a single BFRS a framework for measuring fair value
 requires disclosures about fair value measurements.
BFRS 13 applies when another BFRS requires or permits fair value measurements or
disclosures about fair value measurements (and measurements, such as fair value less costs to
sell, based on fair value or disclosures about those measurements), except for: [BFRS 13:5-7]
 share-based payment transactions within the scope of BFRS 2Share-based Payment
 leasing transactions within the scope of BAS 17Leases
 measurements that have some similarities to fair value but that are not fair value, such
as net realizable value in BAS 2Inventories or value in use in BAS 36Impairment of
Assets.
BFRS 13 Fair Value Measurement
Page 19 of 64
Fair value hierarchy
Overview
BFRS 13 seeks to increase consistency and comparability in fair value measurements and
related disclosures through a 'fair value hierarchy'. The hierarchy categorizes the inputs used
in valuation techniques into three levels. The hierarchy gives the highest priority to
(unadjusted) quoted prices in active markets for identical assets or liabilities and the lowest
priority to unobservable inputs. [BFRS 13:72]
If the inputs used to measure fair value are categorized into different levels of the fair value
hierarchy, the fair value measurement is categorized in its entirety in the level of the lowest
level input that is significant to the entire measurement (based on the application of
judgment). [BFRS 13:73]
Level 1 inputs
Level 1 inputs are quoted prices in active markets for identical assets or liabilities that the
entity can access at the measurement date. [BFRS 13:76]
A quoted market price in an active market provides the most reliable evidence of fair value
and is used without adjustment to measure fair value whenever available, with limited
exceptions. [BFRS 13:77]
If an entity holds a position in a single asset or liability and the asset or liability is traded in an
active market, the fair value of the asset or liability is measured within Level 1 as the product
of the quoted price for the individual asset or liability and the quantity held by the entity, even
if the market's normal daily trading volume is not sufficient to absorb the quantity held and
placing orders to sell the position in a single transaction might affect the quoted price. [BFRS
13:80]
Level 2 inputs
Level 2 inputs are inputs other than quoted market prices included within Level 1 that are
observable for the asset or liability, either directly or indirectly. [BFRS 13:81]
Level 2 inputs include:
 quoted prices for similar assets or liabilities in active markets
 quoted prices for identical or similar assets or liabilities in markets that are not active
 inputs other than quoted prices that are observable for the asset or liability, for
example
o interest rates and yield curves observable at commonly quoted intervals
o implied volatilities
o credit spreads
 inputs that are derived principally from or corroborated by observable market data by
correlation or other means ('market-corroborated inputs').
Page 20 of 64
5. Annual report Analyze (ACI) 2010-2014
Brief History
ACI was established as the subsidiary of Imperial Chemical Industries (ICI) in the then East
Pakistan in 1968. After independence the company has been incorporated in Bangladesh on
the 24th of January 1973 as ICI Bangladesh Manufacturers Limited and also as Public
Limited Company. This Company also obtained listing with Dhaka Stock Exchange on 28
December, 1976 and its first trading of shares took place on 9 March, 1994. Later on 5 May,
1992, ICI plc divested 70% of its shareholding to local management. Subsequently the
company was registered in the name of Advanced Chemical Industries Limited. Listing with
Chittagong Stock Exchange was made on 22 October 1995
Advanced Chemical Industries (ACI) Limited is one of the leading conglomerates in
Bangladesh, with a multinational heritage. The company has diversified into four major
Strategic Business Units
Mission
ACI’s mission is to enrich the quality of life of people through responsible application of
knowledge, skills and technology. ACI is committed to the pursuit of excellence through
Page 21 of 64
world-class products, innovative processes and empowered employees to provide the highest
level of satisfaction to its customers.
Vision
To realize the mission ACI will:
 Endeavor to attain a position of leadership in each category of its businesses.
 Attain a high level of productivity in all its operations through effective and efficient
use of resources, adoption of appropriate technology and alignment with our core
competencies.
 Develop its employees by encouraging empowerment and rewarding innovation.
 Promote an environment for learning and personal growth of its employees.
 Provide products and services of high and consistent quality, ensuring value for
money to its customers.
 Encourage and assist in the qualitative improvement of the services of its suppliers
and distributors.
 Establish harmonious relationship with the community and promote greater
environmental responsibility within its sphere of influence
ACI Quality Policy
One of our important visions is to provide products and services of high and consistent
quality, ensuring value for money to our customers.
To attain the Vision ACI will:
 Aim to achieve business excellence by understanding, accepting, meeting and
exceeding customer expectations.
 Follow International Standards on Quality Management System to ensure consistent
quality of products and services to achieve customer satisfaction.
 ACI will also meet all national and regulatory requirements relating to its current
businesses and ensure that current Good Manufacturing Practice (cGMP) as
recommended by World Health Organization is followed for its pharmaceutical
operations and conform to all other guidelines and best practices relating to its other
businesses.
 Commit itself to quality as the prime consideration in all its business decisions. All
employees of ACI follow documented procedures to ensure compliance with quality
standards.
 Develop a pool of human resources of the Company to their full potential through
regular training and participation in seeking continuous improvement of the Quality
Management System.
Page 22 of 64
ACI Group’s five Years Comparative Statistics From 2010-2014
5.1. Financial Ratio Analysis
Financial ratios are useful indicators of a firm's performance and financial situation. Most of
the ratios can be calculated from information provided in the financial statements.
Objectives of Financial Ratio Analysis:

To analyze the financial statements of ACI Ltd.



To calculate the different types of financial ratios of the company.



To know the financial condition of the company.


To know the company’s financial development for last five years
5.1.1Methodology
For calculating different types of ratios for the project work, the following formulae were
used:
Liquidity Ratios:
1. Current Ratio =
CURRENT ASSETS
CURRENT LIABILITIES
It’s a measures a company’s ability to meet short term obligations with short term assets, a
useful indicator of cash flow in the near future. A social enterprise needs to ensure that it can
pay its salaries, bills and expenses on time. Failure to pay loans on time may limit your future
access to credit and therefore your ability to leverage operations and growth. The one
problem with the current ratio is that it does not take into account the timing of cash flows.
Page 23 of 64
2. Quick Ratio (Acid-Test Ratio) =
QUICK ASSETS
CURRENT LIABILITIES
A more stringent liquidity test that indicates if a firm has enough short-term assets (without
selling inventory) to cover its immediate liabilities. This is often referred to as the “acid test”
because it only looks at the company’s most liquid assets only (excludes inventory) that can
be quickly converted to cash). A ratio of 1:1 means that a company can pay its bills without
having to sell inventory.
3. Working Capital = Current Asset – Current Liabilities
Working Capital is a measure of both a company's efficiency and its short-term financial
health.
Activity Ratios:
1. Inventory Turnover Ratio :- Sales or revenue/
inventory
It is the calculation the number of times inventory is turning over into sales during the year or
how many days it takes to sell inventory. This is a good indication of production and
purchasing efficiency. A high ratio indicates inventory is selling quickly and that little unused
inventory is being stored (or could also mean inventory shortage). If the ratio is low, it
suggests overstocking, obsolete inventory or selling issues.
2. Total Asset Turnover Ratio:- Sales or revenue/ total
asset
Total Asset Turnover Ratio is the company's total revenue, the invoice, cash payments and
other revenues. Total Asset Turnover Ratio represents the value of goods and services
provided to customers during a specified time period - usually one year. How efficiently a
business generates sales on each currency of assets. An increasing ratio indicates a company
is using its assets more productively.
3. Days Sales Outstanding (DSO) = ( Accounts Receivable / total sales ) *No.ofDAYS
It is a measurement of the average number of days that a company takes to collect revenue
Page 24 of 64
after a sale has been made. A low DSO number means that it takes a company fewer days to
collect its accounts receivable. A high DSO number shows that a company is selling its
product to customers on credit and taking longer to collect money.
4. Average Payment Period = (ACCOUNTSPAYABLE  NO. OF
DAYS) NET PURCHASES or COGS
The average time period in which a business or company typically takes in paying off its
purchases that have been made by credit. This will not have an effect on the company's
working capital. A shorter payment period indicates prompt payments to creditors.
Leverage Ratios:
1. Debt Ratio =
TOTAL DEBT
100
TOTAL ASSET
It is a financial ratio that measures the extent of a company’s or consumer’s leverage. The
debt ratio is defined as the ratio of total debt to total assets, expressed in percentage, and can
be interpreted as the proportion of a company’s assets that are financed by debt. The higher
this ratio, the more leveraged the company and the greater its financial risk.
Profitability Ratios:
1. Net Profit Ratio =
NET PROFIT
SALES or REVENUE
A ratio of profitability calculated as net income divided by revenues, or net profits divided by
sales. It measures how much out of every currency of sales a company actually keeps in
earnings.
Profit margin is very useful when comparing companies in similar industries. A higher profit
margin indicates a more profitable company that has better control over its costs compared to
its competitors. This ratio measures your ability to cover all operating costs including indirect
costs
Page 25 of 64
2. Return on Equity = NET INCOMEAVAILABLE FOR COMMONSTOCKHOLDERS
STOCKHOLDER'S EQUITY
The amount of net income returned as a percentage of shareholders equity. Return on equity
measures a corporation's profitability by revealing how much profit a company generates
with the money shareholders have invested. This is one of the most important ratios to
investors. How does this return compare to less risky investments like bonds.
3. Return on Assets (ROA) = NET INCOME
TOTAL ASSET
It’s a measurement of the ability of a company to turn the assets into profit. This is a very
useful measure of comparison within an industry. A low ratio compared to industry may
mean that your competitors have found a way to operate more efficiently. After tax interest
expense can be added back to numerator since ROA measures profitability on all assets
whether or not they are financed by equity or debt.
4. Earnings per Share (EPS) = NET INCOME
TOTAL NO. OF COMMON STOCK OUTSTANDING
The portion of a company's profit allocated to each outstanding share of common stock.
Earnings per share serve as an indicator of a company's profitability.
6. Analysis of the ratios
6.1. Liquidity ratio
Ratio 2010 2011 2012 2013 2014
Current Ratio (Times) 1.42 2.09 1.17 1.17 1.19
Page 26 of 64
Quick Ratio (Times) 1.00 0.98 0.87 0.85 0.83
Working Capital (Taka) 1713.96 5780.92 1232.99 1360.28 1568.37
Graphical presentationof different types of Liquidity Ratios:
1. Current Ratio:
Current ratio is used to gauge the ability of a company to meet its liabilities with its assets.
This ratio gives an idea about the financial health of an organization. The higher ratio reflects
the more capability of a company to pay its liabilities. Current ratio of ACI Limited is 1.19
times in 2014 and was relatively stable in the past five years except in 2011. The ratio was
highest in 2011. Current ratio of 2014 suggests that the company is liquid and in a good
position to meet its current obligations.
2. Quick Ratio:
It’s also known as Acid-test ratio. This ratio is an indicator of short-term liquidity of a
company. The quick ratio was highest, 1times, in 2010 after that it gradually decreased and in
2014 it was 0.83 times. This ratio is also a sign that the company is in liquid position to meet
0.00%
0.50%
1.00%
1.50%
2.00%
2.50%
2010 2011 2012 2013 2014
Series 1
Page 27 of 64
its short-term obligations.
3. Working Capital:
Working capital indicates the operating liquidity of a company. Higher the working capital
higher the ability of the company to pay off its short term obligation and it’s also a signal that
the company can expand its business. In 2014 Working capital was BDT 1568 Million which
was the highest in the year 2011. The working capital were increased from 2010 to 2011 but
in 2012 it reduced to BDT 1233 Million and after that it was increasing in the rest of the year.
In 2014 working capital was BDT 1568 Mio.
6.2. Activity Ratios
Ratio 2010 2011 2012 2013 2014
Inventory Turnover Ratio (Times) 4.61 4.81 4.55 4.18 4.16
Total Asset Turnover Ratio (Times) 0.82 0.77 0.73 0.73 0.79
Days Sales Outstanding (Days) 149.78 182.46 202.07 195.31 169.57
Average Payment Period (Days) 66.92 98.16 79.70 102.72 81.80
0.00%
0.20%
0.40%
0.60%
0.80%
1.00%
1.20%
2010 2011 2012 2013 2014
Series 1
Page 28 of 64
Table.2: Results of the Activity Ratio Analysis
Graphical presentation of different types of Activity Ratios:
1. Inventory Turnover Ratio:
Inventory turnover ratio indicates how well the company managed its inventory. High value
of the ratio reflects good management of inventory. In 2014 the ratio was 4.16 times and the
ratio is slightly decreasing from 2010. Inventory turnover ratio was the highest, 4.81 times, in
2011.
2. Total Asset Turnover Ratio:
It is the calculation of how many BDT of Sales or revenues are generated by a company in
relation to its asset. The higher the ratio, the better the company is performing that is the
company is generating more revenue from each BDT of asset. The ratio was decreasing from
2010 to 2013 but in 2014 it was 0.79 times which was higher than last three years.
Page 29 of 64
3. Days Sales Outstanding (DSO):
It is a measurement of average number of days that a company takes to collect revenues after
a sale has been made. The trend line of Days Sales Outstanding (DSO) of ACI Limited is
relatively stable. In 2014 Days Sales Outstanding (DSO) was 170 days which means it takes
170 days on an average to collect the revenue after the sales. In 2012 it took 202 days to
collect revenues.
4. Average Payment Period:
Average payment period means the average time period is taken by a company in making
payments to its debtors. The average time period of ACI Limited is fluctuating year to year.
In 2014 Average Payment Period was 82 days which mean prompt payment is made to the
creditors. In 2013 it took 103 days to make payment to the creditors which were higher in
between 2010 to 2014.
Page 30 of 64
6.3. Leverage Ratios
Ratio 2010 2011 2012 2013 2014
Debt Ratio (Percentage) 0.54 0.57 0.62 0.62 0.79
Table.3: Results of the Leverage Ratio Analysis
Graphical presentationof Leverage Ratio:
1. Debt Ratio:
Debt ratio indicates the percentage of assets financed by all types of debts. It reflects the
financial structure of an organization. Higher percentage of debt ratio means more financial
risk in the organization. The debt ratio trend is more or less stable over the last five years but
in 2014 the debt ratio percentage has increased which is 0.79. The percentage value is highest
in last five years which is alarming for the company.
Page 31 of 64
6.4. Profitability Ratios
Ratio 2010 2011 2012 2013 2014
Net Profit Ratio (Percentage) 0.07 0.08 0.06 0.07 0.08
Return on Equity (Perrcentage) 0.03 0.04 (0.07) 0.03 0.11
Return on Assets (Perrcentage) 0.06 0.06 0.04 0.05 0.06
Earnings Per Share (BDT) 30.49 34.55 22.93 26.74 27.64
Graphical presentationof different types of Profitability Ratios:
1. Net Profit Ratio:
This ratio is an indicator of profitability of an organization. It shows how much money is kept
out of each BDT of sales or revenues by an organization in the form of its earning. Except the
year 2012, the percentage was stable for ACI Limited. In 2014 it was 0.08 which means BDT
Page 32 of 64
8 was kept as earning of ACI Limited out of each BDT 100 of sales.
2. Return on Equity (ROE):
ROE measures how much the shareholders earned for their investment in the company. The
higher percentage means higher returns to the investors. In 2012 the value of ROE was
alarming but in the next year ACI Limited recovers from the turmoil and in 2014 it produces
highest value of ROE which is 0.11.
Page 33 of 64
3. Return on Assets (ROA):
It measures how profitably a firm has utilized its assets. The higher the ROA percentage the
more a company is earning, the more efficiently the company is converting its assets to profit.
In 2014 the ROA percentage was 0.06 with less fluctuation than last five years.
4. Earnings Per Share (EPS):
Earnings per share indicate a company’s profitability. In 2011 the EPS was highest but then it
Decreases and in 2014 it was BDT 27.64.
Page 34 of 64
7. Result and Discussion
Ratio Analysis is a kind of Financial Statement Analysis that is used to gain a quick
suggestion of a firm's financial health in several key areas.
For the project purpose I have analyzed the following Categories of ratios:

Liquidity ratios 


Activity ratios 


Leverage ratios 


Profitability ratios 
Liquidity ratios:
Liquidity ratios are used asses firm’s ability to meet its short- term obligations using short-
term assets. The short-term obligations are recorded under current liabilities that come due
within one financial year. Short-term assets are the current assets.
Current ratio indicates the ability of a company to meet its short term obligation. Any value
below 1 indicates the weakness of financial health of a company on the other hand value over
2 suggests that the company is not investing its excess assets. Ratio between 1.1 to 2.0
reflects strong financial condition of a company. Current ratio of ACI limited is 1.19 times in
2014 which means the company is in liquid condition to meet its obligation. In 2011 the ratio
was 2.09 which were above normal but again from 2012 the ratio come down to normal level
and become relatively stable.
Quick ratio also measures the liquidity of an organization but this ratio further narrowed
down to measure the ability of a company to meet its immediate liabilities, without selling its
inventory. This known as the “acid test” because it only looks at the company’s most liquid
assets that can be quickly converted to cash). Quick ratio of ACI Limited was highest in 2010
(1.00 times) but it gradually decreased in the next four years and in 2014 it was 0.83 times.
Quick ratio of ACI Limited also indicates its healthy financial condition.
Working capital reveals a company’s efficiency and its short term financial health. A positive
value of working capital shows the ability of a company to pay back the liabilities to the
creditors in the short term and it also gives an idea of the company’s operational efficiency to
the investors. Continuous declining in the working capital is a red alert for an organization it
Page 35 of 64
may also led to the bankruptcy. In 2011 the working was BDT 5781 Million which was
sharply declined to BDT 1233 Million in 2012 after that it increases and in 2014 it was BDT
1568 Million. Huge amount of working capital also encourage a company to diversify its
business.
ACI Limited has more opportunity to expand its business with the support of its good
financial condition.
Activity ratios:
Activity ratios are also known as Asset management ratios also indicate the efficiency of the
use of assets in generating sales.
Inventory turnover ratio is the measurement of no. of times the inventory of a company is
turned over in a year. This ratio is an indication of production and purchasing efficiency. The
higher value shows quick selling of the inventory and a little unused amount of the inventory.
In last five years (2010-2014) highest value was 4.81 times in 2011 but it decreases gradually
and in 2014 it was 4.16 times. The result reveals the good management of the inventory and
very high production capacity of ACI Limited.
Total asset turnover ratio is the measurement of the efficiency of use of the total assets in
generating sales. This ratio indicates how efficiently an organization uses its assets. High
value of the ratio means more efficiency in using its assets. Total asset turnover ratio of ACI
Limited was highest, 0.82 times, in 2010 but it was declining up to 2013. In 2014 it was 0.79
times which means ACI Limited is generating BDT 0.79 from single BDT of its assets. The
result reveals the higher efficiency of ACI Limited in using its total assets.
Days sales outstanding reveal the no. of days a business take to collect cash from the market
after credit sales. ACI Limited took 170 days in 2014 for collecting its receivables which was
202 days in 2012. Collection in short period is good sign for ACI Limited because by quickly
turning sales into cash the company has the possibility to put the cash to reinvest and make
more sales.
Average payment period is average time period is taken by a company to making payment to
its creditors. The result of Average payment period of ACI Limited varies every year. In 2014
it was 82 days which indicates ACI Limited took 82 days to make payment to the creditors.
Page 36 of 64
Leverage ratios:
Companies depend on both owners’ equity and debt for financing in the business operations.
Leverage ratio is a financial measurement that looks at how much capital comes in the form
of debt, or judges the ability of a company to meet its financial obligations. Higher level of
debt can be risky for a company and its investors. On the other hand, low level of debts can
also raise questions to investors. Unwillingness to borrow may be an indication that operating
margins are simply too tight.
Debt ratio measure the ratio of debt to assets. The higher this ratio, the more leveraged the
company and the greater its financial risk. Debt ratio of ACI Limited was increasing from
2010. In 2014 debt ratio is 0.79 (79%), which was the highest value in last five years. Debt
ratio of 2014 suggests that ACI Limited is getting more financial leverage but more financial
risk is associated with the company.
Profitabilityratios:
Profitability ratios are used to assess a business's capability to generate earnings as compared
to its expenses and other relevant costs incurred during a specific period of time. Higher
value Profitability ratios from a previous period indicate that the company is doing well.
Net profit ratio actually measures how much from every BDT of revenue a company is
keeping as its earnings. Net profit ratio was relatively stable for ACI Limited from 2010 to
2014. In 2012 the ratio was the lowest, 0.06 (6%) but ACI Limited has regained its ration in
2014 which was 0.08 (8%). The result reveals that ACI Limited is keeping BDT 8 as its
earning from each BDT 100 of revenues. This leads ACI Limited to a very healthy financial
position.
Return on equity is the amount of net income gained as a percentage of shareholders equity.
Return on equity measures a company’s profitability by illuminating how much profit a
company is generating with the money shareholders have invested. Return on equity of ACI
Limited was negative (-7%) in 2012 which means their return was less than their equity and
they incurred loss in 2012. In 2013 the ratio turned to positive and in 2014 they become
stronger and the ratio was 0.11 (11%) which was the highest value in last five years. The ratio
suggests that the shareholders are earning BDT 11 from every BDT 100 of investment.
Page 37 of 64
Return on asset is the measurement of a company’s ability to turn assets into profit. It is an
indicator of how profitable a company is relative to its total assets. Return on asset of ACI
Limited was steady in last five years. In 2014 it was 0.06 (6%) which means ACI Limited is
generating 6 taka of profit from every 100 taka of its assets. Steady trend line indicates good
financial management of ACI Limited.
An Earnings per share is the portion of a company's profit to be paid to each outstanding
share. Earnings per share is an indicator of determining a share’s price. Higher amount of
EPS is desirable for the share holders and it increases the confidence of the investors. EPS of
ACI Limited was highest in 2011 (BDT 34.55) and lowest in 2012 (BDT 22.93) because of
incurring loss in 2012. But they come back strongly and the EPS was BDT 27.64 in 2014.
Page 38 of 64
8. Share Performance Analysis
Investing in the stocks gives investors the opportunity to get to know about the company and
feel comfortable about where the investor’s money is going. Individual stocks have a greater
upside potential than most mutual funds.
9. Objectives of Share Performance Analysis:

To know the current market position of the security as an investors.



To assess the risk associated with the security and the market.



To determine the correlation of the security with market.



To determine the volatility of the security.

10. Methodology
For calculating different parameters of share performance of ACI Ltd., the following
formulae were used:
1. Return
The gain or loss of a security in a particular period is the return. The return consists of the
income and the capital gains relative on an investment. It is usually quoted as a percentage.
The general rule is that the more risk you take, the greater the potential for higher return - and
loss.
For project purpose monthly return of ACI Limited’s security was calculated by using
following formula:
Return = (Month End Price – Month beginning Price) / Month beginning Price
The mean return from the security of ACI Limited was calculated by using following
formula.
Page 39 of 64
X   X
n
Where,
X = Daily return of a single security
n = Total number of days
Yearly Mean return was computed by multiplying 12 with the Average monthly return of the
security of ACI Limited.
2. Risk
The risk of financial assets can be measured with an absolute measure of dispersion or
variability of returns, called the variance. An equivalent measure of total risk is the square
root of the variance, the standard deviation, which measure the deviation of each observation
from the arithmetic mean of the observations and is a reliable measure of variability. The
symbol σ2 is used to denote the variance and σ is used to denote the standard deviation.
Variance is calculated as:
n
X  X 2
σ2 = i 1 and σ=  2
n 1
Where
σ2 = the variance of the daily returns
σ = Standard deviation, the risk
X = The value of daily returns
X = the mean of the daily returns
n = the number of returns
3. Correlation (ρij)
In the world of finance, a statistical measure of how two securities moves in relation to each
other or how a securities moves in relation with the market. Correlation coefficient ranges
Page 40 of 64
between -1 and +1. Perfect positive correlation (a correlation co-efficient of +1) implies that
as one security moves, either up or down, the other security will move in the same direction.
Alternatively, perfect negative correlation (a correlation co-efficient of -1) means that if one
security moves in either direction the security that is perfectly negatively correlated will
move in the opposite direction. Correlation denoted by ρij.
4. Beta [Slope (β)]
It is the measurement of the volatility, or systematic risk, of a security or a portfolio in
comparison to the market as a whole. Beta is used in the capital asset pricing model (CAPM),
a model that calculates the expected return of an asset based on its beta and expected market
returns. It’s Also known as "beta coefficient."
Beta is calculated using regression analysis, and beta is the indicator of a security's returns to
respond to variation in the market. A beta of 1 indicates that the security's price will move
with the market. A beta of less than one means that the security will be less volatile than the
market. A beta of greater than 1 indicates that the security's price will be more volatile than
the market. For example, if a stock's beta is 1.2, it's theoretically 20% more volatile than the
market.
5. Alpha [Intercept (α)]
It is the measurement of performance on a risk-adjusted basis. Alpha takes the volatility
(price risk) of a security and compares its risk-adjusted performance to a benchmark index.
The excess return of the fund relative to the return of the benchmark index is a securities’
alpha.
Page 41 of 64
11. Result and Discussion
Return is the main component of an investment which is the ultimate desire of an investor.
Return is the gain or loss of a security in a particular period of time. It consists of the income
and capital gain based on an investment. Usually return is expressed in terms of percentage
(%). The average return per month from the security of ACI Limited is 0.1182 (11.82%), and
yearly return is 1.4179 (141.84%) whereas average return per month from the market is
0.0054 (0.54%) and yearly return is 0.0649 (6.49%). Securities of ACI Limited is providing
high return to the investors. As a public limited company it’s very good for the company and
for the investors to have such high percentage of return. In the bearish market securities of
ACI Limited is providing high return which ultimately increasing the confidence of investors.
Considering the market condition investors can invest more in the securities of ACI Limited.
Risk is the chance that actual return of an investment will be different from expectations.
Risk includes the possibility of losing some or all of the original investment. Risk is
computed by standard deviation and higher value of the standard deviation means higher risk
is associated with the investment. The risk associated with this security is 0.2357, this mean
actual return may deviate 23.57% from the anticipated return. But considering the higher
percentage of return from this stock in the bearish market investors are compensating for
taking on additional risk. All the risk taking investors know high return is associated with
higher percentage of risk. The risk associated with the market is 0.0569 which suggest that
actual return may deviate 5.69% from expected return. Less return is associated with the
market as the return is less. Taking into account, the market situation, securities of ACI
Limited is offering more risk with higher percentage of return.
Correlation is the statistical measure of how two securities moves in relation to each other or
how a securities moves with the market. Correlation of the securities of ACI Limited with the
market is 0.0516. The relation is positive. This relation indicates that all the parameters of
this security moves positively with the market. If the market goes up the parameters of
securities of ACI Limited rise up by 5.16% and same results happen when market goes down.
But considering the value of correlation this security is less sensitive with the market.
Beta (slope) is the measurement of volatility of a stock with the market, which means how
many units of return from a stock, is changed with the unit change in return from the market.
Beta describes an investment's sensitivity to broad market movements. The value of the Slope
(β) for this security is 0.2136. Stocks of ACI Limited moves in the same direction as market,
Page 42 of 64
but less susceptible to fluctuation of the market.
Alpha is the Y intercept of the regression line. The Intercept [alpha coefficient (α)] is a
parameter in the Capital Asset Pricing Model (CAPM). It is the intercept of the security
characteristic line (SCL). Value of the intercept (α) is 0.1170; which implies that if the
standard return is 0% investors would expect their investment to return 11.70% so the
investment in the security of ACI Limited was safe for the return.
Page 43 of 64
12. Summery
For better understanding of the financial condition of ACI Limited, various ratios have been
computed. All the ratios support good financial condition of ACI Limited.
Liquidity ratios (Current ratio, Quick ratio and Working capital) indicate ACI Limited has very
strong financial ground to expand its business in future and continuously supports its existing
business.
Activity ratio (Inventory turnover ratio, Total asset turnover ratio, Days sales outstanding and
Average payment period) illuminates that the total asset is managing well by ACI limited.
Inventory turnover ratio and Total asset turnover ratio reflects the good management of the
inventory, high production capacity and high efficiency in using total asset. Average payment
period is short (82 days) considering the payables but Days sales outstanding is too long (170
days). They need to concentrate to minimize Days sales outstanding days.
Leverage ratio (Debt ratio) suggests that ACI Limited has a good control on their debt and asset.
They are enjoying more financial leverage but higher financial risk is associated with ACI
Limited.
Profitability ratio (Net profit ratio, ROE, ROA, and EPS) of ACI Limited supports their good
liquid financial standing. ACI Limited is managing their wealth in a very productive manner and
in returns they are providing handsome amount in the form of earnings to the share holders.
With good financial position ACI Limited is providing earnings to the share holders which
ultimately increasing the image of ACI Limited and gaining confidence of the investors.
As an investor analyzing the share performance in the market is very important. Each investor is
very sensitive with the return. With limited invest every investor desire to achieve a minimum
return which compensates the risk associated with the investment.
For the project purpose different parameter of share performance of ACI Limited was analyzed.
Value of all the parameters suggests high performance of the securities of ACI Limited
comparing with the market. In the bearish market they are ensuring 11.82% of average monthly
return with 23.57% of risk.
Page 44 of 64
13. Recommendations
After analyzing all the ratios and parameters of the share performance following
Recommendations for ACI Limited can be offered:

ACI Limited is maintaining a healthy financial condition they should invest more in new
business with its working capital to obtain more financial liquidity in the future.



They should decrease the no. of days in Days Sales Outstanding (DSO) to collect its
receivables more quickly to convert its sales into cash. So that they can reinvest in the


Business operation and generate more sales.



ACI Limited is enjoying financial leverage but they need to have a proper management to
minimize the financial risk associated with the company.



Though ACI Limited is in profitable situation but they need to concentrate to increase the
Net Profit Ratio and Return on Asset Ratio, which will ultimately increase the EPS.



The performance of the securities is very smooth in the market. They should provide risk
premium to compensate the risk offered by the securities. Offering risk premium in the


Bearish market may encourage more investors to invest in the securities of ACI Limited.
Page 45 of 64
14. Conclusion
ACI Limited is a well reputed corporate in Bangladesh. They are operating their business from
1992 with the stated values and have earned the respect of the stakeholders. The company is
operating in a smooth way in terms of financial activities. They have sustained their business by
good management of the assets and providing wealth to the stockholders.
Financial analysis is necessary to know about a business and the performance of its share. All
analysis reveals the financial strength of ACI Limited. ACI limited have immense opportunity to
expand its business in future and contribute more in the economy of Bangladesh.
15. Reference
References of Books:
Jones, P. Charles, Introduction to Financial Management, Richard D. Irwin, Inc. 1992.
Jones, P. Charles (2010). Investments Principles and Concepts (11th ed.). John Wiley & Sons,
Inc, New Delhi
Advance Chemical Industries Limited, Annual Report 2010
Advance Chemical Industries Limited, Annual Report 2011
Advance Chemical Industries Limited, Annual Report 2012
Advance Chemical Industries Limited, Annual Report 2013
Advance Chemical Industries Limited, Annual Report 2014
References of Website:
Dhaka Stock Exchange, viewed from 04 August 2015- 05 August 2015,
http://www.dse.com.bd/
ACI Limited, viewed from 02 July 2015- 05 July 2015, http://www.aci-bd.com Investopedia -
Educating the world about finance, viewed from 07 August 2015- 15 August 2015,
http://www.investopedia.com/
Page 46 of 64
16. Appendix
1. Statement of Financial Position:
2014-2013:
Page 47 of 64
2012-2011:
Page 48 of 64
2010-2009:
Page 49 of 64
2. Statement of Profit and Loss:
2014-2013:-
2012-2011:
Page 50 of 64
2010-2009:
3. Statement of Profit or Loss and other Comprehensive Income:
2014-2013:
Page 51 of 64
2012-2011:
2010-2009:
Page 52 of 64
4. Consolidated Statement of Financial Position:
2014-2013:
Page 53 of 64
2012-2011:
Page 54 of 64
2010-2009:
Page 55 of 64
5. Consolidated Statement of profit or Loss:-
2014-2013:-
Page 56 of 64
2012-2011:
Page 57 of 64
2010-2009:
Page 58 of 64
6. Share Capital:
2014-2013:
2012-2011:
2010-2009:
Page 59 of 64
17. Calculationof the Ratios:
Liquidity ratios
1. Current Ratio =
CURRENT ASSETS
CURRENT LIABILITIES
= 9927161551/8358791057 = 1.19 Times [2014]
= 9461772496/8101494869 = 1.17 Times [2013]
=8334671204/7101682744 = 1.17 Times [2012]
=11096971158/5316055351 = 2.09 Times [2011]
=5801121537/4087163416 = 1.42 Times [2010]
2. Quick Ratio (Acid-Test Ratio) =
QUICK ASSETS
CURRENT LIABILITIES
= (9927161551-2961175971)/8358791057 = 0.83 Times [2014]
= (9461772496-2553330342)/8101494869 = 0.85 Times [2013]
= (8334671204-2128984396)/7101682744 = 0.87 Times [2012]
= (6954929184-1770481777)/5316055351 = 0.98 Times [2011]
= (5801121537-1716072609)/4087163416 = 1.0 Times [2010]
3. Working Capital = Current Asset – Current Liabilities
= (9927161551-8358791057)/1000000 = BDT 1568.37 Mio. [2014]
= (9461772496-8101494869)/1000000 = BDT 1360.28 Mio. [2013]
= (8334671204-7101682744)/1000000 = BDT 1232.99 Mio. [2012]
= (11096971158-5316055351)/1000000 = BDT 5780.92 Mio. [2011]
= (5801121537-4087163416)/1000000 = BDT 1713.96 Mio. [2010]
Activity ratios
1. Inventory Turnover Ratio =
SLAES or REVENUE
INVENTORY
= 12318723190/2961175971 = 4.16 Times [2014]
= 10683600712/2553330342 = 4.18 Times [2013]
= 9680061562/2128984396 = 4.55 Times [2012]
= 8513841846/1770481777 = 4.81 Times [2011]
= 7915400279/1716072609 = 4.61 Times [2010]
Page 60 of 64
2. Total Asset Turnover Ratio =
SALES or REVENUE
TOTAL ASSETS
= 12318723190/15526192783 = 0.79 Times [2014]
= 10683600712/14693912974 = 0.73 Times [2013]
= 9680061562/13206467006 = 0.73 Times [2012]
= 8513841846/11096971158 = 0.77 Times [2011]
= 7915400279/9686269567 = 0.82 Times [2010]
=
3. Days Sales Outstanding (DSO) =
ACCOUNTSRECIEVABLS
 No.ofDAYS
TOTALSALES
= (5802572938*360)/12318723190 = 169.57 Days [2014]
= (5796239556*360)/10683600712 = 195.31 Days [2013]
= (5433551092*360)/9680061562 = 202.07 Days [2012]
= (4315151216*360)/8513841846 = 182.46 Days [2011]
= (3293307705*360)/7915400279 =149.78 Days [2010]
4. Average Payment Period = (ACCOUNTSPAYABLE  NO. OF DAYS)
NET PURCHASES or COGS
= (1624157078*360)/7147881434 = 81.80 Days [2014]
= (1833527360*360)/6426070148 = 102.72 Days [2013]
= (1348153456*360)/6089878323 = 79.70 Days [2012]
= (1449832593*360)/5317279883 = 98.16 Days [2011]
= (947031067*360)/5094561620 = 66.92 Days [2010]
Leverage ratios:
1. Debt Ratio =
TOTAL DEBT
100
TOTAL ASSET
= 12318723190/15526192783 = 0.79 = 79% [2014]
= 9056660723/14693912974 = 0.62 = 62% [2013]
= 8125180846/13206467006 = 0.62 = 62% [2012]
= 6329473598/11096971158 = 0.57 = 57% [2011]
= 5228091771/9686269567 = 0.54 = 54% [2010]
Profitability ratios:
1. Net Profit Ratio =
NET PROFIT
SALES or REVENUE
Page 61 of 64
= 950713609/12318723190 = 0.08 = 8% [2014]
= 764187906/10683600712 = 0.07 = 7% [2013]
= 545115873/9680061562 = 0.06 = 6% [2012]
= 681129073/8513841846 = 0.08 = 8% [2011]
591590014/7915400279 = 0.07% = 7% [2010]
2. Return on Equity = NET INCOMEAVAILABLE FOR COMMON STOCKHOLDERS
STOCKHOLDER'S EQUITY
= 479115177/4274198745 = 0.11 = 11% [2014]
=103239482/4040414787 = 0.03 = 3% [2013]
= -282815672/4155380482 = -0.07 = 7% [2012]
= 186069546/4688358251 = 0.04 = 4% [2011]
= 140388450/4914447794 = 0.03 = 3% [2010]
3. Return on Assets (ROA) =
NET INCOME
TOTAL ASSET
= 950713609/15526192783 = 0.06 = 6% [2014]
= 764187906/14693912974 = 0.05 = 5% [2013]
= 545115873/13206467006 = 0.04 = 4% [2012]
= 681129073/11096971158 = 0.06 = 6% [2011]
= 591590014/9686269567 = 0.06 = 6% [2010]
4. Earnings per Share (EPS) =
NET INCOME
TOTAL NO. OF COMMON STOCK OUTSTANDING
= 950713609/34394401 = BDT 27.64 [2014]
= 764187906/28582082 = BDT 26.74 [2013]
= 545115873/23773833 = BDT 22.93 [2012]
= 681129073/19714756 = BDT 34.55 [2011]
= 591590014/19404000 = BDT 30.49 [2010]
Page 62 of 64
Page 63 of 64
Page 64 of 64

Más contenido relacionado

La actualidad más candente

F3 Financial Accounting Lectures 1-4
F3 Financial Accounting Lectures 1-4F3 Financial Accounting Lectures 1-4
F3 Financial Accounting Lectures 1-4mikearmentzs
 
Budgetary Considerations in Governmental Accounting
Budgetary Considerations in Governmental AccountingBudgetary Considerations in Governmental Accounting
Budgetary Considerations in Governmental AccountingNeveenJamal
 
Financial Accounting 7th Edition Libby Solutions Manual
Financial Accounting 7th Edition Libby Solutions ManualFinancial Accounting 7th Edition Libby Solutions Manual
Financial Accounting 7th Edition Libby Solutions ManualPriceSweeney
 
Improvements Proposed to Accounting for Defined Benefit Plans
Improvements Proposed to Accounting for Defined Benefit PlansImprovements Proposed to Accounting for Defined Benefit Plans
Improvements Proposed to Accounting for Defined Benefit PlansMHM (Mayer Hoffman McCann P.C.)
 
Preparing for the New Leasing Standard and Other Developments from the Fourth...
Preparing for the New Leasing Standard and Other Developments from the Fourth...Preparing for the New Leasing Standard and Other Developments from the Fourth...
Preparing for the New Leasing Standard and Other Developments from the Fourth...MHM (Mayer Hoffman McCann P.C.)
 
Livent - Accounting Policy
Livent - Accounting PolicyLivent - Accounting Policy
Livent - Accounting Policydanielrodic
 
The Nature and purpose of accounting
The Nature and purpose of accounting The Nature and purpose of accounting
The Nature and purpose of accounting Hamed Faghiri
 
Introduction to Governmental Accounting_Updated Day One
Introduction to Governmental Accounting_Updated Day OneIntroduction to Governmental Accounting_Updated Day One
Introduction to Governmental Accounting_Updated Day OneBarre Arale Mohamud
 
Purposes of accounting
Purposes of accountingPurposes of accounting
Purposes of accountingShyama Shankar
 
Governmental Audit Update
Governmental Audit UpdateGovernmental Audit Update
Governmental Audit UpdateDiane Bradley
 
FASB Finalizes Improvements to Recognition and Measurement of Certain Financi...
FASB Finalizes Improvements to Recognition and Measurement of Certain Financi...FASB Finalizes Improvements to Recognition and Measurement of Certain Financi...
FASB Finalizes Improvements to Recognition and Measurement of Certain Financi...MHM (Mayer Hoffman McCann P.C.)
 
GASB (Governmental Accounting Standards Board)| Accounting
GASB (Governmental Accounting Standards Board)| AccountingGASB (Governmental Accounting Standards Board)| Accounting
GASB (Governmental Accounting Standards Board)| AccountingTransweb Global Inc
 
governmental and Non profit Accounting chapter 1
governmental and Non profit Accounting chapter 1governmental and Non profit Accounting chapter 1
governmental and Non profit Accounting chapter 1NeveenJamal
 

La actualidad más candente (20)

Govt grants Ind AS- 19
Govt grants Ind AS- 19Govt grants Ind AS- 19
Govt grants Ind AS- 19
 
F3 Financial Accounting Lectures 1-4
F3 Financial Accounting Lectures 1-4F3 Financial Accounting Lectures 1-4
F3 Financial Accounting Lectures 1-4
 
Budgetary Considerations in Governmental Accounting
Budgetary Considerations in Governmental AccountingBudgetary Considerations in Governmental Accounting
Budgetary Considerations in Governmental Accounting
 
Lay of the Accounting Landscape: Quarter 3
Lay of the Accounting Landscape: Quarter 3Lay of the Accounting Landscape: Quarter 3
Lay of the Accounting Landscape: Quarter 3
 
Financial Accounting 7th Edition Libby Solutions Manual
Financial Accounting 7th Edition Libby Solutions ManualFinancial Accounting 7th Edition Libby Solutions Manual
Financial Accounting 7th Edition Libby Solutions Manual
 
Improvements Proposed to Accounting for Defined Benefit Plans
Improvements Proposed to Accounting for Defined Benefit PlansImprovements Proposed to Accounting for Defined Benefit Plans
Improvements Proposed to Accounting for Defined Benefit Plans
 
Preparing for the New Leasing Standard and Other Developments from the Fourth...
Preparing for the New Leasing Standard and Other Developments from the Fourth...Preparing for the New Leasing Standard and Other Developments from the Fourth...
Preparing for the New Leasing Standard and Other Developments from the Fourth...
 
2015 Audit & Accounting Update
2015 Audit & Accounting Update2015 Audit & Accounting Update
2015 Audit & Accounting Update
 
Livent - Accounting Policy
Livent - Accounting PolicyLivent - Accounting Policy
Livent - Accounting Policy
 
The Nature and purpose of accounting
The Nature and purpose of accounting The Nature and purpose of accounting
The Nature and purpose of accounting
 
2014 Audit & Accounting Update
2014 Audit & Accounting Update2014 Audit & Accounting Update
2014 Audit & Accounting Update
 
2016 Audit & Accounting Update
2016 Audit & Accounting Update2016 Audit & Accounting Update
2016 Audit & Accounting Update
 
6th Annual Tax Update
6th Annual Tax Update6th Annual Tax Update
6th Annual Tax Update
 
Introduction to Governmental Accounting_Updated Day One
Introduction to Governmental Accounting_Updated Day OneIntroduction to Governmental Accounting_Updated Day One
Introduction to Governmental Accounting_Updated Day One
 
Purposes of accounting
Purposes of accountingPurposes of accounting
Purposes of accounting
 
Governmental Audit Update
Governmental Audit UpdateGovernmental Audit Update
Governmental Audit Update
 
FASB Finalizes Improvements to Recognition and Measurement of Certain Financi...
FASB Finalizes Improvements to Recognition and Measurement of Certain Financi...FASB Finalizes Improvements to Recognition and Measurement of Certain Financi...
FASB Finalizes Improvements to Recognition and Measurement of Certain Financi...
 
Accounting principle 2 by Mushfiqul Haque Mukit
Accounting principle 2 by Mushfiqul Haque MukitAccounting principle 2 by Mushfiqul Haque Mukit
Accounting principle 2 by Mushfiqul Haque Mukit
 
GASB (Governmental Accounting Standards Board)| Accounting
GASB (Governmental Accounting Standards Board)| AccountingGASB (Governmental Accounting Standards Board)| Accounting
GASB (Governmental Accounting Standards Board)| Accounting
 
governmental and Non profit Accounting chapter 1
governmental and Non profit Accounting chapter 1governmental and Non profit Accounting chapter 1
governmental and Non profit Accounting chapter 1
 

Destacado

Ratio Analysis of ACI Limited (Bangladesh)
Ratio Analysis of ACI Limited (Bangladesh)Ratio Analysis of ACI Limited (Bangladesh)
Ratio Analysis of ACI Limited (Bangladesh)Sunanda Sarker
 
Modern Grain Management
Modern Grain ManagementModern Grain Management
Modern Grain ManagementMahinA Arefin
 
Financal statment analize aci ltd. part 1
Financal statment analize  aci ltd. part 1Financal statment analize  aci ltd. part 1
Financal statment analize aci ltd. part 1jahid dewan
 
Ratio analysis of beximco pharmaceuticals ltd
Ratio analysis of beximco pharmaceuticals ltdRatio analysis of beximco pharmaceuticals ltd
Ratio analysis of beximco pharmaceuticals ltdMahamuda Chowdhury
 
Analyses BCG Matrix on ACI Limited
Analyses BCG Matrix on ACI LimitedAnalyses BCG Matrix on ACI Limited
Analyses BCG Matrix on ACI LimitedAAshik Rahman
 
Ratio analysis of square texttile
Ratio analysis of square texttile Ratio analysis of square texttile
Ratio analysis of square texttile William Banarjee
 
Profitability analysis of beximco pharmaceutical s limited
Profitability analysis of beximco pharmaceutical s limitedProfitability analysis of beximco pharmaceutical s limited
Profitability analysis of beximco pharmaceutical s limitedRoni Bhowmik
 
Analyzing promotional strategies on ACI pure salt (internship report)
Analyzing promotional strategies on ACI pure salt (internship report)Analyzing promotional strategies on ACI pure salt (internship report)
Analyzing promotional strategies on ACI pure salt (internship report)Jamil Ahmed AKASH
 
Pharmaceutical industry in bangladesh(assigment)...n iloy
Pharmaceutical industry in bangladesh(assigment)...n iloyPharmaceutical industry in bangladesh(assigment)...n iloy
Pharmaceutical industry in bangladesh(assigment)...n iloyNiloy Saha
 
Beximco Pharmaceuticals Presentation - In Bangladesh
Beximco  Pharmaceuticals Presentation - In BangladeshBeximco  Pharmaceuticals Presentation - In Bangladesh
Beximco Pharmaceuticals Presentation - In BangladeshTasvir A R Chowdhury
 
Pharmaceutical Industry Financial Analysis
Pharmaceutical Industry Financial AnalysisPharmaceutical Industry Financial Analysis
Pharmaceutical Industry Financial Analysisjpotts89
 
Financial Ratios Analysis of Square Pharmaceuticals
Financial Ratios Analysis of Square Pharmaceuticals Financial Ratios Analysis of Square Pharmaceuticals
Financial Ratios Analysis of Square Pharmaceuticals Konok Mondal
 
Presentation on Beximco Pharmaceuticals Ltd
Presentation on Beximco Pharmaceuticals LtdPresentation on Beximco Pharmaceuticals Ltd
Presentation on Beximco Pharmaceuticals LtdMd. Hafiz-Al-Asad .
 

Destacado (14)

Ratio Analysis of ACI Limited (Bangladesh)
Ratio Analysis of ACI Limited (Bangladesh)Ratio Analysis of ACI Limited (Bangladesh)
Ratio Analysis of ACI Limited (Bangladesh)
 
Modern Grain Management
Modern Grain ManagementModern Grain Management
Modern Grain Management
 
Financal statment analize aci ltd. part 1
Financal statment analize  aci ltd. part 1Financal statment analize  aci ltd. part 1
Financal statment analize aci ltd. part 1
 
Ratio analysis of beximco pharmaceuticals ltd
Ratio analysis of beximco pharmaceuticals ltdRatio analysis of beximco pharmaceuticals ltd
Ratio analysis of beximco pharmaceuticals ltd
 
Analyses BCG Matrix on ACI Limited
Analyses BCG Matrix on ACI LimitedAnalyses BCG Matrix on ACI Limited
Analyses BCG Matrix on ACI Limited
 
Ratio analysis of square texttile
Ratio analysis of square texttile Ratio analysis of square texttile
Ratio analysis of square texttile
 
Profitability analysis of beximco pharmaceutical s limited
Profitability analysis of beximco pharmaceutical s limitedProfitability analysis of beximco pharmaceutical s limited
Profitability analysis of beximco pharmaceutical s limited
 
Analyzing promotional strategies on ACI pure salt (internship report)
Analyzing promotional strategies on ACI pure salt (internship report)Analyzing promotional strategies on ACI pure salt (internship report)
Analyzing promotional strategies on ACI pure salt (internship report)
 
Pharmaceutical industry in bangladesh(assigment)...n iloy
Pharmaceutical industry in bangladesh(assigment)...n iloyPharmaceutical industry in bangladesh(assigment)...n iloy
Pharmaceutical industry in bangladesh(assigment)...n iloy
 
Beximco Pharmaceuticals Presentation - In Bangladesh
Beximco  Pharmaceuticals Presentation - In BangladeshBeximco  Pharmaceuticals Presentation - In Bangladesh
Beximco Pharmaceuticals Presentation - In Bangladesh
 
Marketing startegy of nestle bangladesh ltd.
Marketing startegy of nestle bangladesh ltd.Marketing startegy of nestle bangladesh ltd.
Marketing startegy of nestle bangladesh ltd.
 
Pharmaceutical Industry Financial Analysis
Pharmaceutical Industry Financial AnalysisPharmaceutical Industry Financial Analysis
Pharmaceutical Industry Financial Analysis
 
Financial Ratios Analysis of Square Pharmaceuticals
Financial Ratios Analysis of Square Pharmaceuticals Financial Ratios Analysis of Square Pharmaceuticals
Financial Ratios Analysis of Square Pharmaceuticals
 
Presentation on Beximco Pharmaceuticals Ltd
Presentation on Beximco Pharmaceuticals LtdPresentation on Beximco Pharmaceuticals Ltd
Presentation on Beximco Pharmaceuticals Ltd
 

Similar a Financal statment analize aci ltd. pirt 2

Importance of financial reporting analysis
Importance of financial reporting analysisImportance of financial reporting analysis
Importance of financial reporting analysisyashikagupta48
 
Accounting and Bookkeeping services .pdf
Accounting and Bookkeeping services .pdfAccounting and Bookkeeping services .pdf
Accounting and Bookkeeping services .pdfDavid Brown
 
Keiso15 chapter 2 review
Keiso15 chapter 2 reviewKeiso15 chapter 2 review
Keiso15 chapter 2 reviewSungah Kimelika
 
ABM1_Concepts and Principles.pptxABM1_Concepts and Principles.pptx
ABM1_Concepts and Principles.pptxABM1_Concepts and Principles.pptxABM1_Concepts and Principles.pptxABM1_Concepts and Principles.pptx
ABM1_Concepts and Principles.pptxABM1_Concepts and Principles.pptxjeannmontejo1
 
Difference Between IASB And FASB conceptual framework
Difference Between IASB And FASB conceptual framework Difference Between IASB And FASB conceptual framework
Difference Between IASB And FASB conceptual framework Ro'ya Abd Elhafez
 
AUDITING IN SPECIALIZED INDUSTRIES .pdf
AUDITING IN SPECIALIZED INDUSTRIES .pdfAUDITING IN SPECIALIZED INDUSTRIES .pdf
AUDITING IN SPECIALIZED INDUSTRIES .pdfCristelTannagan
 
Conceptual framework
Conceptual frameworkConceptual framework
Conceptual frameworkAnamul Nadim
 
Conceptual Framework of Accounting
Conceptual Framework of AccountingConceptual Framework of Accounting
Conceptual Framework of AccountingSabiha Jannat
 
IASB Conceptual Framework 2018 -An Overview
IASB Conceptual Framework 2018 -An OverviewIASB Conceptual Framework 2018 -An Overview
IASB Conceptual Framework 2018 -An OverviewJamie Boyd
 
Balance Sheet And Income Statement
Balance Sheet And Income StatementBalance Sheet And Income Statement
Balance Sheet And Income StatementJessica Howard
 
Financial Statements of a Company.pdf
Financial Statements of a Company.pdfFinancial Statements of a Company.pdf
Financial Statements of a Company.pdfmanishco.com
 
Conceptual Framework.pptx
Conceptual Framework.pptxConceptual Framework.pptx
Conceptual Framework.pptxRandimaDeSilva3
 
Financial Reporting & Analysis unit i, ii, iii, vii
Financial Reporting & Analysis unit i, ii, iii, viiFinancial Reporting & Analysis unit i, ii, iii, vii
Financial Reporting & Analysis unit i, ii, iii, viiSachin Bhurase
 
Financial Accounting Introduction
Financial Accounting IntroductionFinancial Accounting Introduction
Financial Accounting Introductiongimmba
 
19328sm finalnew cp3
19328sm finalnew cp319328sm finalnew cp3
19328sm finalnew cp3Sarath Nair
 

Similar a Financal statment analize aci ltd. pirt 2 (20)

Importance of financial reporting analysis
Importance of financial reporting analysisImportance of financial reporting analysis
Importance of financial reporting analysis
 
Accounting and Bookkeeping services .pdf
Accounting and Bookkeeping services .pdfAccounting and Bookkeeping services .pdf
Accounting and Bookkeeping services .pdf
 
Keiso15 chapter 2 review
Keiso15 chapter 2 reviewKeiso15 chapter 2 review
Keiso15 chapter 2 review
 
ABM1_Concepts and Principles.pptxABM1_Concepts and Principles.pptx
ABM1_Concepts and Principles.pptxABM1_Concepts and Principles.pptxABM1_Concepts and Principles.pptxABM1_Concepts and Principles.pptx
ABM1_Concepts and Principles.pptxABM1_Concepts and Principles.pptx
 
Accountin 1.pptx
Accountin 1.pptxAccountin 1.pptx
Accountin 1.pptx
 
Difference Between IASB And FASB conceptual framework
Difference Between IASB And FASB conceptual framework Difference Between IASB And FASB conceptual framework
Difference Between IASB And FASB conceptual framework
 
AUDITING IN SPECIALIZED INDUSTRIES .pdf
AUDITING IN SPECIALIZED INDUSTRIES .pdfAUDITING IN SPECIALIZED INDUSTRIES .pdf
AUDITING IN SPECIALIZED INDUSTRIES .pdf
 
1. conceptual framework
1. conceptual framework1. conceptual framework
1. conceptual framework
 
Conceptual framework
Conceptual frameworkConceptual framework
Conceptual framework
 
Conceptual Framework of Accounting
Conceptual Framework of AccountingConceptual Framework of Accounting
Conceptual Framework of Accounting
 
IASB Conceptual Framework 2018 -An Overview
IASB Conceptual Framework 2018 -An OverviewIASB Conceptual Framework 2018 -An Overview
IASB Conceptual Framework 2018 -An Overview
 
Balance Sheet And Income Statement
Balance Sheet And Income StatementBalance Sheet And Income Statement
Balance Sheet And Income Statement
 
Financial accounting gp1
Financial accounting gp1Financial accounting gp1
Financial accounting gp1
 
Finance
FinanceFinance
Finance
 
Ch 1.pdf
Ch 1.pdfCh 1.pdf
Ch 1.pdf
 
Financial Statements of a Company.pdf
Financial Statements of a Company.pdfFinancial Statements of a Company.pdf
Financial Statements of a Company.pdf
 
Conceptual Framework.pptx
Conceptual Framework.pptxConceptual Framework.pptx
Conceptual Framework.pptx
 
Financial Reporting & Analysis unit i, ii, iii, vii
Financial Reporting & Analysis unit i, ii, iii, viiFinancial Reporting & Analysis unit i, ii, iii, vii
Financial Reporting & Analysis unit i, ii, iii, vii
 
Financial Accounting Introduction
Financial Accounting IntroductionFinancial Accounting Introduction
Financial Accounting Introduction
 
19328sm finalnew cp3
19328sm finalnew cp319328sm finalnew cp3
19328sm finalnew cp3
 

Último

Daily Lesson Plan in Mathematics Quarter 4
Daily Lesson Plan in Mathematics Quarter 4Daily Lesson Plan in Mathematics Quarter 4
Daily Lesson Plan in Mathematics Quarter 4JOYLYNSAMANIEGO
 
Incoming and Outgoing Shipments in 3 STEPS Using Odoo 17
Incoming and Outgoing Shipments in 3 STEPS Using Odoo 17Incoming and Outgoing Shipments in 3 STEPS Using Odoo 17
Incoming and Outgoing Shipments in 3 STEPS Using Odoo 17Celine George
 
Difference Between Search & Browse Methods in Odoo 17
Difference Between Search & Browse Methods in Odoo 17Difference Between Search & Browse Methods in Odoo 17
Difference Between Search & Browse Methods in Odoo 17Celine George
 
Food processing presentation for bsc agriculture hons
Food processing presentation for bsc agriculture honsFood processing presentation for bsc agriculture hons
Food processing presentation for bsc agriculture honsManeerUddin
 
ANG SEKTOR NG agrikultura.pptx QUARTER 4
ANG SEKTOR NG agrikultura.pptx QUARTER 4ANG SEKTOR NG agrikultura.pptx QUARTER 4
ANG SEKTOR NG agrikultura.pptx QUARTER 4MiaBumagat1
 
Concurrency Control in Database Management system
Concurrency Control in Database Management systemConcurrency Control in Database Management system
Concurrency Control in Database Management systemChristalin Nelson
 
ISYU TUNGKOL SA SEKSWLADIDA (ISSUE ABOUT SEXUALITY
ISYU TUNGKOL SA SEKSWLADIDA (ISSUE ABOUT SEXUALITYISYU TUNGKOL SA SEKSWLADIDA (ISSUE ABOUT SEXUALITY
ISYU TUNGKOL SA SEKSWLADIDA (ISSUE ABOUT SEXUALITYKayeClaireEstoconing
 
4.18.24 Movement Legacies, Reflection, and Review.pptx
4.18.24 Movement Legacies, Reflection, and Review.pptx4.18.24 Movement Legacies, Reflection, and Review.pptx
4.18.24 Movement Legacies, Reflection, and Review.pptxmary850239
 
Q4-PPT-Music9_Lesson-1-Romantic-Opera.pptx
Q4-PPT-Music9_Lesson-1-Romantic-Opera.pptxQ4-PPT-Music9_Lesson-1-Romantic-Opera.pptx
Q4-PPT-Music9_Lesson-1-Romantic-Opera.pptxlancelewisportillo
 
Karra SKD Conference Presentation Revised.pptx
Karra SKD Conference Presentation Revised.pptxKarra SKD Conference Presentation Revised.pptx
Karra SKD Conference Presentation Revised.pptxAshokKarra1
 
Earth Day Presentation wow hello nice great
Earth Day Presentation wow hello nice greatEarth Day Presentation wow hello nice great
Earth Day Presentation wow hello nice greatYousafMalik24
 
INTRODUCTION TO CATHOLIC CHRISTOLOGY.pptx
INTRODUCTION TO CATHOLIC CHRISTOLOGY.pptxINTRODUCTION TO CATHOLIC CHRISTOLOGY.pptx
INTRODUCTION TO CATHOLIC CHRISTOLOGY.pptxHumphrey A Beña
 
ENG 5 Q4 WEEk 1 DAY 1 Restate sentences heard in one’s own words. Use appropr...
ENG 5 Q4 WEEk 1 DAY 1 Restate sentences heard in one’s own words. Use appropr...ENG 5 Q4 WEEk 1 DAY 1 Restate sentences heard in one’s own words. Use appropr...
ENG 5 Q4 WEEk 1 DAY 1 Restate sentences heard in one’s own words. Use appropr...JojoEDelaCruz
 
Inclusivity Essentials_ Creating Accessible Websites for Nonprofits .pdf
Inclusivity Essentials_ Creating Accessible Websites for Nonprofits .pdfInclusivity Essentials_ Creating Accessible Websites for Nonprofits .pdf
Inclusivity Essentials_ Creating Accessible Websites for Nonprofits .pdfTechSoup
 
Global Lehigh Strategic Initiatives (without descriptions)
Global Lehigh Strategic Initiatives (without descriptions)Global Lehigh Strategic Initiatives (without descriptions)
Global Lehigh Strategic Initiatives (without descriptions)cama23
 
What is Model Inheritance in Odoo 17 ERP
What is Model Inheritance in Odoo 17 ERPWhat is Model Inheritance in Odoo 17 ERP
What is Model Inheritance in Odoo 17 ERPCeline George
 
Virtual-Orientation-on-the-Administration-of-NATG12-NATG6-and-ELLNA.pdf
Virtual-Orientation-on-the-Administration-of-NATG12-NATG6-and-ELLNA.pdfVirtual-Orientation-on-the-Administration-of-NATG12-NATG6-and-ELLNA.pdf
Virtual-Orientation-on-the-Administration-of-NATG12-NATG6-and-ELLNA.pdfErwinPantujan2
 
GRADE 4 - SUMMATIVE TEST QUARTER 4 ALL SUBJECTS
GRADE 4 - SUMMATIVE TEST QUARTER 4 ALL SUBJECTSGRADE 4 - SUMMATIVE TEST QUARTER 4 ALL SUBJECTS
GRADE 4 - SUMMATIVE TEST QUARTER 4 ALL SUBJECTSJoshuaGantuangco2
 

Último (20)

Daily Lesson Plan in Mathematics Quarter 4
Daily Lesson Plan in Mathematics Quarter 4Daily Lesson Plan in Mathematics Quarter 4
Daily Lesson Plan in Mathematics Quarter 4
 
Incoming and Outgoing Shipments in 3 STEPS Using Odoo 17
Incoming and Outgoing Shipments in 3 STEPS Using Odoo 17Incoming and Outgoing Shipments in 3 STEPS Using Odoo 17
Incoming and Outgoing Shipments in 3 STEPS Using Odoo 17
 
Difference Between Search & Browse Methods in Odoo 17
Difference Between Search & Browse Methods in Odoo 17Difference Between Search & Browse Methods in Odoo 17
Difference Between Search & Browse Methods in Odoo 17
 
Food processing presentation for bsc agriculture hons
Food processing presentation for bsc agriculture honsFood processing presentation for bsc agriculture hons
Food processing presentation for bsc agriculture hons
 
ANG SEKTOR NG agrikultura.pptx QUARTER 4
ANG SEKTOR NG agrikultura.pptx QUARTER 4ANG SEKTOR NG agrikultura.pptx QUARTER 4
ANG SEKTOR NG agrikultura.pptx QUARTER 4
 
Concurrency Control in Database Management system
Concurrency Control in Database Management systemConcurrency Control in Database Management system
Concurrency Control in Database Management system
 
ISYU TUNGKOL SA SEKSWLADIDA (ISSUE ABOUT SEXUALITY
ISYU TUNGKOL SA SEKSWLADIDA (ISSUE ABOUT SEXUALITYISYU TUNGKOL SA SEKSWLADIDA (ISSUE ABOUT SEXUALITY
ISYU TUNGKOL SA SEKSWLADIDA (ISSUE ABOUT SEXUALITY
 
4.18.24 Movement Legacies, Reflection, and Review.pptx
4.18.24 Movement Legacies, Reflection, and Review.pptx4.18.24 Movement Legacies, Reflection, and Review.pptx
4.18.24 Movement Legacies, Reflection, and Review.pptx
 
Q4-PPT-Music9_Lesson-1-Romantic-Opera.pptx
Q4-PPT-Music9_Lesson-1-Romantic-Opera.pptxQ4-PPT-Music9_Lesson-1-Romantic-Opera.pptx
Q4-PPT-Music9_Lesson-1-Romantic-Opera.pptx
 
Karra SKD Conference Presentation Revised.pptx
Karra SKD Conference Presentation Revised.pptxKarra SKD Conference Presentation Revised.pptx
Karra SKD Conference Presentation Revised.pptx
 
Raw materials used in Herbal Cosmetics.pptx
Raw materials used in Herbal Cosmetics.pptxRaw materials used in Herbal Cosmetics.pptx
Raw materials used in Herbal Cosmetics.pptx
 
Earth Day Presentation wow hello nice great
Earth Day Presentation wow hello nice greatEarth Day Presentation wow hello nice great
Earth Day Presentation wow hello nice great
 
INTRODUCTION TO CATHOLIC CHRISTOLOGY.pptx
INTRODUCTION TO CATHOLIC CHRISTOLOGY.pptxINTRODUCTION TO CATHOLIC CHRISTOLOGY.pptx
INTRODUCTION TO CATHOLIC CHRISTOLOGY.pptx
 
LEFT_ON_C'N_ PRELIMS_EL_DORADO_2024.pptx
LEFT_ON_C'N_ PRELIMS_EL_DORADO_2024.pptxLEFT_ON_C'N_ PRELIMS_EL_DORADO_2024.pptx
LEFT_ON_C'N_ PRELIMS_EL_DORADO_2024.pptx
 
ENG 5 Q4 WEEk 1 DAY 1 Restate sentences heard in one’s own words. Use appropr...
ENG 5 Q4 WEEk 1 DAY 1 Restate sentences heard in one’s own words. Use appropr...ENG 5 Q4 WEEk 1 DAY 1 Restate sentences heard in one’s own words. Use appropr...
ENG 5 Q4 WEEk 1 DAY 1 Restate sentences heard in one’s own words. Use appropr...
 
Inclusivity Essentials_ Creating Accessible Websites for Nonprofits .pdf
Inclusivity Essentials_ Creating Accessible Websites for Nonprofits .pdfInclusivity Essentials_ Creating Accessible Websites for Nonprofits .pdf
Inclusivity Essentials_ Creating Accessible Websites for Nonprofits .pdf
 
Global Lehigh Strategic Initiatives (without descriptions)
Global Lehigh Strategic Initiatives (without descriptions)Global Lehigh Strategic Initiatives (without descriptions)
Global Lehigh Strategic Initiatives (without descriptions)
 
What is Model Inheritance in Odoo 17 ERP
What is Model Inheritance in Odoo 17 ERPWhat is Model Inheritance in Odoo 17 ERP
What is Model Inheritance in Odoo 17 ERP
 
Virtual-Orientation-on-the-Administration-of-NATG12-NATG6-and-ELLNA.pdf
Virtual-Orientation-on-the-Administration-of-NATG12-NATG6-and-ELLNA.pdfVirtual-Orientation-on-the-Administration-of-NATG12-NATG6-and-ELLNA.pdf
Virtual-Orientation-on-the-Administration-of-NATG12-NATG6-and-ELLNA.pdf
 
GRADE 4 - SUMMATIVE TEST QUARTER 4 ALL SUBJECTS
GRADE 4 - SUMMATIVE TEST QUARTER 4 ALL SUBJECTSGRADE 4 - SUMMATIVE TEST QUARTER 4 ALL SUBJECTS
GRADE 4 - SUMMATIVE TEST QUARTER 4 ALL SUBJECTS
 

Financal statment analize aci ltd. pirt 2

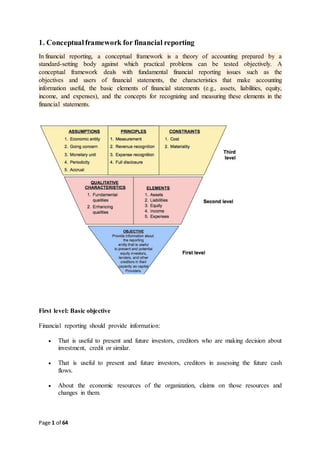
  • 1. Page 1 of 64 1. Conceptualframework for financial reporting In financial reporting, a conceptual framework is a theory of accounting prepared by a standard-setting body against which practical problems can be tested objectively. A conceptual framework deals with fundamental financial reporting issues such as the objectives and users of financial statements, the characteristics that make accounting information useful, the basic elements of financial statements (e.g., assets, liabilities, equity, income, and expenses), and the concepts for recognizing and measuring these elements in the financial statements. First level: Basic objective Financial reporting should provide information:  That is useful to present and future investors, creditors who are making decision about investment, credit or similar.  That is useful to present and future investors, creditors in assessing the future cash flows.  About the economic resources of the organization, claims on those resources and changes in them.
  • 2. Page 2 of 64 Second level: Fundamental concepts Second level of conceptual framework forms a bridge between why of accounting which is the first level and how of accounting which is third level of accounting. Second level of conceptual framework is consisting of: 2. Qualitative characteristics ofaccounting information: Qualitative characteristics of accounting information are identified as a way to distinguish more useful information from the less useful information for decision-making purpose. Qualitative characteristics divided into two types: Primary qualities: Relevance and reliability are two types of primary qualities which makes accounting information more useful for decision-making purpose.  Relevance of information means that the information must be capable of making a difference in decision making. If the information does not make any difference in the decision, then it will be irrelevant. For information to be relevant, it must have a predictive or feedback value and must be presented in a timely basis. The Predictive value of information means an information that help user to make a prediction about past, present and future events. An information which helps a user to confirm prior expectations is called the feedback value of that information. Timeliness means information must be available to the user before it loses its capability to influence.  Information is reliable when it is verifiable, faithfully represented and free from error and bBAS. Verifiability helps user assure that information is faithfully represented. An Information is faithful when it represents what really existed or happened and an information is neutral, when it is free from error or bBAS. Secondary qualities: Comparability and consistency are two types of secondary qualities which influence the decision-making  Information that has been measured and reported in a similar manner for different enterprises is considered as comparable. Comparability lets a user identify the real similarities and differences in economic phenomena.  Consistency means a company should follow a particular method for similar events from period to period. For example, if a company follows the straight line method to charging depreciation, then it should always follow it.
  • 3. Page 3 of 64 Elements of financial statement:  Asset: Asset is a resource which can obtain the probable future economic benefit.  Liability: Liability is a present obligation arising from past events. In other words, liability is the claim against the asset.  Expenses: Expense is an expenditure whose benefit is not fulfilled or enjoyed immediately.  Revenues: Revenue is the inflow of assets which results an increase of owners’ equity.  Equity: Equity is the right to claim ownership when the company dissolves.  Gain: Gain is an increase in the company asset which is not related to sales.  Loss: Loss is a decrease in the company asset which is not related to sales. Third level: Recognition and measurement concept Third level consists of: Basic assumption  Economic entity: Economic entity means that the activity of a business enterprise can be kept separate from its owner and any other business unit. The entity concept does not necessarily refer to a legal entity.  Going concern: The going concern assumption means that the organization will have a long life. It will last long enough to fulfill its objectives and commitments.  Monetary Unit: The monetary unit assumption explains money is the common denominator of an economic activity. The monetary unit is relevant, simple, universally available, understandable and useful.  Periodicity: Periodicity assumption explains that the economic activity of an organization can be divided into artificial time periods. These artificial time periods can vary depending on the organization but most commonly used time periods are monthly, quarterly and yearly. Basic principles  Historical cost: Historical cost principle explains that an asset should be recorded at its cost price (purchase price). It also includes all the cost that was necessary to get the asset ready for use. Historical cost helps an organization distinguish an asset’s original cost from its current cost.  Revenue recognition: Revenue recognition principle states that revenue is recognized when it is earned. For example, ABC Company got an order to produce three hundred shirts. ABC Company will recognize the revenue when they will actually deliver the order and receive the payment.
  • 4. Page 4 of 64  Matching principle: Matching principle means expense is recognized at the time revenue is recognized. For example, ABC Company will recognize the cost of producing three hundred shirts when produced shirts will make a contribution to revenue.  Full disclosure: Full disclosure principle holds that organization should provide all the information that is important enough to make a change in judgment or decision of the user. Constraints:  Cost Benefit Relationship: The costs of providing the information must be weighed against the benefits that can be derived from using the information.  Materiality: Sound and acceptable standards should be followed if the amount involved is significant when compared with the other revenues and expenses, assets and liabilities, or net income of the entity.  Industry Practices: Follow the general practices in the firm's industry, which sometimes requires departure from basic theory.  Conservatism: Conservatism means when in doubt, choose the solution that will be least likely to overstate assets and income. 3. List of BAS& BFRS BAS No. 1 BAS Title Presentation of Financial Statements BAS Effective Date on or after 1 Jan 2010 2 Inventories on or after 1 January 2007 7 Statement of Cash Flows on or after 1 January 1999 8 Accounting Policies, Changes in Accounting Estimates and Errors on or after 1 January 2007 10 Events after the Reporting Period on or after 1 January 1999 11 Construction Contracts on or after 1 January 1999
  • 5. Page 5 of 64 12 Income Taxes on or after 1 January 1999 16 Property, Plant & Equipment on or after 1 January 2007 17 Leases on or after 1 January 2007 18 Revenue on or after 1 January 2007 19 Employee Benefits on or after 1 January 2013 20 Accounting of Government Grants and Disclosure of Government Assistance on or after 1 January 1999 21 The Effects of Changes in Foreign Exchange Rates on or after 1 January 2007 23 Borrowing Costs on or after 1 January 2010 24 Related Party Disclosures on or after 1 January 2007 26 Accounting and Reporting by Retirement Benefit Plans on or after 1 January 2007 27 Separate Financial Statements on or after 1 January 2013 28 Investments in Associates and Joint Ventures on or after 1 January 2013 BAS 29 Financial Reporting in Hyperinflationary Economics on or after 1 January 2015 31 Interest in Joint Ventures on or after 1 January 2007 32 Financial Instruments: Presentation on or after 1 January 2010 33 Earnings per Share on or after 1 January 2007 34 Interim Financial Reporting on or after 1 January 1999 36 Impairment of Assets on or after 1st January 2005 37 Provisions, Contingent Liabilities and Contingent Assets on or after 1 January 2007 38 Intangible Assets on or after 1 January 2005 39 Financial Instruments: Recognition and Measurement on or after 1 January 2010 40 Investment Property on or after 1 January 2007 41 Agriculture on or after 1 January 2007
  • 6. Page 6 of 64 4. BFRS with details Bangladesh Financial Reporting Standard 1 First-time Adoption of Bangladesh Financial Reporting Standards Objective 1 The objective of this BFRS is to ensure that an entity’s first BFRS financial statements, and its interim financial reports for part of the period covered by those financial statements, contain high quality information that: (a) is transparent for users and comparable over all periods presented; (b) provides a suitable starting point for accounting in accordance with Bangladesh Financial Reporting Standards (BFRSs); and (c) Can be generated at a cost that does not exceed the benefits. BFRS / BFRS Title Effective Date on or after BFRS 1 First-time adoption of International Financial Reporting Standards 1 January 2009 BFRS 2 Share-based Payment 1 January 2007 BFRS 3 Business Combinations 1 January 2010 BFRS 4 Insurance Contracts 1 January 2010 BFRS 5 Non-current Assets Held for Sale and Discontinued Operations 1 January 2007 BFRS 6 Exploration for and Evaluation of Mineral Resources 1 January 2007 BFRS 7 Financial Instruments: Disclosures 1 January 2010 BFRS 8 Operating Segments 1 January 2010 BFRS 9 Financial Instruments NA (Not yet adopted but under review process) BFRS 10 Consolidated Financial Statements 1 January 2013 BFRS 11 Joint Arrangements 1 January 2013 BFRS 12 Disclosure of Interests in other Entities 1 January 2013 BFRS 13 Fair Value Measurement 1 January 2013
  • 7. Page 7 of 64 Scope 2 An entity shall apply this BFRS in: (a) its first BFRS financial statements; and (b) each interim financial report, if any, that it presents in accordance with BAS 34 Interim Financial Reporting for part of the period covered by its first BFRS financial statements. 3 An entity’s first BFRS financial statements are the first annual financial statements in which the entity adopts BFRSs, by an explicit and unreserved statement in those financial statements of compliance with BFRSs. Financial statements in accordance with BFRSs are an entity’s first BFRS financial statements if, for example, the entity: (a) presented its most recent previous financial statements: (i) in accordance with national requirements that are not consistent with BFRSs in all respects; (ii) in conformity with BFRSs in all respects, except that the financial statements did not contain an explicit and unreserved statement that they complied with BFRSs; (iii) containing an explicit statement of compliance with some, but not all, BFRSs; (iv) in accordance with national requirements inconsistent with BFRSs, using some individual BFRSs to account for items for which national requirements did not exist; or (v) in accordance with national requirements, with a reconciliation of some amounts to the amounts determined in accordance with BFRSs; (b) prepared financial statements in accordance with BFRSs for internal use only, without making them available to the entity’s owners or any other external users; (c) prepared a reporting package in accordance with BFRSs for consolidation purposes without preparing a complete set of financial statements as defined in BAS 1 Presentation of Financial Statements (as revised in 2007); or (d) did not present financial statements for previous periods. 4 This BFRS applies when an entity first adopts BFRSs. It does not apply when, for example, an entity: (a) stops presenting financial statements in accordance with national requirements, having previously presented them as well as another set of financial statements that contained an explicit and unreserved statement of compliance with BFRSs;
  • 8. Page 8 of 64 Definition of share-based payment A share-based payment is a transaction in which the entity receives goods or services either as consideration for its equity instruments or by incurring liabilities for amounts based on the price of the entity's shares or other equity instruments of the entity. The accounting requirements for the share-based payment depend on how the transaction will be settled, that is, by the issuance of (a) equity, (b) cash, or (c) equity or cash. Scope The concept of share-based payments is broader than employee share options. BFRS 2 encompasses the issuance of shares, or rights to shares, in return for services and goods. Examples of items included in the scope of BFRS 2 are share appreciation rights, employee share purchase plans, employee share ownership plans, share option plans and plans where the issuance of shares (or rights to shares) may depend on market or non-market related conditions. BFRS 2 applies to all entities. There is no exemption for private or smaller entities. Furthermore, subsidiaries using their parent's or fellow subsidiary's equity as consideration for goods or services are within the scope of the Standard. There are two exemptions to the general scope principle:  First, the issuance of shares in a business combination should be accounted for under BFRS 3Business Combinations. However, care should be taken to distinguish share- based payments related to the acquisition from those related to continuing employee services  Second, BFRS 2 does not address share-based payments within the scope of paragraphs 8-10 of BAS 32Financial Instruments: Presentation, or paragraphs 5-7 of BAS 39Financial Instruments: Recognition and Measurement. Therefore, BAS 32 and BAS 39 should be applied for commodity-based derivative contracts that may be settled in shares or rights to shares. BFRS 2 Share-based Payment
  • 9. Page 9 of 64 Background BFRS 3 (2008) seeks to enhance the relevance, reliability and comparability of information provided about business combinations (e.g. acquisitions and mergers) and their effects. It sets out the principles on the recognition and measurement of acquired assets and liabilities, the determination of goodwill and the necessary disclosures. Scope BFRS 3 must be applied when accounting for business combinations, but does not apply to:  The formation of a joint venture* [BFRS 3.2(a)]  The acquisition of an asset or group of assets that is not a business, although general guidance is provided on how such transactions should be accounted for [BFRS 3.2(b)]  Combinations of entities or businesses under common control (the BASB has a separate agenda project on common control transactions) [BFRS 3.2(c)]  Acquisitions by an investment entity of a subsidiary that is required to be measured at fair value through profit or loss under BFRS 10 Consolidated Financial Statements. [BFRS 3.2A] Definition of insurance contract An insurance contract is a "contract under which one party (the insurer) accepts significant insurance risk from another party (the policyholder) by agreeing to compensate the policyholder if a specified uncertain future event (the insured event) adversely affects the policyholder." [BFRS4.Appendix A] Accounting policies The BFRS exempts an insurer temporarily (until completion of Phase II of the Insurance Project) from some requirements of other BFRSs, including the requirement to consider BAS 8Accounting Policies, Changes in Accounting Estimates and Errors in selecting accounting policies for insurance contracts. However, the standard: [BFRS 4.14]  prohibits provisions for possible claims under contracts that are not in existence at the reporting date (such as catastrophe and equalization provisions) BFRS 3 Business Combinations BFRS 4 Insurance Contracts
  • 10. Page 10 of 64  requires a test for the adequacy of recognized insurance liabilities and an impairment test for reinsurance assets  requires an insurer to keep insurance liabilities in its balance sheet until they are discharged or cancelled, or expire, and prohibits offsetting insurance liabilities against related reinsurance assets and income or expense from reinsurance contracts against the expense or income from the related insurance contract. Changes in accounting policies BFRS 4 permits an insurer to change its accounting policies for insurance contracts only if, as a result, its financial statements present information that is more relevant and no less reliable, or more reliable and no less relevant. [BFRS 4.22] In particular, an insurer cannot introduce any of the following practices, although it may continue using accounting policies that involve them: [BFRS 4.25]  measuring insurance liabilities on an undiscounted basis  measuring contractual rights to future investment management fees at an amount that exceeds their fair value as implied by a comparison with current market-based fees for similar services  using non-uniform accounting policies for the insurance liabilities of subsidiaries. Key provisions of BFRS 5 relating to assets held for sale Held-for-sale classification In general, the following conditions must be met for an asset (or 'disposal group') to be classified as held for sale: [BFRS 5.6-8]  management is committed to a plan to sell  the asset is available for immediate sale  an active programmer to locate a buyer is initiated  the sale is highly probable, within 12 months of classification as held for sale (subject to limited exceptions)  the asset is being actively marketed for sale at a sales price reasonable in relation to its fair value  actions required to complete the plan indicate that it is unlikely that plan will be significantly changed or withdrawn BFRS 5 Non-current Assets Held for Sale and Discontinued Operations
  • 11. Page 11 of 64 The assets need to be disposed of through sale. Therefore, operations that are expected to be wound down or abandoned would not meet the definition (but may be classified as discontinued once abandoned). [BFRS 5.13] An entity that is committed to a sale involving loss of control of a subsidiary that qualifies for held-for-sale classification under BFRS 5 classifies all of the assets and liabilities of that subsidiary as held for sale, even if the entity will retain a non-controlling interest in its former subsidiary after the sale. [BFRS 5.8A] Held for distribution to owner’s classification The classification, presentation and measurement requirements of BFRS 5 also apply to a non-current asset (or disposal group) that is classified as held for distribution to owners. [BFRS 5.5A and IFRIC 17] The entity must be committed to the distribution, the assets must be available for immediate distribution and the distribution must be highly probable. [BFRS 5.12A] Disposal group concept A 'disposal group' is a group of assets, possibly with some associated liabilities, which an entity intends to dispose of in a single transaction. The measurement basis required for non- current assets classified as held for sale is applied to the group as a whole, and any resulting impairment loss reduces the carrying amount of the non-current assets in the disposal group in the order of allocation required by BAS 36. [BFRS 5.4] Definitions Exploration for and evaluation of mineral resources means the search for mineral resources, including minerals, oil, natural gas and similar non-regenerative resources after the entity has obtained legal rights to explore in a specific area, as well as the determination of the technical feasibility and commercial viability of extracting the mineral resource. Exploration and evaluation expenditures are expenditures incurred in connection with the exploration and evaluation of mineral resources before the technical feasibility and commercial viability of extracting a mineral resource is demonstrable. Accounting policies for exploration and evaluation BFRS 6 permits an entity to develop an accounting policy for recognition of exploration and evaluation expenditures as assets without specifically considering the requirements of paragraphs 11 and 12 of BAS 8Accounting Policies, Changes in Accounting Estimates and Errors. [BFRS 6.9] Thus, an entity adopting BFRS 6 may continue to use the accounting BFRS 6 Exploration for and Evaluation of Mineral Resources
  • 12. Page 12 of 64 policies applied immediately before adopting the BFRS. This includes continuing to use recognition and measurement practices that are part of those accounting policies. Impairment BFRS 6 effectively modifies the application of BAS 36Impairment of Assets to exploration and evaluation assets recognized by an entity under its accounting policy. Specifically:  Entities recognizing exploration and evaluation assets are required to perform an impairment test on those assets when specific facts and circumstances outlined in the standard indicate an impairment test is required. The facts and circumstances outlined in BFRS 6 are non-exhaustive, and are applied instead of the 'indicators of impairment' in BAS 36 [BFRS 6.19-20]  Entities are permitted to determine an accounting policy for allocating exploration and evaluation assets to cash-generating units or groups of CGUs. [BFRS 6.21] This accounting policy may result in a different allocation than might otherwise arise on applying the requirements of BAS 36  If an impairment test is required, any impairment loss is measured, presented and disclosed in accordance with BAS 36. [BFRS 6.18] BFRS 7:  adds certain new disclosures about financial instruments to those previously required by BAS 32mFinancial Instruments: Disclosure and Presentation (as it was then cited)  replaces the disclosures previously required by BAS 30 Disclosures in the Financial Statements of Banks and Similar Financial Institutions  puts all of those financial instruments disclosures together in a new standard on Financial Instruments: Disclosures. The remaining parts of BAS 32 deal only with financial instruments presentation matters. BFRS 7 Financial Instruments: Disclosures
  • 13. Page 13 of 64 Disclosure requirements of BFRS 7 BFRS requires certain disclosures to be presented by category of instrument based on the BAS 39 measurement categories. Certain other disclosures are required by class of financial instrument. For those disclosures an entity must group its financial instruments into classes of similar instruments as appropriate to the nature of the information presented. [BFRS 7.6] The two main categories of disclosures required by BFRS 7 are: 1. information about the significance of financial instruments. 2. information about the nature and extent of risks arising from financial instruments Information about the significance of financial instruments Statement of financial position  Disclose the significance of financial instruments for an entity's financial position and performance. [BFRS 7.7] This includes disclosures for each of the following categories: [BFRS 7.8] o financial assets measured at fair value through profit and loss, showing separately those held for trading and those designated at initial recognition o held-to-maturity investments o loans and receivables o available-for-sale assets o financial liabilities at fair value through profit and loss, showing separately those held for trading and those designated at initial recognition o financial liabilities measured at amortized cost Scope BFRS 8 applies to the separate or individual financial statements of an entity (and to the consolidated financial statements of a group with a parent):  whose debt or equity instruments are traded in a public market or  that files, or is in the process of filing, its (consolidated) financial statements with a securities commission or other regulatory organization for the purpose of issuing any class of instruments in a public market [BFRS 8.2] However, when both separate and consolidated financial statements for the parent are presented in a single financial report, segment information need be presented only on the basis of the consolidated financial statements [BFRS 8.4] BFRS 8 Operating Segments
  • 14. Page 14 of 64 Operating segments BFRS 8 defines an operating segment as follows. An operating segment is a component of an entity: [BFRS 8.2]  that engages in business activities from which it may earn revenues and incur expenses (including revenues and expenses relating to transactions with other components of the same entity)  whose operating results are reviewed regularly by the entity's chief operating decision maker to make decisions about resources to be allocated to the segment and assess its performance and  for which discrete financial information is available Reportable segments BFRS 8 requires an entity to report financial and descriptive information about its reportable segments. Reportable segments are operating segments or aggregations of operating segments that meet specified criteria: [BFRS 8.13]  its reported revenue, from both external customers and intersegment sales or transfers, is 10 per cent or more of the combined revenue, internal and external, of all operating segments, or  the absolute measure of its reported profit or loss is 10 per cent or more of the greater, in absolute amount, of (i) the combined reported profit of all operating segments that did not report a loss and (ii) the combined reported loss of all operating segments that reported a loss, or  its assets are 10 per cent or more of the combined assets of all operating segments. Two or more operating segments may be aggregated into a single operating segment if aggregation is consistent with the core principles of the the standard, the segments have similar economic characteristics and are similar in various prescribed respects. [BFRS 8.12] If the total external revenue reported by operating segments constitutes less than 75 per cent of the entity's revenue, additional operating segments must be identified as reportable segments (even if they do not meet the quantitative thresholds set out above) until at least 75 per cent of the entity's revenue is included in reportable segments.
  • 15. Page 15 of 64 Initial measurement of financial instruments All financial instruments are initially measured at fair value plus or minus, in the case of a financial asset or financial liability not at fair value through profit or loss, transaction costs. [BFRS 9, paragraph 5.1.1] Subsequent measurement of financial assets BFRS 9 divides all financial assets that are currently in the scope of BAS 39 into two classifications - those measured at amortized cost and those measured at fair value. Where assets are measured at fair value, gains and losses are either recognized entirely in profit or loss (fair value through profit or loss, FVTPL), or recognized in other comprehensive income (fair value through other comprehensive income, FVTOCI). For debt instruments the FVTOCI classification is mandatory for certain assets unless the fair value option is elected. Whilst for equity investments, the FVTOCI classification is an election. Furthermore, the requirements for reclassifying gains or losses recognized in other comprehensive income are different for debt instruments and equity investments. The classification of a financial asset is made at the time it is initially recognized, namely when the entity becomes a party to the contractual provisions of the instrument. [BFRS 9, paragraph 4.1.1] If certain conditions are met, the classification of an asset may subsequently need to be reclassified. Debt instruments A debt instrument that meets the following two conditions must be measured at amortised cost (net of any write down for impairment) unless the asset is designated at FVTPL under the fair value option model test: The objective of the entity's business model is to hold the financial asset to collect the contractual cash flows (rather than to sell the instrument prior to its contractual maturity to realize its fair value changes). flow characteristics test: The contractual terms of the financial asset give rise on specified dates to cash flows that are solely payments of principal and interest on the principal amount outstanding. BFRS 9 Financial Instruments
  • 16. Page 16 of 64 The objective of BFRS 10 is to establish principles for the presentation and preparation of consolidated financial statements when an entity controls one or more other entities. [BFRS 10:1] The Standard: [BFRS 10:1]  requires a parent entity (an entity that controls one or more other entities) to present consolidated financial statements  defines the principle of control, and establishes control as the basis for consolidation  set out how to apply the principle of control to identify whether an investor controls an investee and therefore must consolidate the investee  sets out the accounting requirements for the preparation of consolidated financial statements  defines an investment entity and sets out an exception to consolidating particular subsidiaries of an investment entity Changes in ownership interests Changes in a parent's ownership interest in a subsidiary that do not result in the parent losing control of the subsidiary are equity transactions (i.e. transactions with owners in their capacity as owners). When the proportion of the equity held by non-controlling interests changes, the carrying amounts of the controlling and non-controlling interests area adjusted to reflect the changes in their relative interests in the subsidiary. Any difference between the amount by which the non-controlling interests are adjusted and the fair value of the consideration paid or received is recognized directly in equity and attributed to the owners of the parent Joint arrangements A joint arrangement is an arrangement of which two or more parties have joint control. [BFRS 11:4] A joint arrangement has the following characteristics: [BFRS 11:5]  the parties are bound by a contractual arrangement, and  the contractual arrangement gives two or more of those parties joint control of the arrangement. BFRS 10 Consolidated Financial Statements BFRS 11 Joint Arrangements
  • 17. Page 17 of 64 A joint arrangement is either a joint operation or a joint venture. [BFRS 11:6] Joint control Joint control is the contractually agreed sharing of control of an arrangement, which exists only when decisions about the relevant activities require the unanimous consent of the parties sharing control. [BFRS 11:7] Before assessing whether an entity has joint control over an arrangement, an entity first assesses whether the parties, or a group of the parties, control the arrangement (in accordance with the definition of control in BFRS 10Consolidated Financial Statements). [BFRS 11:B5] After concluding that all the parties, or a group of the parties, control the arrangement collectively, an entity shall assess whether it has joint control of the arrangement. Joint control exists only when decisions about the relevant activities require the unanimous consent of the parties that collectively control the arrangement. [BFRS 11:B6] The requirement for unanimous consent means that any party with joint control of the arrangement can prevent any of the other parties, or a group of the parties, from making unilateral decisions (about the relevant activities) without its consent. [BFRS 11:B9] Types of joint arrangements Joint arrangements are either joint operations or joint ventures:  A joint operation is a joint arrangement whereby the parties that have joint control of the arrangement have rights to the assets, and obligations for the liabilities, relating to the arrangement. Those parties are called joint operators. [BFRS 11:15]  A joint venture is a joint arrangement whereby the parties that have joint control of the arrangement have rights to the net assets of the arrangement. Those parties are called joint ventures. [BFRS 11:16] Objective and scope The objective of BFRS 12 is to require the disclosure of information that enables users of financial statements to evaluate: [BFRS 12:1]  the nature of, and risks associated with, its interests in other entities  the effects of those interests on its financial position, financial performance and cash flows. Where the disclosures required by BFRS 12, together with the disclosures required by other BFRSs, do not meet the above objective, an entity is required to disclose whatever additional information is necessary to meet the objective. [BFRS 12:3] BFRS 12 Disclosure of Interests in other Entities
  • 18. Page 18 of 64 BFRS 12 is required to be applied by an entity that has an interest in any of the following: [BFRS 12:5]  subsidiaries  joint arrangements (joint operations or joint ventures)  associates  unconsolidated structured entities BFRS 12 does not apply to certain employee benefit plans, separate financial statements to which BAS 27Separate Financial Statements applies (except in relation to unconsolidated structured entities and investment entities in some cases), certain interests in joint ventures held by an entity that does not share in joint control, and the majority of interests in another entity accounted for in accordance with BFRS 9Financial Instruments. [BFRS 12:6] An investment entity that prepares financial statements in which all of its subsidiaries are measured at fair value through profit or loss presents the disclosures relating to investment entities required by BFRS 12. Objective BFRS 13: [BFRS 13:1]  defines fair value  sets out in a single BFRS a framework for measuring fair value  requires disclosures about fair value measurements. BFRS 13 applies when another BFRS requires or permits fair value measurements or disclosures about fair value measurements (and measurements, such as fair value less costs to sell, based on fair value or disclosures about those measurements), except for: [BFRS 13:5-7]  share-based payment transactions within the scope of BFRS 2Share-based Payment  leasing transactions within the scope of BAS 17Leases  measurements that have some similarities to fair value but that are not fair value, such as net realizable value in BAS 2Inventories or value in use in BAS 36Impairment of Assets. BFRS 13 Fair Value Measurement
  • 19. Page 19 of 64 Fair value hierarchy Overview BFRS 13 seeks to increase consistency and comparability in fair value measurements and related disclosures through a 'fair value hierarchy'. The hierarchy categorizes the inputs used in valuation techniques into three levels. The hierarchy gives the highest priority to (unadjusted) quoted prices in active markets for identical assets or liabilities and the lowest priority to unobservable inputs. [BFRS 13:72] If the inputs used to measure fair value are categorized into different levels of the fair value hierarchy, the fair value measurement is categorized in its entirety in the level of the lowest level input that is significant to the entire measurement (based on the application of judgment). [BFRS 13:73] Level 1 inputs Level 1 inputs are quoted prices in active markets for identical assets or liabilities that the entity can access at the measurement date. [BFRS 13:76] A quoted market price in an active market provides the most reliable evidence of fair value and is used without adjustment to measure fair value whenever available, with limited exceptions. [BFRS 13:77] If an entity holds a position in a single asset or liability and the asset or liability is traded in an active market, the fair value of the asset or liability is measured within Level 1 as the product of the quoted price for the individual asset or liability and the quantity held by the entity, even if the market's normal daily trading volume is not sufficient to absorb the quantity held and placing orders to sell the position in a single transaction might affect the quoted price. [BFRS 13:80] Level 2 inputs Level 2 inputs are inputs other than quoted market prices included within Level 1 that are observable for the asset or liability, either directly or indirectly. [BFRS 13:81] Level 2 inputs include:  quoted prices for similar assets or liabilities in active markets  quoted prices for identical or similar assets or liabilities in markets that are not active  inputs other than quoted prices that are observable for the asset or liability, for example o interest rates and yield curves observable at commonly quoted intervals o implied volatilities o credit spreads  inputs that are derived principally from or corroborated by observable market data by correlation or other means ('market-corroborated inputs').
  • 20. Page 20 of 64 5. Annual report Analyze (ACI) 2010-2014 Brief History ACI was established as the subsidiary of Imperial Chemical Industries (ICI) in the then East Pakistan in 1968. After independence the company has been incorporated in Bangladesh on the 24th of January 1973 as ICI Bangladesh Manufacturers Limited and also as Public Limited Company. This Company also obtained listing with Dhaka Stock Exchange on 28 December, 1976 and its first trading of shares took place on 9 March, 1994. Later on 5 May, 1992, ICI plc divested 70% of its shareholding to local management. Subsequently the company was registered in the name of Advanced Chemical Industries Limited. Listing with Chittagong Stock Exchange was made on 22 October 1995 Advanced Chemical Industries (ACI) Limited is one of the leading conglomerates in Bangladesh, with a multinational heritage. The company has diversified into four major Strategic Business Units Mission ACI’s mission is to enrich the quality of life of people through responsible application of knowledge, skills and technology. ACI is committed to the pursuit of excellence through
  • 21. Page 21 of 64 world-class products, innovative processes and empowered employees to provide the highest level of satisfaction to its customers. Vision To realize the mission ACI will:  Endeavor to attain a position of leadership in each category of its businesses.  Attain a high level of productivity in all its operations through effective and efficient use of resources, adoption of appropriate technology and alignment with our core competencies.  Develop its employees by encouraging empowerment and rewarding innovation.  Promote an environment for learning and personal growth of its employees.  Provide products and services of high and consistent quality, ensuring value for money to its customers.  Encourage and assist in the qualitative improvement of the services of its suppliers and distributors.  Establish harmonious relationship with the community and promote greater environmental responsibility within its sphere of influence ACI Quality Policy One of our important visions is to provide products and services of high and consistent quality, ensuring value for money to our customers. To attain the Vision ACI will:  Aim to achieve business excellence by understanding, accepting, meeting and exceeding customer expectations.  Follow International Standards on Quality Management System to ensure consistent quality of products and services to achieve customer satisfaction.  ACI will also meet all national and regulatory requirements relating to its current businesses and ensure that current Good Manufacturing Practice (cGMP) as recommended by World Health Organization is followed for its pharmaceutical operations and conform to all other guidelines and best practices relating to its other businesses.  Commit itself to quality as the prime consideration in all its business decisions. All employees of ACI follow documented procedures to ensure compliance with quality standards.  Develop a pool of human resources of the Company to their full potential through regular training and participation in seeking continuous improvement of the Quality Management System.
  • 22. Page 22 of 64 ACI Group’s five Years Comparative Statistics From 2010-2014 5.1. Financial Ratio Analysis Financial ratios are useful indicators of a firm's performance and financial situation. Most of the ratios can be calculated from information provided in the financial statements. Objectives of Financial Ratio Analysis:  To analyze the financial statements of ACI Ltd.    To calculate the different types of financial ratios of the company.    To know the financial condition of the company.   To know the company’s financial development for last five years 5.1.1Methodology For calculating different types of ratios for the project work, the following formulae were used: Liquidity Ratios: 1. Current Ratio = CURRENT ASSETS CURRENT LIABILITIES It’s a measures a company’s ability to meet short term obligations with short term assets, a useful indicator of cash flow in the near future. A social enterprise needs to ensure that it can pay its salaries, bills and expenses on time. Failure to pay loans on time may limit your future access to credit and therefore your ability to leverage operations and growth. The one problem with the current ratio is that it does not take into account the timing of cash flows.
  • 23. Page 23 of 64 2. Quick Ratio (Acid-Test Ratio) = QUICK ASSETS CURRENT LIABILITIES A more stringent liquidity test that indicates if a firm has enough short-term assets (without selling inventory) to cover its immediate liabilities. This is often referred to as the “acid test” because it only looks at the company’s most liquid assets only (excludes inventory) that can be quickly converted to cash). A ratio of 1:1 means that a company can pay its bills without having to sell inventory. 3. Working Capital = Current Asset – Current Liabilities Working Capital is a measure of both a company's efficiency and its short-term financial health. Activity Ratios: 1. Inventory Turnover Ratio :- Sales or revenue/ inventory It is the calculation the number of times inventory is turning over into sales during the year or how many days it takes to sell inventory. This is a good indication of production and purchasing efficiency. A high ratio indicates inventory is selling quickly and that little unused inventory is being stored (or could also mean inventory shortage). If the ratio is low, it suggests overstocking, obsolete inventory or selling issues. 2. Total Asset Turnover Ratio:- Sales or revenue/ total asset Total Asset Turnover Ratio is the company's total revenue, the invoice, cash payments and other revenues. Total Asset Turnover Ratio represents the value of goods and services provided to customers during a specified time period - usually one year. How efficiently a business generates sales on each currency of assets. An increasing ratio indicates a company is using its assets more productively. 3. Days Sales Outstanding (DSO) = ( Accounts Receivable / total sales ) *No.ofDAYS It is a measurement of the average number of days that a company takes to collect revenue
  • 24. Page 24 of 64 after a sale has been made. A low DSO number means that it takes a company fewer days to collect its accounts receivable. A high DSO number shows that a company is selling its product to customers on credit and taking longer to collect money. 4. Average Payment Period = (ACCOUNTSPAYABLE  NO. OF DAYS) NET PURCHASES or COGS The average time period in which a business or company typically takes in paying off its purchases that have been made by credit. This will not have an effect on the company's working capital. A shorter payment period indicates prompt payments to creditors. Leverage Ratios: 1. Debt Ratio = TOTAL DEBT 100 TOTAL ASSET It is a financial ratio that measures the extent of a company’s or consumer’s leverage. The debt ratio is defined as the ratio of total debt to total assets, expressed in percentage, and can be interpreted as the proportion of a company’s assets that are financed by debt. The higher this ratio, the more leveraged the company and the greater its financial risk. Profitability Ratios: 1. Net Profit Ratio = NET PROFIT SALES or REVENUE A ratio of profitability calculated as net income divided by revenues, or net profits divided by sales. It measures how much out of every currency of sales a company actually keeps in earnings. Profit margin is very useful when comparing companies in similar industries. A higher profit margin indicates a more profitable company that has better control over its costs compared to its competitors. This ratio measures your ability to cover all operating costs including indirect costs
  • 25. Page 25 of 64 2. Return on Equity = NET INCOMEAVAILABLE FOR COMMONSTOCKHOLDERS STOCKHOLDER'S EQUITY The amount of net income returned as a percentage of shareholders equity. Return on equity measures a corporation's profitability by revealing how much profit a company generates with the money shareholders have invested. This is one of the most important ratios to investors. How does this return compare to less risky investments like bonds. 3. Return on Assets (ROA) = NET INCOME TOTAL ASSET It’s a measurement of the ability of a company to turn the assets into profit. This is a very useful measure of comparison within an industry. A low ratio compared to industry may mean that your competitors have found a way to operate more efficiently. After tax interest expense can be added back to numerator since ROA measures profitability on all assets whether or not they are financed by equity or debt. 4. Earnings per Share (EPS) = NET INCOME TOTAL NO. OF COMMON STOCK OUTSTANDING The portion of a company's profit allocated to each outstanding share of common stock. Earnings per share serve as an indicator of a company's profitability. 6. Analysis of the ratios 6.1. Liquidity ratio Ratio 2010 2011 2012 2013 2014 Current Ratio (Times) 1.42 2.09 1.17 1.17 1.19
  • 26. Page 26 of 64 Quick Ratio (Times) 1.00 0.98 0.87 0.85 0.83 Working Capital (Taka) 1713.96 5780.92 1232.99 1360.28 1568.37 Graphical presentationof different types of Liquidity Ratios: 1. Current Ratio: Current ratio is used to gauge the ability of a company to meet its liabilities with its assets. This ratio gives an idea about the financial health of an organization. The higher ratio reflects the more capability of a company to pay its liabilities. Current ratio of ACI Limited is 1.19 times in 2014 and was relatively stable in the past five years except in 2011. The ratio was highest in 2011. Current ratio of 2014 suggests that the company is liquid and in a good position to meet its current obligations. 2. Quick Ratio: It’s also known as Acid-test ratio. This ratio is an indicator of short-term liquidity of a company. The quick ratio was highest, 1times, in 2010 after that it gradually decreased and in 2014 it was 0.83 times. This ratio is also a sign that the company is in liquid position to meet 0.00% 0.50% 1.00% 1.50% 2.00% 2.50% 2010 2011 2012 2013 2014 Series 1
  • 27. Page 27 of 64 its short-term obligations. 3. Working Capital: Working capital indicates the operating liquidity of a company. Higher the working capital higher the ability of the company to pay off its short term obligation and it’s also a signal that the company can expand its business. In 2014 Working capital was BDT 1568 Million which was the highest in the year 2011. The working capital were increased from 2010 to 2011 but in 2012 it reduced to BDT 1233 Million and after that it was increasing in the rest of the year. In 2014 working capital was BDT 1568 Mio. 6.2. Activity Ratios Ratio 2010 2011 2012 2013 2014 Inventory Turnover Ratio (Times) 4.61 4.81 4.55 4.18 4.16 Total Asset Turnover Ratio (Times) 0.82 0.77 0.73 0.73 0.79 Days Sales Outstanding (Days) 149.78 182.46 202.07 195.31 169.57 Average Payment Period (Days) 66.92 98.16 79.70 102.72 81.80 0.00% 0.20% 0.40% 0.60% 0.80% 1.00% 1.20% 2010 2011 2012 2013 2014 Series 1
  • 28. Page 28 of 64 Table.2: Results of the Activity Ratio Analysis Graphical presentation of different types of Activity Ratios: 1. Inventory Turnover Ratio: Inventory turnover ratio indicates how well the company managed its inventory. High value of the ratio reflects good management of inventory. In 2014 the ratio was 4.16 times and the ratio is slightly decreasing from 2010. Inventory turnover ratio was the highest, 4.81 times, in 2011. 2. Total Asset Turnover Ratio: It is the calculation of how many BDT of Sales or revenues are generated by a company in relation to its asset. The higher the ratio, the better the company is performing that is the company is generating more revenue from each BDT of asset. The ratio was decreasing from 2010 to 2013 but in 2014 it was 0.79 times which was higher than last three years.
  • 29. Page 29 of 64 3. Days Sales Outstanding (DSO): It is a measurement of average number of days that a company takes to collect revenues after a sale has been made. The trend line of Days Sales Outstanding (DSO) of ACI Limited is relatively stable. In 2014 Days Sales Outstanding (DSO) was 170 days which means it takes 170 days on an average to collect the revenue after the sales. In 2012 it took 202 days to collect revenues. 4. Average Payment Period: Average payment period means the average time period is taken by a company in making payments to its debtors. The average time period of ACI Limited is fluctuating year to year. In 2014 Average Payment Period was 82 days which mean prompt payment is made to the creditors. In 2013 it took 103 days to make payment to the creditors which were higher in between 2010 to 2014.
  • 30. Page 30 of 64 6.3. Leverage Ratios Ratio 2010 2011 2012 2013 2014 Debt Ratio (Percentage) 0.54 0.57 0.62 0.62 0.79 Table.3: Results of the Leverage Ratio Analysis Graphical presentationof Leverage Ratio: 1. Debt Ratio: Debt ratio indicates the percentage of assets financed by all types of debts. It reflects the financial structure of an organization. Higher percentage of debt ratio means more financial risk in the organization. The debt ratio trend is more or less stable over the last five years but in 2014 the debt ratio percentage has increased which is 0.79. The percentage value is highest in last five years which is alarming for the company.
  • 31. Page 31 of 64 6.4. Profitability Ratios Ratio 2010 2011 2012 2013 2014 Net Profit Ratio (Percentage) 0.07 0.08 0.06 0.07 0.08 Return on Equity (Perrcentage) 0.03 0.04 (0.07) 0.03 0.11 Return on Assets (Perrcentage) 0.06 0.06 0.04 0.05 0.06 Earnings Per Share (BDT) 30.49 34.55 22.93 26.74 27.64 Graphical presentationof different types of Profitability Ratios: 1. Net Profit Ratio: This ratio is an indicator of profitability of an organization. It shows how much money is kept out of each BDT of sales or revenues by an organization in the form of its earning. Except the year 2012, the percentage was stable for ACI Limited. In 2014 it was 0.08 which means BDT
  • 32. Page 32 of 64 8 was kept as earning of ACI Limited out of each BDT 100 of sales. 2. Return on Equity (ROE): ROE measures how much the shareholders earned for their investment in the company. The higher percentage means higher returns to the investors. In 2012 the value of ROE was alarming but in the next year ACI Limited recovers from the turmoil and in 2014 it produces highest value of ROE which is 0.11.
  • 33. Page 33 of 64 3. Return on Assets (ROA): It measures how profitably a firm has utilized its assets. The higher the ROA percentage the more a company is earning, the more efficiently the company is converting its assets to profit. In 2014 the ROA percentage was 0.06 with less fluctuation than last five years. 4. Earnings Per Share (EPS): Earnings per share indicate a company’s profitability. In 2011 the EPS was highest but then it Decreases and in 2014 it was BDT 27.64.
  • 34. Page 34 of 64 7. Result and Discussion Ratio Analysis is a kind of Financial Statement Analysis that is used to gain a quick suggestion of a firm's financial health in several key areas. For the project purpose I have analyzed the following Categories of ratios:  Liquidity ratios    Activity ratios    Leverage ratios    Profitability ratios  Liquidity ratios: Liquidity ratios are used asses firm’s ability to meet its short- term obligations using short- term assets. The short-term obligations are recorded under current liabilities that come due within one financial year. Short-term assets are the current assets. Current ratio indicates the ability of a company to meet its short term obligation. Any value below 1 indicates the weakness of financial health of a company on the other hand value over 2 suggests that the company is not investing its excess assets. Ratio between 1.1 to 2.0 reflects strong financial condition of a company. Current ratio of ACI limited is 1.19 times in 2014 which means the company is in liquid condition to meet its obligation. In 2011 the ratio was 2.09 which were above normal but again from 2012 the ratio come down to normal level and become relatively stable. Quick ratio also measures the liquidity of an organization but this ratio further narrowed down to measure the ability of a company to meet its immediate liabilities, without selling its inventory. This known as the “acid test” because it only looks at the company’s most liquid assets that can be quickly converted to cash). Quick ratio of ACI Limited was highest in 2010 (1.00 times) but it gradually decreased in the next four years and in 2014 it was 0.83 times. Quick ratio of ACI Limited also indicates its healthy financial condition. Working capital reveals a company’s efficiency and its short term financial health. A positive value of working capital shows the ability of a company to pay back the liabilities to the creditors in the short term and it also gives an idea of the company’s operational efficiency to the investors. Continuous declining in the working capital is a red alert for an organization it
  • 35. Page 35 of 64 may also led to the bankruptcy. In 2011 the working was BDT 5781 Million which was sharply declined to BDT 1233 Million in 2012 after that it increases and in 2014 it was BDT 1568 Million. Huge amount of working capital also encourage a company to diversify its business. ACI Limited has more opportunity to expand its business with the support of its good financial condition. Activity ratios: Activity ratios are also known as Asset management ratios also indicate the efficiency of the use of assets in generating sales. Inventory turnover ratio is the measurement of no. of times the inventory of a company is turned over in a year. This ratio is an indication of production and purchasing efficiency. The higher value shows quick selling of the inventory and a little unused amount of the inventory. In last five years (2010-2014) highest value was 4.81 times in 2011 but it decreases gradually and in 2014 it was 4.16 times. The result reveals the good management of the inventory and very high production capacity of ACI Limited. Total asset turnover ratio is the measurement of the efficiency of use of the total assets in generating sales. This ratio indicates how efficiently an organization uses its assets. High value of the ratio means more efficiency in using its assets. Total asset turnover ratio of ACI Limited was highest, 0.82 times, in 2010 but it was declining up to 2013. In 2014 it was 0.79 times which means ACI Limited is generating BDT 0.79 from single BDT of its assets. The result reveals the higher efficiency of ACI Limited in using its total assets. Days sales outstanding reveal the no. of days a business take to collect cash from the market after credit sales. ACI Limited took 170 days in 2014 for collecting its receivables which was 202 days in 2012. Collection in short period is good sign for ACI Limited because by quickly turning sales into cash the company has the possibility to put the cash to reinvest and make more sales. Average payment period is average time period is taken by a company to making payment to its creditors. The result of Average payment period of ACI Limited varies every year. In 2014 it was 82 days which indicates ACI Limited took 82 days to make payment to the creditors.
  • 36. Page 36 of 64 Leverage ratios: Companies depend on both owners’ equity and debt for financing in the business operations. Leverage ratio is a financial measurement that looks at how much capital comes in the form of debt, or judges the ability of a company to meet its financial obligations. Higher level of debt can be risky for a company and its investors. On the other hand, low level of debts can also raise questions to investors. Unwillingness to borrow may be an indication that operating margins are simply too tight. Debt ratio measure the ratio of debt to assets. The higher this ratio, the more leveraged the company and the greater its financial risk. Debt ratio of ACI Limited was increasing from 2010. In 2014 debt ratio is 0.79 (79%), which was the highest value in last five years. Debt ratio of 2014 suggests that ACI Limited is getting more financial leverage but more financial risk is associated with the company. Profitabilityratios: Profitability ratios are used to assess a business's capability to generate earnings as compared to its expenses and other relevant costs incurred during a specific period of time. Higher value Profitability ratios from a previous period indicate that the company is doing well. Net profit ratio actually measures how much from every BDT of revenue a company is keeping as its earnings. Net profit ratio was relatively stable for ACI Limited from 2010 to 2014. In 2012 the ratio was the lowest, 0.06 (6%) but ACI Limited has regained its ration in 2014 which was 0.08 (8%). The result reveals that ACI Limited is keeping BDT 8 as its earning from each BDT 100 of revenues. This leads ACI Limited to a very healthy financial position. Return on equity is the amount of net income gained as a percentage of shareholders equity. Return on equity measures a company’s profitability by illuminating how much profit a company is generating with the money shareholders have invested. Return on equity of ACI Limited was negative (-7%) in 2012 which means their return was less than their equity and they incurred loss in 2012. In 2013 the ratio turned to positive and in 2014 they become stronger and the ratio was 0.11 (11%) which was the highest value in last five years. The ratio suggests that the shareholders are earning BDT 11 from every BDT 100 of investment.
  • 37. Page 37 of 64 Return on asset is the measurement of a company’s ability to turn assets into profit. It is an indicator of how profitable a company is relative to its total assets. Return on asset of ACI Limited was steady in last five years. In 2014 it was 0.06 (6%) which means ACI Limited is generating 6 taka of profit from every 100 taka of its assets. Steady trend line indicates good financial management of ACI Limited. An Earnings per share is the portion of a company's profit to be paid to each outstanding share. Earnings per share is an indicator of determining a share’s price. Higher amount of EPS is desirable for the share holders and it increases the confidence of the investors. EPS of ACI Limited was highest in 2011 (BDT 34.55) and lowest in 2012 (BDT 22.93) because of incurring loss in 2012. But they come back strongly and the EPS was BDT 27.64 in 2014.
  • 38. Page 38 of 64 8. Share Performance Analysis Investing in the stocks gives investors the opportunity to get to know about the company and feel comfortable about where the investor’s money is going. Individual stocks have a greater upside potential than most mutual funds. 9. Objectives of Share Performance Analysis:  To know the current market position of the security as an investors.    To assess the risk associated with the security and the market.    To determine the correlation of the security with market.    To determine the volatility of the security.  10. Methodology For calculating different parameters of share performance of ACI Ltd., the following formulae were used: 1. Return The gain or loss of a security in a particular period is the return. The return consists of the income and the capital gains relative on an investment. It is usually quoted as a percentage. The general rule is that the more risk you take, the greater the potential for higher return - and loss. For project purpose monthly return of ACI Limited’s security was calculated by using following formula: Return = (Month End Price – Month beginning Price) / Month beginning Price The mean return from the security of ACI Limited was calculated by using following formula.
  • 39. Page 39 of 64 X   X n Where, X = Daily return of a single security n = Total number of days Yearly Mean return was computed by multiplying 12 with the Average monthly return of the security of ACI Limited. 2. Risk The risk of financial assets can be measured with an absolute measure of dispersion or variability of returns, called the variance. An equivalent measure of total risk is the square root of the variance, the standard deviation, which measure the deviation of each observation from the arithmetic mean of the observations and is a reliable measure of variability. The symbol σ2 is used to denote the variance and σ is used to denote the standard deviation. Variance is calculated as: n X  X 2 σ2 = i 1 and σ=  2 n 1 Where σ2 = the variance of the daily returns σ = Standard deviation, the risk X = The value of daily returns X = the mean of the daily returns n = the number of returns 3. Correlation (ρij) In the world of finance, a statistical measure of how two securities moves in relation to each other or how a securities moves in relation with the market. Correlation coefficient ranges
  • 40. Page 40 of 64 between -1 and +1. Perfect positive correlation (a correlation co-efficient of +1) implies that as one security moves, either up or down, the other security will move in the same direction. Alternatively, perfect negative correlation (a correlation co-efficient of -1) means that if one security moves in either direction the security that is perfectly negatively correlated will move in the opposite direction. Correlation denoted by ρij. 4. Beta [Slope (β)] It is the measurement of the volatility, or systematic risk, of a security or a portfolio in comparison to the market as a whole. Beta is used in the capital asset pricing model (CAPM), a model that calculates the expected return of an asset based on its beta and expected market returns. It’s Also known as "beta coefficient." Beta is calculated using regression analysis, and beta is the indicator of a security's returns to respond to variation in the market. A beta of 1 indicates that the security's price will move with the market. A beta of less than one means that the security will be less volatile than the market. A beta of greater than 1 indicates that the security's price will be more volatile than the market. For example, if a stock's beta is 1.2, it's theoretically 20% more volatile than the market. 5. Alpha [Intercept (α)] It is the measurement of performance on a risk-adjusted basis. Alpha takes the volatility (price risk) of a security and compares its risk-adjusted performance to a benchmark index. The excess return of the fund relative to the return of the benchmark index is a securities’ alpha.
  • 41. Page 41 of 64 11. Result and Discussion Return is the main component of an investment which is the ultimate desire of an investor. Return is the gain or loss of a security in a particular period of time. It consists of the income and capital gain based on an investment. Usually return is expressed in terms of percentage (%). The average return per month from the security of ACI Limited is 0.1182 (11.82%), and yearly return is 1.4179 (141.84%) whereas average return per month from the market is 0.0054 (0.54%) and yearly return is 0.0649 (6.49%). Securities of ACI Limited is providing high return to the investors. As a public limited company it’s very good for the company and for the investors to have such high percentage of return. In the bearish market securities of ACI Limited is providing high return which ultimately increasing the confidence of investors. Considering the market condition investors can invest more in the securities of ACI Limited. Risk is the chance that actual return of an investment will be different from expectations. Risk includes the possibility of losing some or all of the original investment. Risk is computed by standard deviation and higher value of the standard deviation means higher risk is associated with the investment. The risk associated with this security is 0.2357, this mean actual return may deviate 23.57% from the anticipated return. But considering the higher percentage of return from this stock in the bearish market investors are compensating for taking on additional risk. All the risk taking investors know high return is associated with higher percentage of risk. The risk associated with the market is 0.0569 which suggest that actual return may deviate 5.69% from expected return. Less return is associated with the market as the return is less. Taking into account, the market situation, securities of ACI Limited is offering more risk with higher percentage of return. Correlation is the statistical measure of how two securities moves in relation to each other or how a securities moves with the market. Correlation of the securities of ACI Limited with the market is 0.0516. The relation is positive. This relation indicates that all the parameters of this security moves positively with the market. If the market goes up the parameters of securities of ACI Limited rise up by 5.16% and same results happen when market goes down. But considering the value of correlation this security is less sensitive with the market. Beta (slope) is the measurement of volatility of a stock with the market, which means how many units of return from a stock, is changed with the unit change in return from the market. Beta describes an investment's sensitivity to broad market movements. The value of the Slope (β) for this security is 0.2136. Stocks of ACI Limited moves in the same direction as market,
  • 42. Page 42 of 64 but less susceptible to fluctuation of the market. Alpha is the Y intercept of the regression line. The Intercept [alpha coefficient (α)] is a parameter in the Capital Asset Pricing Model (CAPM). It is the intercept of the security characteristic line (SCL). Value of the intercept (α) is 0.1170; which implies that if the standard return is 0% investors would expect their investment to return 11.70% so the investment in the security of ACI Limited was safe for the return.
  • 43. Page 43 of 64 12. Summery For better understanding of the financial condition of ACI Limited, various ratios have been computed. All the ratios support good financial condition of ACI Limited. Liquidity ratios (Current ratio, Quick ratio and Working capital) indicate ACI Limited has very strong financial ground to expand its business in future and continuously supports its existing business. Activity ratio (Inventory turnover ratio, Total asset turnover ratio, Days sales outstanding and Average payment period) illuminates that the total asset is managing well by ACI limited. Inventory turnover ratio and Total asset turnover ratio reflects the good management of the inventory, high production capacity and high efficiency in using total asset. Average payment period is short (82 days) considering the payables but Days sales outstanding is too long (170 days). They need to concentrate to minimize Days sales outstanding days. Leverage ratio (Debt ratio) suggests that ACI Limited has a good control on their debt and asset. They are enjoying more financial leverage but higher financial risk is associated with ACI Limited. Profitability ratio (Net profit ratio, ROE, ROA, and EPS) of ACI Limited supports their good liquid financial standing. ACI Limited is managing their wealth in a very productive manner and in returns they are providing handsome amount in the form of earnings to the share holders. With good financial position ACI Limited is providing earnings to the share holders which ultimately increasing the image of ACI Limited and gaining confidence of the investors. As an investor analyzing the share performance in the market is very important. Each investor is very sensitive with the return. With limited invest every investor desire to achieve a minimum return which compensates the risk associated with the investment. For the project purpose different parameter of share performance of ACI Limited was analyzed. Value of all the parameters suggests high performance of the securities of ACI Limited comparing with the market. In the bearish market they are ensuring 11.82% of average monthly return with 23.57% of risk.
  • 44. Page 44 of 64 13. Recommendations After analyzing all the ratios and parameters of the share performance following Recommendations for ACI Limited can be offered:  ACI Limited is maintaining a healthy financial condition they should invest more in new business with its working capital to obtain more financial liquidity in the future.    They should decrease the no. of days in Days Sales Outstanding (DSO) to collect its receivables more quickly to convert its sales into cash. So that they can reinvest in the   Business operation and generate more sales.    ACI Limited is enjoying financial leverage but they need to have a proper management to minimize the financial risk associated with the company.    Though ACI Limited is in profitable situation but they need to concentrate to increase the Net Profit Ratio and Return on Asset Ratio, which will ultimately increase the EPS.    The performance of the securities is very smooth in the market. They should provide risk premium to compensate the risk offered by the securities. Offering risk premium in the   Bearish market may encourage more investors to invest in the securities of ACI Limited.
  • 45. Page 45 of 64 14. Conclusion ACI Limited is a well reputed corporate in Bangladesh. They are operating their business from 1992 with the stated values and have earned the respect of the stakeholders. The company is operating in a smooth way in terms of financial activities. They have sustained their business by good management of the assets and providing wealth to the stockholders. Financial analysis is necessary to know about a business and the performance of its share. All analysis reveals the financial strength of ACI Limited. ACI limited have immense opportunity to expand its business in future and contribute more in the economy of Bangladesh. 15. Reference References of Books: Jones, P. Charles, Introduction to Financial Management, Richard D. Irwin, Inc. 1992. Jones, P. Charles (2010). Investments Principles and Concepts (11th ed.). John Wiley & Sons, Inc, New Delhi Advance Chemical Industries Limited, Annual Report 2010 Advance Chemical Industries Limited, Annual Report 2011 Advance Chemical Industries Limited, Annual Report 2012 Advance Chemical Industries Limited, Annual Report 2013 Advance Chemical Industries Limited, Annual Report 2014 References of Website: Dhaka Stock Exchange, viewed from 04 August 2015- 05 August 2015, http://www.dse.com.bd/ ACI Limited, viewed from 02 July 2015- 05 July 2015, http://www.aci-bd.com Investopedia - Educating the world about finance, viewed from 07 August 2015- 15 August 2015, http://www.investopedia.com/
  • 46. Page 46 of 64 16. Appendix 1. Statement of Financial Position: 2014-2013:
  • 47. Page 47 of 64 2012-2011:
  • 48. Page 48 of 64 2010-2009:
  • 49. Page 49 of 64 2. Statement of Profit and Loss: 2014-2013:- 2012-2011:
  • 50. Page 50 of 64 2010-2009: 3. Statement of Profit or Loss and other Comprehensive Income: 2014-2013:
  • 51. Page 51 of 64 2012-2011: 2010-2009:
  • 52. Page 52 of 64 4. Consolidated Statement of Financial Position: 2014-2013:
  • 53. Page 53 of 64 2012-2011:
  • 54. Page 54 of 64 2010-2009:
  • 55. Page 55 of 64 5. Consolidated Statement of profit or Loss:- 2014-2013:-
  • 56. Page 56 of 64 2012-2011:
  • 57. Page 57 of 64 2010-2009:
  • 58. Page 58 of 64 6. Share Capital: 2014-2013: 2012-2011: 2010-2009:
  • 59. Page 59 of 64 17. Calculationof the Ratios: Liquidity ratios 1. Current Ratio = CURRENT ASSETS CURRENT LIABILITIES = 9927161551/8358791057 = 1.19 Times [2014] = 9461772496/8101494869 = 1.17 Times [2013] =8334671204/7101682744 = 1.17 Times [2012] =11096971158/5316055351 = 2.09 Times [2011] =5801121537/4087163416 = 1.42 Times [2010] 2. Quick Ratio (Acid-Test Ratio) = QUICK ASSETS CURRENT LIABILITIES = (9927161551-2961175971)/8358791057 = 0.83 Times [2014] = (9461772496-2553330342)/8101494869 = 0.85 Times [2013] = (8334671204-2128984396)/7101682744 = 0.87 Times [2012] = (6954929184-1770481777)/5316055351 = 0.98 Times [2011] = (5801121537-1716072609)/4087163416 = 1.0 Times [2010] 3. Working Capital = Current Asset – Current Liabilities = (9927161551-8358791057)/1000000 = BDT 1568.37 Mio. [2014] = (9461772496-8101494869)/1000000 = BDT 1360.28 Mio. [2013] = (8334671204-7101682744)/1000000 = BDT 1232.99 Mio. [2012] = (11096971158-5316055351)/1000000 = BDT 5780.92 Mio. [2011] = (5801121537-4087163416)/1000000 = BDT 1713.96 Mio. [2010] Activity ratios 1. Inventory Turnover Ratio = SLAES or REVENUE INVENTORY = 12318723190/2961175971 = 4.16 Times [2014] = 10683600712/2553330342 = 4.18 Times [2013] = 9680061562/2128984396 = 4.55 Times [2012] = 8513841846/1770481777 = 4.81 Times [2011] = 7915400279/1716072609 = 4.61 Times [2010]
  • 60. Page 60 of 64 2. Total Asset Turnover Ratio = SALES or REVENUE TOTAL ASSETS = 12318723190/15526192783 = 0.79 Times [2014] = 10683600712/14693912974 = 0.73 Times [2013] = 9680061562/13206467006 = 0.73 Times [2012] = 8513841846/11096971158 = 0.77 Times [2011] = 7915400279/9686269567 = 0.82 Times [2010] = 3. Days Sales Outstanding (DSO) = ACCOUNTSRECIEVABLS  No.ofDAYS TOTALSALES = (5802572938*360)/12318723190 = 169.57 Days [2014] = (5796239556*360)/10683600712 = 195.31 Days [2013] = (5433551092*360)/9680061562 = 202.07 Days [2012] = (4315151216*360)/8513841846 = 182.46 Days [2011] = (3293307705*360)/7915400279 =149.78 Days [2010] 4. Average Payment Period = (ACCOUNTSPAYABLE  NO. OF DAYS) NET PURCHASES or COGS = (1624157078*360)/7147881434 = 81.80 Days [2014] = (1833527360*360)/6426070148 = 102.72 Days [2013] = (1348153456*360)/6089878323 = 79.70 Days [2012] = (1449832593*360)/5317279883 = 98.16 Days [2011] = (947031067*360)/5094561620 = 66.92 Days [2010] Leverage ratios: 1. Debt Ratio = TOTAL DEBT 100 TOTAL ASSET = 12318723190/15526192783 = 0.79 = 79% [2014] = 9056660723/14693912974 = 0.62 = 62% [2013] = 8125180846/13206467006 = 0.62 = 62% [2012] = 6329473598/11096971158 = 0.57 = 57% [2011] = 5228091771/9686269567 = 0.54 = 54% [2010] Profitability ratios: 1. Net Profit Ratio = NET PROFIT SALES or REVENUE
  • 61. Page 61 of 64 = 950713609/12318723190 = 0.08 = 8% [2014] = 764187906/10683600712 = 0.07 = 7% [2013] = 545115873/9680061562 = 0.06 = 6% [2012] = 681129073/8513841846 = 0.08 = 8% [2011] 591590014/7915400279 = 0.07% = 7% [2010] 2. Return on Equity = NET INCOMEAVAILABLE FOR COMMON STOCKHOLDERS STOCKHOLDER'S EQUITY = 479115177/4274198745 = 0.11 = 11% [2014] =103239482/4040414787 = 0.03 = 3% [2013] = -282815672/4155380482 = -0.07 = 7% [2012] = 186069546/4688358251 = 0.04 = 4% [2011] = 140388450/4914447794 = 0.03 = 3% [2010] 3. Return on Assets (ROA) = NET INCOME TOTAL ASSET = 950713609/15526192783 = 0.06 = 6% [2014] = 764187906/14693912974 = 0.05 = 5% [2013] = 545115873/13206467006 = 0.04 = 4% [2012] = 681129073/11096971158 = 0.06 = 6% [2011] = 591590014/9686269567 = 0.06 = 6% [2010] 4. Earnings per Share (EPS) = NET INCOME TOTAL NO. OF COMMON STOCK OUTSTANDING = 950713609/34394401 = BDT 27.64 [2014] = 764187906/28582082 = BDT 26.74 [2013] = 545115873/23773833 = BDT 22.93 [2012] = 681129073/19714756 = BDT 34.55 [2011] = 591590014/19404000 = BDT 30.49 [2010]