SlideShare una empresa de Scribd logo
1 de 13
Descargar para leer sin conexión
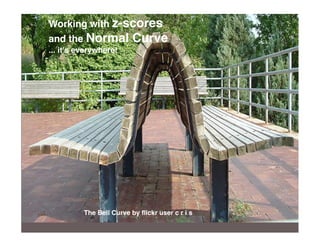
Working with z-scores
and the Normal            Curve
... it's everywhere!


          The Bell Curve by flickr user c r i s
... but first a little quiz ... ready?


                   Studying by scui3asteveo
HOMEWORK
The table shows the lengths in millimetres of 52 arrowheads.
       16 16 17 17 18 18 18 18 19 20 20                        21   21
       21 22 22 22 23 23 23 24 24 25 25                        25   26
       26 26 26 27 27 27 27 27 28 28 28                        28   29
       30 30 30 30 30 30 31 33 33 34 35                        39   40
                                    (b) Determine the lengths of arrowheads
 (a) Calculate the mean length
                                    one standard deviation below and one
 and the standard deviation.
                                    standard deviation above the mean.


                                     (d) What percent of the arrowheads
 (c) How many arrowheads
                                     are within one standard deviation
 are within one standard
                                     of the mean length?
 deviation of the mean?
North American women have a mean height of 161.5 cm and a
standard deviation of 6.3 cm.
(a) A car designer designs car seats to fit women taller than
159.0 cm. What is the z-score of a woman who is 159.0 cm tall?
                                                 z = -0.3968


(b) The manufacturer designs the seats to fit women with a maximum
z-score of 2.8. How tall is a woman with a z-score of 2.8? 179.14 = x
Curving The Marks
Professor Adams has 140 students who wrote a statistics test. If the
marks are approximately normally distributed:

  • how many students should have a 'B' mark (i.e., 70 to 79 percent)?
  • how many students should have failed (i.e., less than 50 percent)?

  • how high must she set the mark for an 'A' if she wants 5
  percent of the students to get an A?

  • how high must she set the passing mark if she wants only the
  top 75 percent of the marks to be passing marks?
Working with the Normal Distribution
Example: The graph at right
represents the marks of a large
number of students where the mean
mark is 69.3 percent and the
standard deviation is 7 percent, and
the distribution of marks is
approximately normal.


                        62.3% 69.3% 76.3%
Working with the Normal Distribution
Example: The graph at right represents
the marks of a large number of students
where the mean mark is 69.3 percent
and the standard deviation is 7 percent,
and the distribution of marks is
approximately normal.

   We know that if the marks are approximately normally distributed, then
   approximately:

    • 68 percent of the marks are between 62.3 percent and 76.3 percent (i.e., µ ± 1σ)
    • 34% of the marks are between 69.3 percent and 76.3 percent (i.e., between µ
   and µ + 1σ)
    • 50% of the marks are below 69.3 percent (i.e., less than µ)
    • 16% of the marks are above 76.3 percent (i.e., greater than µ + 1σ)
The Standard Normal Distribution
The normal distributions used up to this point have all been non-
standard normal distributions. This means that the mean and
standard deviation of the distribution are the mean and standard
deviation of the data being studied.

In a standard normal distribution, the scale on the x-axis is the z-
score (a standard score) where 'z = 0' is the mean, and the
standard deviation is '1'. The distribution is a probability
distribution where the area under the curve = 1. This means
there is a 100 percent chance of every score being included in
this distribution. Other probabilities are illustrated below.
ShadeNorm(Lo z, Hi z)
[shades area under std. normal curve]


                    σ


    ShadeNorm(Lo value, Hi value, mean, std. dev.)
    [shades area under modified normal curve]
                                        µ-5σ
                     σ


                                   µ+5σ
Case 1(a): Calculate the Percentage of Scores Between Two Given
Scores
                                         HOMEWORK
  The mean mark for a large number of students is 69.3 percent
  with a standard deviation of 7 percent. What percent of the
  students have a 'B' mark (i.e., 70 percent to 79 percent)?
  Assume that the marks are normally distributed.
HOMEWORK
Find the percent of z-scores in a standard normal distribution that are:
 (a) below z = 0.52                       (b) above z = -2.35


                                        (d) between z = 0.55 and z = 0.15
 (c) between z = -1.11 and z = 0.92
HOMEWORK
 Find the z-score if the area under a standard normal curve:

 (a) to the left of z is 0.812


(b) to the right of z is 0.305


(c)to the right of z is 0.785
HOMEWORK
Determine the values for z and x.

Más contenido relacionado

Similar a Applied 40S April 7, 2009

Applied Math 40S March 20, 2008
Applied Math 40S March 20, 2008Applied Math 40S March 20, 2008
Applied Math 40S March 20, 2008Darren Kuropatwa
 
Applied 40S April 13, 2009
Applied 40S April 13, 2009Applied 40S April 13, 2009
Applied 40S April 13, 2009Darren Kuropatwa
 
The standard normal curve & its application in biomedical sciences
The standard normal curve & its application in biomedical sciencesThe standard normal curve & its application in biomedical sciences
The standard normal curve & its application in biomedical sciencesAbhi Manu
 
Applied 40S April 21, 2009
Applied 40S April 21, 2009Applied 40S April 21, 2009
Applied 40S April 21, 2009Darren Kuropatwa
 
8. Assume the speed of vehicles along a stretch of I-10 has an app.docx
8. Assume the speed of vehicles along a stretch of I-10 has an app.docx8. Assume the speed of vehicles along a stretch of I-10 has an app.docx
8. Assume the speed of vehicles along a stretch of I-10 has an app.docxJospehStull43
 
Normal distribution slide share
Normal distribution slide shareNormal distribution slide share
Normal distribution slide shareKate FLR
 
Applied Math 40S March 19, 2008
Applied Math 40S March 19, 2008Applied Math 40S March 19, 2008
Applied Math 40S March 19, 2008Darren Kuropatwa
 
m2_2_variation_z_scores.pptx
m2_2_variation_z_scores.pptxm2_2_variation_z_scores.pptx
m2_2_variation_z_scores.pptxMesfinMelese4
 
Understanding the z score
Understanding the z scoreUnderstanding the z score
Understanding the z scoreChit Laplana
 
02 PSBE3_PPT.Ch01_2_Examining Distribution.ppt
02 PSBE3_PPT.Ch01_2_Examining Distribution.ppt02 PSBE3_PPT.Ch01_2_Examining Distribution.ppt
02 PSBE3_PPT.Ch01_2_Examining Distribution.pptBishoyRomani
 
Year 12 Maths A Textbook - Chapter 10
Year 12 Maths A Textbook - Chapter 10Year 12 Maths A Textbook - Chapter 10
Year 12 Maths A Textbook - Chapter 10westy67968
 
Jujie and saima introduction of statistical concept
Jujie and saima introduction of statistical conceptJujie and saima introduction of statistical concept
Jujie and saima introduction of statistical conceptJUJIE ATILANO
 
Converting normal to standard normal distribution and vice versa ppt
Converting normal to standard normal distribution and vice versa pptConverting normal to standard normal distribution and vice versa ppt
Converting normal to standard normal distribution and vice versa pptAilz Lositaño
 
Normal Probability Distribution
Normal Probability DistributionNormal Probability Distribution
Normal Probability Distributionmandalina landy
 
Applied 40S March 25, 2009
Applied 40S March 25, 2009Applied 40S March 25, 2009
Applied 40S March 25, 2009Darren Kuropatwa
 
THE NORMALDISTRIBUTION IN STATISTICS AND PROBABILITY SUBJECTpptx
THE NORMALDISTRIBUTION IN STATISTICS AND PROBABILITY SUBJECTpptxTHE NORMALDISTRIBUTION IN STATISTICS AND PROBABILITY SUBJECTpptx
THE NORMALDISTRIBUTION IN STATISTICS AND PROBABILITY SUBJECTpptxjazellemaeypil
 

Similar a Applied 40S April 7, 2009 (20)

Applied Math 40S March 20, 2008
Applied Math 40S March 20, 2008Applied Math 40S March 20, 2008
Applied Math 40S March 20, 2008
 
Applied 40S April 8, 2009
Applied 40S April 8, 2009Applied 40S April 8, 2009
Applied 40S April 8, 2009
 
Applied 40S April 13, 2009
Applied 40S April 13, 2009Applied 40S April 13, 2009
Applied 40S April 13, 2009
 
The standard normal curve & its application in biomedical sciences
The standard normal curve & its application in biomedical sciencesThe standard normal curve & its application in biomedical sciences
The standard normal curve & its application in biomedical sciences
 
Applied 40S April 21, 2009
Applied 40S April 21, 2009Applied 40S April 21, 2009
Applied 40S April 21, 2009
 
8. Assume the speed of vehicles along a stretch of I-10 has an app.docx
8. Assume the speed of vehicles along a stretch of I-10 has an app.docx8. Assume the speed of vehicles along a stretch of I-10 has an app.docx
8. Assume the speed of vehicles along a stretch of I-10 has an app.docx
 
Ch05
Ch05Ch05
Ch05
 
Normal distribution slide share
Normal distribution slide shareNormal distribution slide share
Normal distribution slide share
 
Applied Math 40S March 19, 2008
Applied Math 40S March 19, 2008Applied Math 40S March 19, 2008
Applied Math 40S March 19, 2008
 
Lecture 10.4 bt
Lecture 10.4 btLecture 10.4 bt
Lecture 10.4 bt
 
m2_2_variation_z_scores.pptx
m2_2_variation_z_scores.pptxm2_2_variation_z_scores.pptx
m2_2_variation_z_scores.pptx
 
Understanding the z score
Understanding the z scoreUnderstanding the z score
Understanding the z score
 
02 PSBE3_PPT.Ch01_2_Examining Distribution.ppt
02 PSBE3_PPT.Ch01_2_Examining Distribution.ppt02 PSBE3_PPT.Ch01_2_Examining Distribution.ppt
02 PSBE3_PPT.Ch01_2_Examining Distribution.ppt
 
Year 12 Maths A Textbook - Chapter 10
Year 12 Maths A Textbook - Chapter 10Year 12 Maths A Textbook - Chapter 10
Year 12 Maths A Textbook - Chapter 10
 
Jujie and saima introduction of statistical concept
Jujie and saima introduction of statistical conceptJujie and saima introduction of statistical concept
Jujie and saima introduction of statistical concept
 
Chapters 2 4
Chapters 2  4Chapters 2  4
Chapters 2 4
 
Converting normal to standard normal distribution and vice versa ppt
Converting normal to standard normal distribution and vice versa pptConverting normal to standard normal distribution and vice versa ppt
Converting normal to standard normal distribution and vice versa ppt
 
Normal Probability Distribution
Normal Probability DistributionNormal Probability Distribution
Normal Probability Distribution
 
Applied 40S March 25, 2009
Applied 40S March 25, 2009Applied 40S March 25, 2009
Applied 40S March 25, 2009
 
THE NORMALDISTRIBUTION IN STATISTICS AND PROBABILITY SUBJECTpptx
THE NORMALDISTRIBUTION IN STATISTICS AND PROBABILITY SUBJECTpptxTHE NORMALDISTRIBUTION IN STATISTICS AND PROBABILITY SUBJECTpptx
THE NORMALDISTRIBUTION IN STATISTICS AND PROBABILITY SUBJECTpptx
 

Más de Darren Kuropatwa

Providing Permission To Wonder v2.1
Providing Permission To Wonder v2.1Providing Permission To Wonder v2.1
Providing Permission To Wonder v2.1Darren Kuropatwa
 
Things That Suck About Digital Citizenship v1
Things That Suck About Digital Citizenship v1Things That Suck About Digital Citizenship v1
Things That Suck About Digital Citizenship v1Darren Kuropatwa
 
Digital Storytelling for Deeper Learning v1
Digital Storytelling for Deeper Learning v1Digital Storytelling for Deeper Learning v1
Digital Storytelling for Deeper Learning v1Darren Kuropatwa
 
Tales of Learning and the Gifts of Footprints v4.2
Tales of Learning and the Gifts of Footprints v4.2Tales of Learning and the Gifts of Footprints v4.2
Tales of Learning and the Gifts of Footprints v4.2Darren Kuropatwa
 
Making Student Thinking Visible v4
 Making Student Thinking Visible v4 Making Student Thinking Visible v4
Making Student Thinking Visible v4Darren Kuropatwa
 
Leveraging Digital for Deeper Learning
Leveraging Digital for Deeper LearningLeveraging Digital for Deeper Learning
Leveraging Digital for Deeper LearningDarren Kuropatwa
 
We Learn Through Stories at PRIZMAH17
We Learn Through Stories at PRIZMAH17We Learn Through Stories at PRIZMAH17
We Learn Through Stories at PRIZMAH17Darren Kuropatwa
 
Providing Permission to Wonder v3
Providing Permission to Wonder v3Providing Permission to Wonder v3
Providing Permission to Wonder v3Darren Kuropatwa
 
Making Student Thinking Visible v3.7
 Making Student Thinking Visible v3.7 Making Student Thinking Visible v3.7
Making Student Thinking Visible v3.7Darren Kuropatwa
 
Providing Permission to Wonder v2
Providing Permission to Wonder v2Providing Permission to Wonder v2
Providing Permission to Wonder v2Darren Kuropatwa
 
We Learn Through Stories v4 (master class)
We Learn Through Stories v4 (master class)We Learn Through Stories v4 (master class)
We Learn Through Stories v4 (master class)Darren Kuropatwa
 
Deep Learning Design: the middle ring
Deep Learning Design: the middle ringDeep Learning Design: the middle ring
Deep Learning Design: the middle ringDarren Kuropatwa
 

Más de Darren Kuropatwa (20)

Behind Their Eyes v1
Behind Their Eyes v1Behind Their Eyes v1
Behind Their Eyes v1
 
Leading Change v1
Leading Change v1Leading Change v1
Leading Change v1
 
Providing Permission To Wonder v2.1
Providing Permission To Wonder v2.1Providing Permission To Wonder v2.1
Providing Permission To Wonder v2.1
 
Things That Suck About Digital Citizenship v1
Things That Suck About Digital Citizenship v1Things That Suck About Digital Citizenship v1
Things That Suck About Digital Citizenship v1
 
Digital Storytelling for Deeper Learning v1
Digital Storytelling for Deeper Learning v1Digital Storytelling for Deeper Learning v1
Digital Storytelling for Deeper Learning v1
 
Tales of Learning and the Gifts of Footprints v4.2
Tales of Learning and the Gifts of Footprints v4.2Tales of Learning and the Gifts of Footprints v4.2
Tales of Learning and the Gifts of Footprints v4.2
 
The Fourth Screen v4.2
The Fourth Screen v4.2The Fourth Screen v4.2
The Fourth Screen v4.2
 
Making Student Thinking Visible v4
 Making Student Thinking Visible v4 Making Student Thinking Visible v4
Making Student Thinking Visible v4
 
Learning is at BYTE 2017
Learning is at BYTE 2017Learning is at BYTE 2017
Learning is at BYTE 2017
 
Leveraging Digital for Deeper Learning
Leveraging Digital for Deeper LearningLeveraging Digital for Deeper Learning
Leveraging Digital for Deeper Learning
 
We Learn Through Stories at PRIZMAH17
We Learn Through Stories at PRIZMAH17We Learn Through Stories at PRIZMAH17
We Learn Through Stories at PRIZMAH17
 
Providing Permission to Wonder v3
Providing Permission to Wonder v3Providing Permission to Wonder v3
Providing Permission to Wonder v3
 
The Fourth Screen v4.1
The Fourth Screen v4.1The Fourth Screen v4.1
The Fourth Screen v4.1
 
Making Student Thinking Visible v3.7
 Making Student Thinking Visible v3.7 Making Student Thinking Visible v3.7
Making Student Thinking Visible v3.7
 
Learning is at AUHSD
Learning is at AUHSDLearning is at AUHSD
Learning is at AUHSD
 
Providing Permission to Wonder v2
Providing Permission to Wonder v2Providing Permission to Wonder v2
Providing Permission to Wonder v2
 
The Fourth Screen v4
The Fourth Screen v4The Fourth Screen v4
The Fourth Screen v4
 
Learning is at BLC16
Learning is at BLC16Learning is at BLC16
Learning is at BLC16
 
We Learn Through Stories v4 (master class)
We Learn Through Stories v4 (master class)We Learn Through Stories v4 (master class)
We Learn Through Stories v4 (master class)
 
Deep Learning Design: the middle ring
Deep Learning Design: the middle ringDeep Learning Design: the middle ring
Deep Learning Design: the middle ring
 

Último

GRADE 4 - SUMMATIVE TEST QUARTER 4 ALL SUBJECTS
GRADE 4 - SUMMATIVE TEST QUARTER 4 ALL SUBJECTSGRADE 4 - SUMMATIVE TEST QUARTER 4 ALL SUBJECTS
GRADE 4 - SUMMATIVE TEST QUARTER 4 ALL SUBJECTSJoshuaGantuangco2
 
Influencing policy (training slides from Fast Track Impact)
Influencing policy (training slides from Fast Track Impact)Influencing policy (training slides from Fast Track Impact)
Influencing policy (training slides from Fast Track Impact)Mark Reed
 
What is Model Inheritance in Odoo 17 ERP
What is Model Inheritance in Odoo 17 ERPWhat is Model Inheritance in Odoo 17 ERP
What is Model Inheritance in Odoo 17 ERPCeline George
 
4.18.24 Movement Legacies, Reflection, and Review.pptx
4.18.24 Movement Legacies, Reflection, and Review.pptx4.18.24 Movement Legacies, Reflection, and Review.pptx
4.18.24 Movement Legacies, Reflection, and Review.pptxmary850239
 
Field Attribute Index Feature in Odoo 17
Field Attribute Index Feature in Odoo 17Field Attribute Index Feature in Odoo 17
Field Attribute Index Feature in Odoo 17Celine George
 
Like-prefer-love -hate+verb+ing & silent letters & citizenship text.pdf
Like-prefer-love -hate+verb+ing & silent letters & citizenship text.pdfLike-prefer-love -hate+verb+ing & silent letters & citizenship text.pdf
Like-prefer-love -hate+verb+ing & silent letters & citizenship text.pdfMr Bounab Samir
 
HỌC TỐT TIẾNG ANH 11 THEO CHƯƠNG TRÌNH GLOBAL SUCCESS ĐÁP ÁN CHI TIẾT - CẢ NĂ...
HỌC TỐT TIẾNG ANH 11 THEO CHƯƠNG TRÌNH GLOBAL SUCCESS ĐÁP ÁN CHI TIẾT - CẢ NĂ...HỌC TỐT TIẾNG ANH 11 THEO CHƯƠNG TRÌNH GLOBAL SUCCESS ĐÁP ÁN CHI TIẾT - CẢ NĂ...
HỌC TỐT TIẾNG ANH 11 THEO CHƯƠNG TRÌNH GLOBAL SUCCESS ĐÁP ÁN CHI TIẾT - CẢ NĂ...Nguyen Thanh Tu Collection
 
ACC 2024 Chronicles. Cardiology. Exam.pdf
ACC 2024 Chronicles. Cardiology. Exam.pdfACC 2024 Chronicles. Cardiology. Exam.pdf
ACC 2024 Chronicles. Cardiology. Exam.pdfSpandanaRallapalli
 
Global Lehigh Strategic Initiatives (without descriptions)
Global Lehigh Strategic Initiatives (without descriptions)Global Lehigh Strategic Initiatives (without descriptions)
Global Lehigh Strategic Initiatives (without descriptions)cama23
 
How to Add Barcode on PDF Report in Odoo 17
How to Add Barcode on PDF Report in Odoo 17How to Add Barcode on PDF Report in Odoo 17
How to Add Barcode on PDF Report in Odoo 17Celine George
 
ECONOMIC CONTEXT - PAPER 1 Q3: NEWSPAPERS.pptx
ECONOMIC CONTEXT - PAPER 1 Q3: NEWSPAPERS.pptxECONOMIC CONTEXT - PAPER 1 Q3: NEWSPAPERS.pptx
ECONOMIC CONTEXT - PAPER 1 Q3: NEWSPAPERS.pptxiammrhaywood
 
ISYU TUNGKOL SA SEKSWLADIDA (ISSUE ABOUT SEXUALITY
ISYU TUNGKOL SA SEKSWLADIDA (ISSUE ABOUT SEXUALITYISYU TUNGKOL SA SEKSWLADIDA (ISSUE ABOUT SEXUALITY
ISYU TUNGKOL SA SEKSWLADIDA (ISSUE ABOUT SEXUALITYKayeClaireEstoconing
 
Grade 9 Quarter 4 Dll Grade 9 Quarter 4 DLL.pdf
Grade 9 Quarter 4 Dll Grade 9 Quarter 4 DLL.pdfGrade 9 Quarter 4 Dll Grade 9 Quarter 4 DLL.pdf
Grade 9 Quarter 4 Dll Grade 9 Quarter 4 DLL.pdfJemuel Francisco
 
Procuring digital preservation CAN be quick and painless with our new dynamic...
Procuring digital preservation CAN be quick and painless with our new dynamic...Procuring digital preservation CAN be quick and painless with our new dynamic...
Procuring digital preservation CAN be quick and painless with our new dynamic...Jisc
 
ANG SEKTOR NG agrikultura.pptx QUARTER 4
ANG SEKTOR NG agrikultura.pptx QUARTER 4ANG SEKTOR NG agrikultura.pptx QUARTER 4
ANG SEKTOR NG agrikultura.pptx QUARTER 4MiaBumagat1
 
FILIPINO PSYCHology sikolohiyang pilipino
FILIPINO PSYCHology sikolohiyang pilipinoFILIPINO PSYCHology sikolohiyang pilipino
FILIPINO PSYCHology sikolohiyang pilipinojohnmickonozaleda
 
4.16.24 21st Century Movements for Black Lives.pptx
4.16.24 21st Century Movements for Black Lives.pptx4.16.24 21st Century Movements for Black Lives.pptx
4.16.24 21st Century Movements for Black Lives.pptxmary850239
 
How to do quick user assign in kanban in Odoo 17 ERP
How to do quick user assign in kanban in Odoo 17 ERPHow to do quick user assign in kanban in Odoo 17 ERP
How to do quick user assign in kanban in Odoo 17 ERPCeline George
 
THEORIES OF ORGANIZATION-PUBLIC ADMINISTRATION
THEORIES OF ORGANIZATION-PUBLIC ADMINISTRATIONTHEORIES OF ORGANIZATION-PUBLIC ADMINISTRATION
THEORIES OF ORGANIZATION-PUBLIC ADMINISTRATIONHumphrey A Beña
 

Último (20)

GRADE 4 - SUMMATIVE TEST QUARTER 4 ALL SUBJECTS
GRADE 4 - SUMMATIVE TEST QUARTER 4 ALL SUBJECTSGRADE 4 - SUMMATIVE TEST QUARTER 4 ALL SUBJECTS
GRADE 4 - SUMMATIVE TEST QUARTER 4 ALL SUBJECTS
 
Influencing policy (training slides from Fast Track Impact)
Influencing policy (training slides from Fast Track Impact)Influencing policy (training slides from Fast Track Impact)
Influencing policy (training slides from Fast Track Impact)
 
What is Model Inheritance in Odoo 17 ERP
What is Model Inheritance in Odoo 17 ERPWhat is Model Inheritance in Odoo 17 ERP
What is Model Inheritance in Odoo 17 ERP
 
4.18.24 Movement Legacies, Reflection, and Review.pptx
4.18.24 Movement Legacies, Reflection, and Review.pptx4.18.24 Movement Legacies, Reflection, and Review.pptx
4.18.24 Movement Legacies, Reflection, and Review.pptx
 
Field Attribute Index Feature in Odoo 17
Field Attribute Index Feature in Odoo 17Field Attribute Index Feature in Odoo 17
Field Attribute Index Feature in Odoo 17
 
Like-prefer-love -hate+verb+ing & silent letters & citizenship text.pdf
Like-prefer-love -hate+verb+ing & silent letters & citizenship text.pdfLike-prefer-love -hate+verb+ing & silent letters & citizenship text.pdf
Like-prefer-love -hate+verb+ing & silent letters & citizenship text.pdf
 
HỌC TỐT TIẾNG ANH 11 THEO CHƯƠNG TRÌNH GLOBAL SUCCESS ĐÁP ÁN CHI TIẾT - CẢ NĂ...
HỌC TỐT TIẾNG ANH 11 THEO CHƯƠNG TRÌNH GLOBAL SUCCESS ĐÁP ÁN CHI TIẾT - CẢ NĂ...HỌC TỐT TIẾNG ANH 11 THEO CHƯƠNG TRÌNH GLOBAL SUCCESS ĐÁP ÁN CHI TIẾT - CẢ NĂ...
HỌC TỐT TIẾNG ANH 11 THEO CHƯƠNG TRÌNH GLOBAL SUCCESS ĐÁP ÁN CHI TIẾT - CẢ NĂ...
 
ACC 2024 Chronicles. Cardiology. Exam.pdf
ACC 2024 Chronicles. Cardiology. Exam.pdfACC 2024 Chronicles. Cardiology. Exam.pdf
ACC 2024 Chronicles. Cardiology. Exam.pdf
 
Global Lehigh Strategic Initiatives (without descriptions)
Global Lehigh Strategic Initiatives (without descriptions)Global Lehigh Strategic Initiatives (without descriptions)
Global Lehigh Strategic Initiatives (without descriptions)
 
How to Add Barcode on PDF Report in Odoo 17
How to Add Barcode on PDF Report in Odoo 17How to Add Barcode on PDF Report in Odoo 17
How to Add Barcode on PDF Report in Odoo 17
 
ECONOMIC CONTEXT - PAPER 1 Q3: NEWSPAPERS.pptx
ECONOMIC CONTEXT - PAPER 1 Q3: NEWSPAPERS.pptxECONOMIC CONTEXT - PAPER 1 Q3: NEWSPAPERS.pptx
ECONOMIC CONTEXT - PAPER 1 Q3: NEWSPAPERS.pptx
 
ISYU TUNGKOL SA SEKSWLADIDA (ISSUE ABOUT SEXUALITY
ISYU TUNGKOL SA SEKSWLADIDA (ISSUE ABOUT SEXUALITYISYU TUNGKOL SA SEKSWLADIDA (ISSUE ABOUT SEXUALITY
ISYU TUNGKOL SA SEKSWLADIDA (ISSUE ABOUT SEXUALITY
 
Grade 9 Quarter 4 Dll Grade 9 Quarter 4 DLL.pdf
Grade 9 Quarter 4 Dll Grade 9 Quarter 4 DLL.pdfGrade 9 Quarter 4 Dll Grade 9 Quarter 4 DLL.pdf
Grade 9 Quarter 4 Dll Grade 9 Quarter 4 DLL.pdf
 
Procuring digital preservation CAN be quick and painless with our new dynamic...
Procuring digital preservation CAN be quick and painless with our new dynamic...Procuring digital preservation CAN be quick and painless with our new dynamic...
Procuring digital preservation CAN be quick and painless with our new dynamic...
 
ANG SEKTOR NG agrikultura.pptx QUARTER 4
ANG SEKTOR NG agrikultura.pptx QUARTER 4ANG SEKTOR NG agrikultura.pptx QUARTER 4
ANG SEKTOR NG agrikultura.pptx QUARTER 4
 
YOUVE GOT EMAIL_FINALS_EL_DORADO_2024.pptx
YOUVE GOT EMAIL_FINALS_EL_DORADO_2024.pptxYOUVE GOT EMAIL_FINALS_EL_DORADO_2024.pptx
YOUVE GOT EMAIL_FINALS_EL_DORADO_2024.pptx
 
FILIPINO PSYCHology sikolohiyang pilipino
FILIPINO PSYCHology sikolohiyang pilipinoFILIPINO PSYCHology sikolohiyang pilipino
FILIPINO PSYCHology sikolohiyang pilipino
 
4.16.24 21st Century Movements for Black Lives.pptx
4.16.24 21st Century Movements for Black Lives.pptx4.16.24 21st Century Movements for Black Lives.pptx
4.16.24 21st Century Movements for Black Lives.pptx
 
How to do quick user assign in kanban in Odoo 17 ERP
How to do quick user assign in kanban in Odoo 17 ERPHow to do quick user assign in kanban in Odoo 17 ERP
How to do quick user assign in kanban in Odoo 17 ERP
 
THEORIES OF ORGANIZATION-PUBLIC ADMINISTRATION
THEORIES OF ORGANIZATION-PUBLIC ADMINISTRATIONTHEORIES OF ORGANIZATION-PUBLIC ADMINISTRATION
THEORIES OF ORGANIZATION-PUBLIC ADMINISTRATION
 

Applied 40S April 7, 2009

  • 1. Working with z-scores and the Normal Curve ... it's everywhere! The Bell Curve by flickr user c r i s
  • 2. ... but first a little quiz ... ready? Studying by scui3asteveo
  • 3. HOMEWORK The table shows the lengths in millimetres of 52 arrowheads. 16 16 17 17 18 18 18 18 19 20 20 21 21 21 22 22 22 23 23 23 24 24 25 25 25 26 26 26 26 27 27 27 27 27 28 28 28 28 29 30 30 30 30 30 30 31 33 33 34 35 39 40 (b) Determine the lengths of arrowheads (a) Calculate the mean length one standard deviation below and one and the standard deviation. standard deviation above the mean. (d) What percent of the arrowheads (c) How many arrowheads are within one standard deviation are within one standard of the mean length? deviation of the mean?
  • 4. North American women have a mean height of 161.5 cm and a standard deviation of 6.3 cm. (a) A car designer designs car seats to fit women taller than 159.0 cm. What is the z-score of a woman who is 159.0 cm tall? z = -0.3968 (b) The manufacturer designs the seats to fit women with a maximum z-score of 2.8. How tall is a woman with a z-score of 2.8? 179.14 = x
  • 5. Curving The Marks Professor Adams has 140 students who wrote a statistics test. If the marks are approximately normally distributed: • how many students should have a 'B' mark (i.e., 70 to 79 percent)? • how many students should have failed (i.e., less than 50 percent)? • how high must she set the mark for an 'A' if she wants 5 percent of the students to get an A? • how high must she set the passing mark if she wants only the top 75 percent of the marks to be passing marks?
  • 6. Working with the Normal Distribution Example: The graph at right represents the marks of a large number of students where the mean mark is 69.3 percent and the standard deviation is 7 percent, and the distribution of marks is approximately normal. 62.3% 69.3% 76.3%
  • 7. Working with the Normal Distribution Example: The graph at right represents the marks of a large number of students where the mean mark is 69.3 percent and the standard deviation is 7 percent, and the distribution of marks is approximately normal. We know that if the marks are approximately normally distributed, then approximately: • 68 percent of the marks are between 62.3 percent and 76.3 percent (i.e., µ ± 1σ) • 34% of the marks are between 69.3 percent and 76.3 percent (i.e., between µ and µ + 1σ) • 50% of the marks are below 69.3 percent (i.e., less than µ) • 16% of the marks are above 76.3 percent (i.e., greater than µ + 1σ)
  • 8. The Standard Normal Distribution The normal distributions used up to this point have all been non- standard normal distributions. This means that the mean and standard deviation of the distribution are the mean and standard deviation of the data being studied. In a standard normal distribution, the scale on the x-axis is the z- score (a standard score) where 'z = 0' is the mean, and the standard deviation is '1'. The distribution is a probability distribution where the area under the curve = 1. This means there is a 100 percent chance of every score being included in this distribution. Other probabilities are illustrated below.
  • 9. ShadeNorm(Lo z, Hi z) [shades area under std. normal curve] σ ShadeNorm(Lo value, Hi value, mean, std. dev.) [shades area under modified normal curve] µ-5σ σ µ+5σ
  • 10. Case 1(a): Calculate the Percentage of Scores Between Two Given Scores HOMEWORK The mean mark for a large number of students is 69.3 percent with a standard deviation of 7 percent. What percent of the students have a 'B' mark (i.e., 70 percent to 79 percent)? Assume that the marks are normally distributed.
  • 11. HOMEWORK Find the percent of z-scores in a standard normal distribution that are: (a) below z = 0.52 (b) above z = -2.35 (d) between z = 0.55 and z = 0.15 (c) between z = -1.11 and z = 0.92
  • 12. HOMEWORK Find the z-score if the area under a standard normal curve: (a) to the left of z is 0.812 (b) to the right of z is 0.305 (c)to the right of z is 0.785