Recomendados

Recomendados
Más contenido relacionado
Último
Último (20)
Destacado
Destacado (20)
On the Robustness and Discriminative Power of IR Metrics for Top-N Recommendation [RecSys '18 Poster]
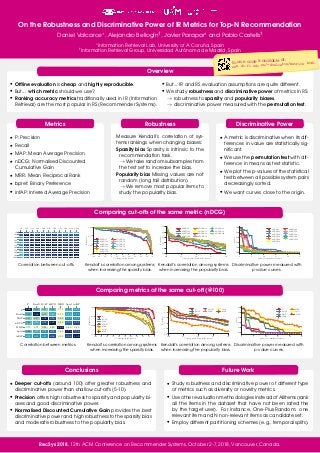
- 1. On the Robustness and Discriminative Power of IR Metrics for Top-N Recommendation Daniel Valcarce∗, Alejandro Bellogín†, Javier Parapar∗ and Pablo Castells† ∗ Information Retrieval Lab, University of A Coruña, Spain † Information Retrieval Group, Universidad Autónoma de Madrid, Spain On the Robustness and Discriminative Power of IR Metrics for Top-N Recommendation Daniel Valcarce∗, Alejandro Bellogín†, Javier Parapar∗ and Pablo Castells† ∗ Information Retrieval Lab, University of A Coruña, Spain † Information Retrieval Group, Universidad Autónoma de Madrid, Spain Overview • Offline evaluation is cheap and highly reproducible. • But... which metric should we use? • Ranking accuracy metrics traditionally used in IR (Information Retrieval) are the most popular in RS (Recommender Systems). • But... IR and RS evaluation assumptions are quite different. • We study robustness and discriminative power of metrics in RS: → robustness to sparsity and popularity biases, → discriminative power measured with the permutation test. Metrics • P: Precision • Recall • MAP: Mean Average Precision • nDCG: Normalised Discounted Cumulative Gain • MRR: Mean Reciprocal Rank • bpref: Binary Preference • infAP: Inferred Average Precision Robustness Measure Kendall’s correlation of sys- tems rankings when changing biases: Sparsity bias Sparsity is intrinsic to the recommendation task. → We take random subsamples from the test set to increase the bias. Popularity bias Missing values are not random (long tail distribution). → We remove most popular items to study the popularity bias. Discriminative Power • A metric is discriminative when its dif- ferences in value are statistically sig- nificant. • We use the permutation test with dif- ference in means as test statistic. • We plot the p-values of the statistical test between all possible system pairs decreasingly sorted. • We want curves close to the origin. Comparing cut-offs of the same metric (nDCG) @5 @10 @20 @30 @40 @50 @60 @70 @80 @90 @100 @5 @10 @20 @30 @40 @50 @60 @70 @80 @90 @100 1.00 0.95 0.93 0.92 0.92 0.92 0.92 0.91 0.90 0.90 0.90 0.95 1.00 0.98 0.97 0.97 0.97 0.97 0.96 0.95 0.95 0.95 0.93 0.98 1.00 0.99 0.99 0.99 0.99 0.98 0.97 0.97 0.97 0.92 0.97 0.99 1.00 1.00 1.00 1.00 0.99 0.98 0.98 0.98 0.92 0.97 0.99 1.00 1.00 1.00 1.00 0.99 0.98 0.98 0.98 0.92 0.97 0.99 1.00 1.00 1.00 1.00 0.99 0.98 0.98 0.98 0.92 0.97 0.99 1.00 1.00 1.00 1.00 0.99 0.98 0.98 0.98 0.91 0.96 0.98 0.99 0.99 0.99 0.99 1.00 0.99 0.99 0.99 0.90 0.95 0.97 0.98 0.98 0.98 0.98 0.99 1.00 1.00 1.00 0.90 0.95 0.97 0.98 0.98 0.98 0.98 0.99 1.00 1.00 1.00 0.90 0.95 0.97 0.98 0.98 0.98 0.98 0.99 1.00 1.00 1.00 Correlation between cut-offs. 100 90 80 70 60 50 40 30 20 10 0 % of ratings in the test set 0.85 0.90 0.95 1.00 Kendall’sτ nDCG@5 nDCG@10 nDCG@20 nDCG@30 nDCG@40 nDCG@50 nDCG@60 nDCG@70 nDCG@80 nDCG@90 nDCG@100 Kendall’s correlation among systems when increasing the sparsity bias. 100 95 90 85 80 % least popular items in the test set 0.0 0.2 0.4 0.6 0.8 1.0 Kendall’sτ nDCG@5 nDCG@10 nDCG@20 nDCG@30 nDCG@40 nDCG@50 nDCG@60 nDCG@70 nDCG@80 nDCG@90 nDCG@100 Kendall’s correlation among systems when increasing the popularity bias. 0 5 10 15 20 25 pairs of recommender systems 0.0 0.2 0.4 0.6 0.8 1.0 p-value nDCG@5 nDCG@10 nDCG@20 nDCG@30 nDCG@40 nDCG@50 nDCG@60 nDCG@70 nDCG@80 nDCG@90 nDCG@100 Discriminative power measured with p-value curves. Comparing metrics at the same cut-off (@100) P Recall MAP nDCG MRR bpref infAP P Recall MAP nDCG MRR bpref infAP 1.00 0.89 0.87 0.89 0.71 0.89 0.91 0.89 1.00 0.87 0.90 0.72 0.90 0.92 0.87 0.87 1.00 0.96 0.84 0.92 0.92 0.89 0.90 0.96 1.00 0.82 0.94 0.96 0.71 0.72 0.84 0.82 1.00 0.80 0.80 0.89 0.90 0.92 0.94 0.80 1.00 0.96 0.91 0.92 0.92 0.96 0.80 0.96 1.00 Correlation between metrics. 100 90 80 70 60 50 40 30 20 10 0 % of ratings in the test set 0.85 0.90 0.95 1.00 Kendall’sτ P Recall MAP nDCG MRR bpref infAP Kendall’s correlation among systems when increasing the sparsity bias. 100 95 90 85 80 % least popular items in the test set 0.0 0.2 0.4 0.6 0.8 1.0 Kendall’sτ P Recall MAP nDCG MRR bpref infAP Kendall’s correlation among systems when increasing the popularity bias. 0 5 10 15 20 25 pairs of recommender systems 0.0 0.2 0.4 0.6 0.8 1.0 p-value P Recall MAP nDCG MRR bpref infAP Discriminative power measured with p-value curves. Conclusions • Deeper cut-offs (around 100) offer greater robustness and discriminative power than shallow cut-offs (5-10). • Precision offers high robustness to sparsity and popularity bi- ases and good discriminative power. • Normalised Discounted Cumulative Gain provides the best discriminative power and high robustness to the sparsity bias and moderate robustness to the popularity bias. Future Work • Study robustness and discriminative power of different type of metrics such as diversity or novelty metrics. • Use other evaluation methodologies instead of AllItems (rank all the items in the dataset that have not been rated the by the target user). For instance, One-Plus-Random: one relevant item and N non-relevant items as candidate set. • Employ different partitioning schemes (e.g., temporal splits). RecSys 2018, 12th ACM Conference on Recommender Systems, October 2-7, 2018, Vancouver, Canada. Source code is available at: www.dc.fi.udc.es/~dvalcarce/metrics.html