
Recomendados
Recomendados
Más contenido relacionado
La actualidad más candente
La actualidad más candente (18)
Destacado
Destacado (20)
Similar a Q1 2009 Earning Report of Cathay General Bancorp
Similar a Q1 2009 Earning Report of Cathay General Bancorp (20)
Más de earningreport earningreport
Más de earningreport earningreport (20)
Último
Último (20)
Q1 2009 Earning Report of Cathay General Bancorp
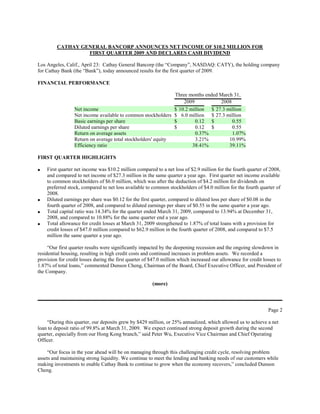
- 1. CATHAY GENERAL BANCORP ANNOUNCES NET INCOME OF $10.2 MILLION FOR FIRST QUARTER 2009 AND DECLARES CASH DIVIDEND Los Angeles, Calif., April 23: Cathay General Bancorp (the “Company”, NASDAQ: CATY), the holding company for Cathay Bank (the “Bank”), today announced results for the first quarter of 2009. FINANCIAL PERFORMANCE Three months ended March 31, 2009 2008 Net income $ 10.2 million $ 27.3 million Net income available to common stockholders $ 6.0 million $ 27.3 million Basic earnings per share $ 0.12 $ 0.55 Diluted earnings per share $ 0.12 $ 0.55 Return on average assets 0.37% 1.07% Return on average total stockholders' equity 3.21% 10.99% Efficiency ratio 38.41% 39.11% FIRST QUARTER HIGHLIGHTS First quarter net income was $10.2 million compared to a net loss of $2.9 million for the fourth quarter of 2008, and compared to net income of $27.3 million in the same quarter a year ago. First quarter net income available to common stockholders of $6.0 million, which was after the deduction of $4.2 million for dividends on preferred stock, compared to net loss available to common stockholders of $4.0 million for the fourth quarter of 2008. Diluted earnings per share was $0.12 for the first quarter, compared to diluted loss per share of $0.08 in the fourth quarter of 2008, and compared to diluted earnings per share of $0.55 in the same quarter a year ago. Total capital ratio was 14.34% for the quarter ended March 31, 2009, compared to 13.94% at December 31, 2008, and compared to 10.88% for the same quarter end a year ago. Total allowance for credit losses at March 31, 2009 strengthened to 1.87% of total loans with a provision for credit losses of $47.0 million compared to $62.9 million in the fourth quarter of 2008, and compared to $7.5 million the same quarter a year ago. “Our first quarter results were significantly impacted by the deepening recession and the ongoing slowdown in residential housing, resulting in high credit costs and continued increases in problem assets. We recorded a provision for credit losses during the first quarter of $47.0 million which increased our allowance for credit losses to 1.87% of total loans,” commented Dunson Cheng, Chairman of the Board, Chief Executive Officer, and President of the Company. (more) Page 2 “During this quarter, our deposits grew by $429 million, or 25% annualized, which allowed us to achieve a net loan to deposit ratio of 99.8% at March 31, 2009. We expect continued strong deposit growth during the second quarter, especially from our Hong Kong branch,” said Peter Wu, Executive Vice Chairman and Chief Operating Officer. “Our focus in the year ahead will be on managing through this challenging credit cycle, resolving problem assets and maintaining strong liquidity. We continue to meet the lending and banking needs of our customers while making investments to enable Cathay Bank to continue to grow when the economy recovers,” concluded Dunson Cheng.
- 2. INCOME STATEMENT REVIEW Net interest income before provision for credit losses Net interest income before provision for credit losses decreased to $70.4 million during the first quarter of 2009, a decline of $4.8 million, or 6.3%, compared to the $75.2 million during the same quarter a year ago. The decrease was due primarily to the larger decline in earning asset yields compared to rates paid for deposits and borrowings. The net interest margin, on a fully taxable-equivalent basis, was 2.69% for the first quarter of 2009. The net interest margin decreased 16 basis points from 2.85% in the fourth quarter of 2008 and decreased 47 basis points from 3.16% in the first quarter of 2008. The decrease in net interest income from the prior year primarily resulted from the increase in the borrowing rate on our long term repurchase agreements and smaller decreases in rates paid on core deposits and other borrowed funds compared to the decreases in the prime rate. The majority of our variable rate loans contain interest rate floors, which help limit the impact of the recent decreases of the prime interest rate. For the first quarter of 2009, the yield on average interest-earning assets was 5.26% on a fully taxable-equivalent basis, and the cost of funds on average interest-bearing liabilities equaled 2.98%. In comparison, for the first quarter of 2008, the yield on average interest-earning assets was 6.46% and cost of funds on average interest-bearing liabilities equaled 3.80%. The interest spread, defined as the difference between the yield on average interest- earning assets and the cost of funds on average interest-bearing liabilities, decreased 38 basis points to 2.28% for the first quarter ended March 31, 2009, from 2.66% for the same quarter a year ago, primarily due to the reasons discussed above. Provision for credit losses The provision for credit losses was $47.0 million for the first quarter of 2009 compared to $7.5 million for the first quarter of 2008 and compared to $62.9 million in the fourth quarter of 2008. The provision for credit losses was based on the review of the adequacy of the allowance for loan losses at March 31, 2009. The provision for credit losses represents the charge or credit against current earnings that is determined by management, through a credit review process, as the amount needed to establish an allowance that management believes to be sufficient to absorb credit losses inherent in the Company’s loan portfolio. The following table summarizes the charge-offs and recoveries for the quarters as indicated: (more) Page 3 For the three months ended March 31, (In thousands) 2009 2008 Charge-offs: Commercial loans $ 11,078 $ 251 Construction loans 23,400 4,130 Real estate loans 1,361 175 Real estate- land loans 2,377 339 Total charge-offs 38,216 4,895 Recoveries: Commercial loans 198 187 Installment and other loans - 4 Total recoveries 198 191 Net Charge-offs $ 38,018 $ 4,704
- 3. Total charge-offs for the first quarter of 2009 included $14.4 million of charge-offs on ten residential construction loan borrowers in California, $5.0 million charge-off on two office building construction loans in California, a $1.3 million charge-off on a residential construction loan in Nevada, a $1.3 million charge-off on a residential construction loan in Texas, and $11.1 million of charge-offs on twenty six commercial loan borrowers. Net loan charge-offs increased from $30.5 million in the fourth quarter of 2008 to $38.0 million in the first quarter of 2009 and compared to $4.7 million in the first quarter of last year as a result of the continuing weak economy and the decline in residential housing values. Non-interest income Non-interest income, which includes revenues from depository service fees, letters of credit commissions, securities gains (losses), gains (losses) on loan sales, wire transfer fees, and other sources of fee income, was $27.7 million for the first quarter of 2009, an increase of $21.2 million compared to the non-interest income of $6.5 million for the first quarter of 2008. The increase in non-interest income was primarily due to increases in net gains on sale of available-for-sale securities of $22.5 million. Offsetting the increase were a $947,000 decrease in venture capital income, included in other operating income, primarily due to write-downs on venture capital investments. Non-interest expense Non-interest expense increased $5.7 million, or 17.9%, to $37.7 million in the first quarter of 2009 compared to $32.0 million in the same quarter a year ago. The efficiency ratio was 38.41% in the first quarter of 2009 compared to 39.11% for the same period a year ago. Other real estate owned (“OREO”) expense increased $2.1 million primarily due to a $1.6 million provision for OREO write-down and a $518,000 increase in OREO operating expense in the first quarter of 2009 compared to the same quarter a year ago. Federal Deposit Insurance Corporation (“FDIC”) and State assessments increased to $2.9 million in the first quarter of 2009 from $291,000 in the same quarter a year ago. Expense from operations of affordable housing investments increased $873,000 to $1.7 million compared to $0.8 million in the same quarter a year ago as a result of additional investments in affordable housing projects and a higher cash distribution in the same quarter a year ago. Occupancy expense increased $838,000 primarily due to increases in depreciation expense of $737,000 and relocation expenses of $153,000 related to our new administrative office at 9650 Flair Drive, El Monte which opened in January 2009. Professional service expense increased $582,000, or 24.4%, due to increases in legal expenses, collection expenses, and information technology consulting expenses. (more) Page 4 Offsetting the above described increases were decreases of $973,000 in salaries and employee benefits and decreases of $348,000 in computer and equipment expense. Salaries and employee benefits decreased primarily due to a $1.2 million decrease in bonus accruals and a $249,000 decrease in option compensation expense offset by a $476,000 decrease in deferred loan cost. Computer and equipment expense declined due primarily to a decrease of $366,000 in software license fees as a result of the Company’s new data processing contract. The Company expects to complete its interim goodwill impairment review prior to the filing of its Quarterly Report on Form 10-Q for the first quarter of 2009. At this time, the Company does not expect any goodwill impairment as of March 31, 2009. Income taxes
- 4. The effective tax rate was 23.7% for the first quarter of 2009 compared to 35.4% for the same quarter a year ago and compared to 27.9% for the full year 2008. The decrease in the effective tax rate was primarily due to the lower pretax income in the first quarter of 2009 combined with an increase in low income housing tax credits in 2009. BALANCE SHEET REVIEW Total assets decreased by $184.5 million, or 1.6%, to $11.4 billion at March 31, 2009, from $11.6 billion at December 31, 2008. Total gross loans decreased $78.7 million, or 1.1%, to $7.4 billion as of March 31, 2009, from $7.5 billion as of December 31, 2008, primarily due to decreases in commercial loans. As a result of weak economy, declines in trade finance caused decreases in commercial loans in the first quarter of 2009. The changes in the loan composition from December 31, 2008, are presented below: March 31, 2009 December 31, 2008 % Change Type of Loans: (Dollars in thousands) Commercial $ 1,543,876 $ 1,620,438 (5) Residential mortgage 627,121 622,741 1 Commercial mortgage 4,124,512 4,132,850 (0) Equity lines 178,418 168,756 6 Real estate construction 903,191 913,168 (1) Installment 14,531 11,340 28 Other 1,988 3,075 (35) Gross loans and leases $ 7,393,637 $ 7,472,368 (1) Allowance for loan losses (132,393) (122,093) 8 Unamortized deferred loan fees (9,958) (10,094) (1) Total loans and leases, net $ 7,251,286 $ 7,340,181 (1) Total deposits were $7.3 billion at March 31, 2009, an increase of $428.7 million, or 6.3%, from $6.8 billion at December 31, 2008, primarily due to increases of $140.7 million, or 21.3%, in money market accounts, increases of $113.0 million, or 6.9%, in time deposits under $100,000 and increases of $114.7 million, or 3.6%, in time deposits of $100,000 or more. The changes in the deposit composition from December 31, 2008, are presented below: (more) Page 5 March 31, 2009 December 31, 2008 % Change Deposits (Dollars in thousands) Non-interest-bearing demand $ 767,072 $ 730,433 5 NOW 273,917 257,234 6 Money market 800,196 659,454 21 Savings 323,204 316,263 2 Time deposits under $100,000 1,757,403 1,644,407 7 Time deposits of $100,000 or more 3,343,675 3,228,945 4 Total deposits $ 7,265,467 $ 6,836,736 6 ASSET QUALITY REVIEW
- 5. At March 31, 2009, total non-accrual loans of $221.2 million increased $40.0 million, or 22.1% from $181.2 million at December 31, 2008. A summary of non-accrual loans by collateral type is shown below: No. of Other No. of No. of Collateral Type California Borrowers States Borrowers Total Borrowers (Dollars in thousands except no. of borrowers) Commercial real estate $ 16,213 10 $ 14,510 21 $ 30,723 31 Commercial 16,623 19 7,734 10 24,357 29 Construction- residential 107,986 16 15,487 5 123,473 21 Construction- non- residential 17,472 5 1,073 1 18,545 6 Residential mortgage 4,364 12 1,860 5 6,224 17 Land 8,973 8 8,929 5 17,902 13 Total $ 171,631 70 $ 49,593 47 $ 221,224 117 At March 31, 2009, total residential construction loans were $403.1 million of which $15.9 million were in San Bernardino and Riverside counties in California and $11.2 million were in the Central Valley in California. Residential construction loans of $6.7 million in the Central Valley and $10.2 million in San Bernardino and Riverside counties were on non-accrual status as of March 31, 2009. At March 31, 2009, total land loans were $210.2 million of which $24.1 million were in San Bernardino and Riverside counties and $2.8 million were in the Central Valley. Land loans of $1.8 million in the Central Valley and $0.4 million in San Bernardino county were on non-accrual status as of March 31, 2009. At March 31, 2009, net carrying value of other real estate owned increased $3.9 million, or 6.4%, to $64.9 million from $61.0 million at December 31, 2008. At March 31, 2009, $27.5 million of other real estate owned was located in Texas. Non-performing assets to total assets was 2.6% at March 31, 2009, compared to 2.2% at December 31, 2008. Total non-performing assets increased $42.2 million, or 16.8%, to $294.0 million at March 31, 2009, compared with $251.8 million at December 31, 2008, primarily due to a $40.0 million increase in non-accrual loans and a $3.9 million increase in OREO and other assets offset by a $1.7 million decrease in accruing loans past due 90 days or more. In addition to the non-performing asset totals above, a borrower with an outstanding loan balance of $47.6 million filed for bankruptcy in March 2009. While the loan is 59 days past due at March 31, 2009, management believes that the value of the underlying real estate collateral is sufficient for a full collection of principal and interest. (more) Page 6 The allowance for loan losses was $132.4 million and the allowance for off-balance sheet unfunded credit commitments was $6.0 million at March 31, 2009, and represented the amount that the Company believes to be sufficient to absorb credit losses inherent in the Company’s loan portfolio. The allowance for credit losses, the sum of allowance for loan losses and for off-balance sheet unfunded credit commitments, was $138.4 million at March 31, 2009, compared to $129.4 million at December 31, 2008, an increase of $9.0 million, or 6.9%. The allowance for credit losses represented 1.87% of period-end gross loans and 61.2% of non-performing loans at March 31, 2009. The comparable ratios were 1.73% of period-end gross loans and 68.9% of non-performing loans at December 31, 2008. Results of the changes to the Company’s non-performing assets and troubled debt restructurings are highlighted below:
- 6. March 31, 2009 December 31, 2008 % Change (Dollars in thousands) Non-performing assets Accruing loans past due 90 days or more $ 5,013 $ 6,733 (26) Non-accrual loans: Construction- residential 123,473 100,169 23 Construction- non-residential 18,545 22,012 (16) Land 17,902 12,608 42 Commercial real estate, excluding land 30,723 19,733 56 Commercial 24,357 20,904 17 Residential mortgage 6,224 5,776 8 Total non-accrual loans: $ 221,224 $ 181,202 22 Total non-performing loans 226,237 187,935 20 Other real estate owned and other assets 67,799 63,892 6 Total non-performing assets $ 294,036 $ 251,827 17 Troubled debt restructurings $ 4,037 $ 924 337 Allowance for loan losses $ 132,393 $ 122,093 8 Allowance for off-balance sheet credit commitments 6,014 7,332 (18) Allowance for credit losses $ 138,407 $ 129,425 7 Total gross loans outstanding, at period-end $ 7,393,637 $ 7,472,368 (1) Allowance for loan losses to non-performing loans, at period-end 58.52% 64.97% Allowance for loan losses to gross loans, at period-end 1.79% 1.63% Allowance for credit losses to non-performing loans, at period-end 61.18% 68.87% Allowance for credit losses to gross loans, at period-end 1.87% 1.73% DIVIDEND DECLARATION On April 23, 2009, the Board of Directors of the Company declared a cash dividend of 8 cents per common share payable May 14, 2009, to stockholders of record at the close of business on May 4, 2009. The amount of this dividend is 2.5 cents, or approximately 24%, less than the 10.5 cents cash dividend per common share paid in the previous quarter. (more) Page 7 quot;Although we remain well-capitalized and profitable, we believe that reducing our dividend at this time is a prudent measure in view of the continuing uncertainties in the financial markets and the economy,quot; said Dunson K. Cheng, Chairman of the Board, President, and Chief Executive Officer of the Company. quot;We made this difficult decision after duly considering the long-term interests of our stockholders, and believe the reduced dividend serves to provide value to our stockholders while maintaining a disciplined approach to capital management.quot; CAPITAL ADEQUACY REVIEW
- 7. At March 31, 2009, the Tier 1 risk-based capital ratio of 12.50%, total risk-based capital ratio of 14.34%, and Tier 1 leverage capital ratio of 9.65%, continue to place the Company in the “well capitalized” category, which is defined as institutions with a Tier 1 risk-based capital ratio equal to or greater than 6%, a total risk-based capital ratio equal to or greater than 10%, and a Tier 1 leverage capital ratio equal to or greater than 5%. At December 31, 2008, the Company’s Tier 1 risk-based capital ratio was 12.12%, the total risk-based capital ratio was 13.94%, and Tier 1 leverage capital ratio was 9.79%. ABOUT CATHAY GENERAL BANCORP Cathay General Bancorp is the holding company for Cathay Bank, a California state-chartered bank. Founded in 1962, Cathay Bank offers a wide range of financial services. Cathay Bank currently operates 31 branches in California, nine branches in New York State, one in Massachusetts, two in Texas, three in Washington State, three in the Chicago, Illinois area, one in New Jersey, one in Hong Kong, and a representative office in Shanghai and in Taipei. Cathay Bank’s website is found at http://www.cathaybank.com. Cathay General Bancorp's website is found at http://www.cathaygeneralbancorp.com. FORWARD-LOOKING STATEMENTS AND OTHER NOTICES Statements made in this press release, other than statements of historical fact, are forward-looking statements within the meaning of the applicable provisions of the Private Securities Litigation Reform Act of 1995 regarding management’s beliefs, projections, and assumptions concerning future results and events. These forward-looking statements may include, but are not limited to, such words as “aims,” “anticipates,” “believes,” “could,” “estimates,” “expects,” “hopes,” “intends,” “may,” “plans,” “projects,” “seeks,” “shall,” “should,” “will,” “predicts,” “potential,” “continue,” and variations of these words and similar expressions. Forward-looking statements are based on estimates, beliefs, projections, and assumptions and are not guarantees of future performance. These forward- looking statements are subject to certain risks and uncertainties that could cause actual results to differ materially from our historical experience and our present expectations or projections. Such risks and uncertainties and other factors include, but are not limited to, adverse developments or conditions related to or arising from: significant volatility and deterioration in the credit and financial markets; adverse changes in general economic conditions; the effects of the Emergency Economic Stabilization Act, the American Recovery and Reinvestment Act, and the Troubled Asset Relief Program (TARP) and any changes or amendments thereto; deterioration in asset or credit quality; the availability of capital; the impact of any goodwill impairment that may be determined; acquisitions of other banks, if any; fluctuations in interest rates; the soundness of other financial institutions; expansion into new market areas; earthquakes, wildfires, or other natural disasters; competitive pressures; legislative, regulatory, and accounting rule changes and developments; and general economic or business conditions in California and other regions where Cathay Bank has operations, including, but not limited to, adverse changes in economic conditions resulting from a prolonged economic downturn. (more) Page 8 These and other factors are further described in Cathay General Bancorp's Annual Report on Form 10-K for the year ended December 31, 2008 (at Item 1A in particular), other reports and registration statements filed with the Securities and Exchange Commission (“SEC”), and other filings it makes with the SEC from time to time. Actual results in any future period may also vary from the past results discussed in this press release. Given these risks and uncertainties, readers are cautioned not to place undue reliance on any forward-looking statements, which speak to the date of this press release. Cathay General Bancorp has no intention and undertakes no obligation to update any forward-looking statement or to publicly announce any revision of any forward-looking statement to reflect future developments or events, except as required by law. Cathay General Bancorp's filings with the SEC are available at the website maintained by the SEC at http://www.sec.gov, or by request directed to Cathay General Bancorp, 9650 Flair Drive, El Monte, California 91731, Attention: Investor Relations (626) 279-3286.
- 8. (more) Page 9 CATHAY GENERAL BANCORP CONSOLIDATED FINANCIAL HIGHLIGHTS (Unaudited) Three months ended March 31, (Dollars in thousands, except per share data) 2009 2008 % Change FINANCIAL PERFORMANCE Net interest income before provision for credit losses $ 70,425 $ 75,190 (6) Provision for credit losses 47,000 7,500 527 Net interest income after provision for credit losses 23,425 67,690 (65) Non-interest income 27,661 6,524 324 Non-interest expense 37,674 31,956 18 Income before income tax expense 13,412 42,258 (68) Income tax expense 3,175 14,959 (79) Net income $ 10,237 $ 27,299 (63) Dividends on preferred stock (4,231) - 100 Net income available to common stockholders $ 6,006 $ 27,299 (78) Net income available to common stockholders per common share: Basic $ 0.12 $ 0.55 (78) Diluted $ 0.12 $ 0.55 (78) Cash dividends paid per common share $ 0.105 $ 0.105 - SELECTED RATIOS Return on average assets 0.37% 1.07% (65) Return on average total stockholders’ equity 3.21% 10.99% (71) Efficiency ratio 38.41% 39.11% (2) Dividend payout ratio 50.78% 18.98% 168 YIELD ANALYSIS (Fully taxable equivalent) Total interest-earning assets 5.26% 6.46% (19) Total interest-bearing liabilities 2.98% 3.80% (22) Net interest spread 2.28% 2.66% (14) Net interest margin 2.69% 3.16% (15) March 31, 2009 March 31, 2008 December 31, 2008 CAPITAL RATIOS Tier 1 risk-based capital ratio 12.50% 9.41% 12.12% Total risk-based capital ratio 14.34% 10.88% 13.94% Tier 1 leverage capital ratio 9.65% 7.83% 9.79% (more)
- 9. Page 10 CATHAY GENERAL BANCORP CONDENSED CONSOLIDATED BALANCE SHEETS (Unaudited) (In thousands, except share and per share data) March 31, 2009 December 31, 2008 % change Assets Cash and due from banks $ 80,856 $ 84,818 (5) Short-term investments 31,000 25,000 24 Securities purchased under agreements to resell - 201,000 (100) Securities available-for-sale (amortized cost of $2,907,218 in 2009 and $3,043,566 in 2008) 2,943,467 3,083,817 (5) Trading securities 248,841 12 100 Loans 7,393,637 7,472,368 (1) Less: Allowance for loan losses (132,393) (122,093) 8 Unamortized deferred loan fees, net (9,958) (10,094) (1) Loans, net 7,251,286 7,340,181 (1) Federal Home Loan Bank stock 71,791 71,791 - Other real estate owned, net 64,922 61,015 6 Affordable housing investments, net 101,835 103,562 (2) Premises and equipment, net 108,045 104,107 4 Customers’ liability on acceptances 33,867 39,117 (13) Accrued interest receivable 36,555 43,603 (16) Goodwill 319,468 319,557 (0) Other intangible assets, net 27,528 29,246 (6) Other assets 78,683 75,813 4 Total assets $ 11,398,144 $ 11,582,639 (2) Liabilities and Stockholders’ Equity Deposits Non-interest-bearing demand deposits $ 767,072 $ 730,433 5 Interest-bearing deposits: NOW deposits 273,917 257,234 6 Money market deposits 800,196 659,454 21 Savings deposits 323,204 316,263 2 Time deposits under $100,000 1,757,403 1,644,407 7 Time deposits of $100,000 or more 3,343,675 3,228,945 4 Total deposits 7,265,467 6,836,736 6 Federal funds purchased 7,000 52,000 (87) Securities sold under agreements to repurchase 1,559,000 1,610,000 (3) Advances from the Federal Home Loan Bank 929,362 1,449,362 (36) Other borrowings from financial institutions 10,000 - 100 Other borrowings for affordable housing investments 19,474 19,500 (0) Long-term debt 171,136 171,136 - Acceptances outstanding 33,867 39,117 (13) Other liabilities 100,039 103,401 (3) Total liabilities 10,095,345 10,281,252 (2) Commitments and contingencies - - -
- 10. Total equity 1,302,799 1,301,387 0 Total liabilities and equity $ 11,398,144 $ 11,582,639 (2) Book value per common stock share $ 20.92 $ 20.90 0 Number of common stock shares outstanding 49,535,723 49,508,250 0 Page 11 CATHAY GENERAL BANCORP CONDENSED CONSOLIDATED STATEMENTS OF INCOME (Unaudited) Three months ended March 31, 2009 2008 (In thousands, except share and per share data) INTEREST AND DIVIDEND INCOME Loan receivable, including loan fees $ 103,994 $ 117,025 Investment securities- taxable 32,194 28,506 Investment securities- nontaxable 246 366 Federal Home Loan Bank stock - 753 Agency preferred stock - 716 Federal funds sold and securities purchased under agreements to resell 1,302 6,480 Deposits with banks 58 454 Total interest and dividend income 137,794 154,300 INTEREST EXPENSE Time deposits of $100,000 or more 23,237 31,868 Other deposits 16,115 17,235 Securities sold under agreements to repurchase 15,936 14,625 Advances from Federal Home Loan Bank 10,565 12,121 Long-term debt 1,505 2,849 Short-term borrowings 11 412 Total interest expense 67,369 79,110 Net interest income before provision for credit losses 70,425 75,190 Provision for credit losses 47,000 7,500 Net interest income after provision for loan losses 23,425 67,690 NON-INTEREST INCOME Securities gains, net 22,498 - Letters of credit commissions 976 1,440 Depository service fees 1,399 1,272 Other operating income 2,788 3,812 Total non-interest income 27,661 6,524
- 11. NON-INTEREST EXPENSE Salaries and employee benefits 16,886 17,859 Occupancy expense 4,121 3,283 Computer and equipment expense 1,896 2,244 Professional services expense 2,967 2,385 FDIC and State assessments 2,854 291 Marketing expense 1,028 1,017 Other real estate owned expense (income) 2,142 (17) Operations of affordable housing investments 1,698 825 Amortization of core deposit intangibles 1,711 1,752 Other operating expense 2,371 2,317 Total non-interest expense 37,674 31,956 Income before income tax expense 13,412 42,258 Income tax expense 3,175 14,959 Net income 10,237 27,299 Dividends on preferred stock (4,231) - Net income available to common stockholders $ 6,006 $ 27,299 Net income available to common stockholders per common share: Basic $ 0.12 $ 0.55 Diluted $ 0.12 $ 0.55 Cash dividends paid per common share $ 0.105 $ 0.105 Basic average common shares outstanding 49,531,343 49,346,285 Diluted average common shares outstanding 49,541,041 49,531,531 Page 12 CATHAY GENERAL BANCORP AVERAGE BALANCES – SELECTED CONSOLIDATED FINANCIAL INFORMATION (Unaudited) For the three months ended, (In thousands) March 31, 2009 March 31, 2008 December 31, 2008 Average Average Average Average Yield/Rate Average Yield/Rate (1) Average Yield/Rate Balance (1) (2) Balance (2) Balance (1) (2) Interest-earning assets Loans and leases (1) $ 7,459,092 5.65% $ 6,804,599 6.92% $ 7,500,351 5.85% Taxable investment securities 2,970,700 4.40% 2,250,823 5.09% 2,625,517 4.76% Tax-exempt investment securities (2) 22,845 6.73% 69,668 8.94% 26,190 6.45% FHLB stock 71,791 0.00% 65,753 4.61% 68,235 3.59% Federal funds sold and securities purchased under agreements to resell 80,700 6.54% 419,675 6.21% 155,326 6.97% Deposits with banks 24,998 0.94% 24,885 7.34% 19,471 2.72%
- 12. Total interest-earning assets $10,630,126 5.26% $ 9,635,403 6.46% $10,395,090 5.57% Interest-bearing liabilities Interest-bearing demand deposits $ 259,535 0.40% $ 237,611 0.82% $ 260,558 0.48% Money market 759,930 1.58% 701,552 2.20% 746,152 1.63% Savings deposits 311,145 0.22% 330,504 0.54% 331,329 0.25% Time deposits 4,961,130 2.94% 4,180,871 4.26% 4,777,558 3.18% Total interest-bearing deposits $ 6,291,740 2.54% $ 5,450,538 3.62% $ 6,115,597 2.72% Federal funds purchased 16,933 0.26% 43,341 3.54% 39,620 1.05% Securities sold under agreements to repurchase 1,580,989 4.09% 1,559,336 3.77% 1,555,217 4.05% Other borrowed funds 1,117,844 3.83% 1,156,238 4.23% 1,262,653 3.55% Long-term debt 171,136 3.57% 171,136 6.70% 171,136 5.12% Total interest-bearing liabilities 9,178,642 2.98% 8,380,589 3.80% 9,144,223 3.10% Non-interest-bearing demand deposits 734,883 780,579 759,038 Total deposits and other borrowed funds $ 9,913,525 $ 9,161,168 $ 9,903,261 Total average assets $11,351,762 $10,302,295 $11,148,143 Total average stockholders’ equity $ 1,300,732 $ 998,917 $ 1,093,748 (1) Yields and interest earned include net loan fees. Non-accrual loans are included in the average balance. (2) The average yield has been adjusted to a fully taxable-equivalent basis for certain securities of states and political subdivisions and other securities held using a statutory Federal income tax rate of 35%.