Chandigarh Escorts Service 📞8868886958📞 Just📲 Call Nihal Chandigarh Call Girl...
Vietnam market size
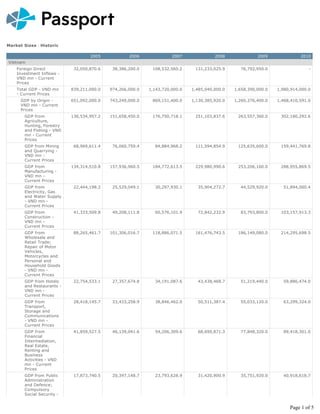
1. Market Sizes Historic
2005 2006 2007 2008 2009 2010
Vietnam
Foreign Direct 32,050,870.6 38,386,200.0 108,532,560.2 131,233,025.9 76,792,950.0 -
Investment Inflows -
VND mn - Current
Prices
Total GDP - VND mn 839,211,000.0 974,266,000.0 1,143,720,000.0 1,485,040,000.0 1,658,390,000.0 1,980,914,000.0
- Current Prices
GDP by Origin - 651,092,000.0 743,249,000.0 869,151,400.0 1,130,385,920.0 1,260,376,400.0 1,468,410,591.0
VND mn - Current
Prices
GDP from 136,534,957.2 151,658,450.0 176,750,718.1 251,103,837.6 263,557,360.0 302,180,292.6
Agriculture,
Hunting, Forestry
and Fishing - VND
mn - Current
Prices
GDP from Mining 68,969,611.4 76,060,759.4 84,884,968.2 111,594,854.9 125,635,600.0 159,441,769.8
and Quarrying -
VND mn -
Current Prices
GDP from 134,314,510.8 157,936,960.5 184,772,613.5 229,980,990.6 253,206,160.0 288,955,869.5
Manufacturing -
VND mn -
Current Prices
GDP from 22,444,198.2 25,529,049.1 30,297,930.1 35,904,272.7 44,529,920.0 51,894,000.4
Electricity, Gas
and Water Supply
- VND mn -
Current Prices
GDP from 41,333,509.8 49,208,111.8 60,576,101.9 72,842,232.9 83,793,800.0 103,157,913.3
Construction -
VND mn -
Current Prices
GDP from 88,265,461.7 101,306,016.7 118,886,071.5 161,476,743.5 186,149,080.0 214,295,698.5
Wholesale and
Retail Trade;
Repair of Motor
Vehicles,
Motorcycles and
Personal and
Household Goods
- VND mn -
Current Prices
GDP from Hotels 22,754,533.1 27,357,674.8 34,191,087.6 43,438,468.7 51,219,440.0 59,886,474.0
and Restaurants -
VND mn -
Current Prices
GDP from 28,418,145.7 33,433,258.9 38,846,462.0 50,511,387.4 55,033,120.0 63,299,324.0
Transport,
Storage and
Communications
- VND mn -
Current Prices
GDP from 41,859,527.5 46,139,041.6 54,206,309.6 68,699,871.3 77,848,320.0 89,418,301.0
Financial
Intermediation,
Real Estate,
Renting and
Business
Activities - VND
mn - Current
Prices
GDP from Public 17,873,740.5 20,397,148.7 23,793,628.9 31,420,900.9 35,751,920.0 40,918,618.7
Administration
and Defence;
Compulsory
Social Security -
Page 1 of 5
2. VND mn -
Current Prices
GDP from 47,221,339.3 52,969,877.9 60,481,109.8 71,470,579.9 81,449,200.0 92,456,805.0
Education, Health,
Social Work and
Other
Community,
Social, Personal
Service Activities
- VND mn -
Current Prices
GDP from 1,102,464.9 1,252,650.6 1,464,398.7 1,941,779.6 2,202,480.0 2,505,524.1
Activities of
Households - VND
mn - Current
Prices
Services as a % 12.7 12.3 12.1 11.6 11.8 11.2
of GDP - % of
total GDP
Manufacturing as 16.0 16.2 16.2 15.5 15.3 14.6
a % of GDP - %
of total GDP
Real GDP Growth - % 8.4 8.2 8.4 6.2 5.2 6.8
growth
Exports - US$ mn 32,442.0 39,605.0 48,302.0 44,380.0 56,543.0 71,970.0
Exports (fob) by 32,442.0 39,605.0 48,302.0 44,380.0 56,543.0 71,970.0
Destination - US$ mn
Exports (fob) by 32,442.0 39,605.0 48,302.0 44,380.0 56,543.0 71,970.0
Commodity - US$ mn
Imports - US$ mn 36,978.0 44,410.0 60,869.0 49,570.0 68,922.0 83,970.0
Imports (cif) by 36,978.0 44,410.0 60,869.0 49,570.0 68,922.0 83,970.0
Origin - US$ mn
Imports (cif) by 36,978.0 44,410.0 60,869.0 49,570.0 68,922.0 83,970.0
Commodity - US$ mn
Economically Active 41,022.6 41,481.3 41,793.7 42,281.4 43,979.8 44,918.3
Population - '000
Economically Active 3,708.7 3,720.6 3,767.7 3,757.2 3,737.8 3,687.0
Population Aged
15-19 - '000
Economically Active 4,843.6 4,514.6 4,093.5 3,720.1 4,173.2 4,224.8
Population Aged
20-24 - '000
Economically Active 4,578.1 3,999.9 3,221.3 2,563.1 3,145.0 3,114.2
Population Aged
25-29 - '000
Economically Active 5,703.5 5,707.2 5,671.0 5,653.8 5,754.4 5,749.0
Population Aged
30-34 - '000
Economically Active 5,967.4 6,168.6 6,352.1 6,586.2 6,627.6 6,710.0
Population Aged
35-39 - '000
Economically Active 5,339.7 5,604.6 5,882.3 6,137.8 6,217.1 6,349.0
Population Aged
40-44 - '000
Economically Active 4,093.9 4,368.1 4,671.8 4,954.4 5,141.8 5,339.8
Population Aged
45-49 - '000
Economically Active 3,116.4 3,337.2 3,549.8 3,779.1 4,055.9 4,289.0
Population Aged
50-54 - '000
Economically Active 1,838.8 2,052.8 2,336.1 2,668.8 2,783.5 3,024.1
Population Aged
55-59 - '000
Economically Active 948.6 1,038.7 1,166.5 1,283.5 1,228.0 1,296.0
Population Aged
60-64 - '000
Economically Active 883.8 968.9 1,081.6 1,177.5 1,115.7 1,135.3
Population Aged
65+ - '000
Economically Active 21,039.4 21,356.3 21,587.0 21,898.2 22,737.6 23,240.4
Male Population -
'000
Economically Active 19,983.2 20,125.0 20,206.8 20,383.1 21,242.2 21,678.0
Female Population -
Page 2 of 5
3. '000
Labour Force 74.7 73.7 72.5 71.6 73.2 73.4
Participation Rate -
% of working age
15-64 population
Employed Population 40,121.6 40,600.6 40,946.5 41,275.1 42,704.4 43,829.4
- '000
Employed 3,570.1 3,590.4 3,649.2 3,620.1 3,570.7 3,550.0
Population Aged
15-19 - '000
Employed 4,567.2 4,232.1 3,811.3 3,392.1 3,749.4 3,859.0
Population Aged
20-24 - '000
Employed 4,435.9 3,861.4 3,088.7 2,407.2 2,948.9 2,948.2
Population Aged
25-29 - '000
Employed 5,606.2 5,614.7 5,582.2 5,549.1 5,623.9 5,639.0
Population Aged
30-34 - '000
Employed 5,887.3 6,092.9 6,279.9 6,493.4 6,509.5 6,607.4
Population Aged
35-39 - '000
Employed 5,270.4 5,536.8 5,815.2 6,053.7 6,107.8 6,252.7
Population Aged
40-44 - '000
Employed 4,038.1 4,312.5 4,619.0 4,888.2 5,056.1 5,265.2
Population Aged
45-49 - '000
Employed 3,089.9 3,313.3 3,529.9 3,756.7 4,030.3 4,269.5
Population Aged
50-54 - '000
Employed 1,827.1 2,041.8 2,325.2 2,655.8 2,766.9 3,009.8
Population Aged
55-59 - '000
Employed 947.0 1,037.2 1,165.8 1,283.1 1,227.5 1,295.4
Population Aged
60-64 - '000
Employed 882.4 967.4 1,080.0 1,175.7 1,113.3 1,133.3
Population Aged
65+ - '000
Employed Male 20,652.9 20,974.5 21,229.2 21,465.9 22,182.5 22,761.7
Population - '000
Employed Female 19,468.8 19,626.1 19,717.3 19,809.2 20,521.9 21,067.6
Population - '000
Paid Employment in 1,183.9 1,301.1 1,378.6 1,470.1 1,526.0 1,600.1
Manufacturing -
'000
Employment in 57.1 55.4 53.9 52.6 51.9 51.3
Agriculture,
Hunting, Forestry
and Fishing - % of
employed
population
Employment in 8.6 8.8 9.2 9.5 9.5 9.7
Community,
Education, Health,
Social, Personal
Services, Public
Admin and Defence
- % of employed
population
Employment in 4.7 4.9 5.1 5.3 5.6 5.7
Construction - % of
employed
population
Employment in 0.4 0.4 0.4 0.5 0.5 0.5
Electricity, Gas and
Water Supply - %
of employed
population
Employment in 0.7 0.9 1.0 1.1 1.1 1.1
Finance, Insurance,
Real Estate and
Business Services -
% of employed
population
Page 3 of 5
4. Employment in 12.3 13.1 13.5 14.0 14.3 14.6
Manufacturing - %
of employed
population
Employment in 0.8 0.9 0.9 1.0 1.0 1.0
Mining and
Quarrying - % of
employed
population
Employment in 2.6 2.6 2.5 2.5 2.5 2.4
Transport, Storage
and
Communications -
% of employed
population
Employment in 12.2 12.3 12.8 12.7 12.9 12.9
Trade, Motor
Vehicles and
Personal and
Household Goods
Repair, Hotels and
Restaurants - % of
employed
population
Employment in 0.6 0.7 0.7 0.8 0.7 0.7
Undefined Sectors -
% of employed
population
Employment Rate - 74.7 73.9 72.9 71.9 72.9 73.5
% of working age
15-64 population
Unemployed 900.9 880.7 847.2 1,006.3 1,275.4 1,088.9
Population - '000
Unemployed 138.7 130.2 118.5 137.1 167.0 137.0
Population Aged
15-19 - '000
Unemployed 276.4 282.5 282.2 328.0 423.8 365.9
Population Aged
20-24 - '000
Unemployed 142.1 138.5 132.6 155.9 196.1 166.0
Population Aged
25-29 - '000
Unemployed 97.3 92.5 88.8 104.7 130.5 110.0
Population Aged
30-34 - '000
Unemployed 80.2 75.7 72.3 92.7 118.1 102.6
Population Aged
35-39 - '000
Unemployed 69.2 67.8 67.1 84.1 109.3 96.2
Population Aged
40-44 - '000
Unemployed 55.7 55.6 52.8 66.2 85.7 74.6
Population Aged
45-49 - '000
Unemployed 26.5 23.9 19.9 22.3 25.5 19.5
Population Aged
50-54 - '000
Unemployed 11.7 11.1 10.9 13.1 16.6 14.3
Population Aged
55-59 - '000
Unemployed 1.6 1.5 0.7 0.4 0.5 0.6
Population Aged
60-64 - '000
Unemployed 1.4 1.6 1.6 1.8 2.3 2.0
Population Aged
65+ - '000
Unemployed Male 386.5 381.8 357.8 432.3 555.1 478.6
Population - '000
Unemployed 514.4 498.9 489.4 574.0 720.3 610.3
Female Population -
'000
Research Sources:
Economically Active Female Population: International Labour Organisation/Euromonitor InternationalEconomically Active Male Population:
Page 4 of 5