Enjoy Night⚡Call Girls Patel Nagar Delhi >༒8448380779 Escort Service
ual UAL Investor Update: Q4 December 17, 2008
1. UAL Investor Update: December 17, 2008
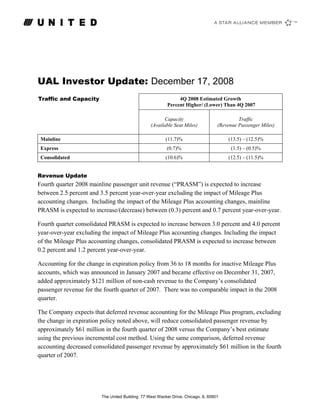
Traffic and Capacity 4Q 2008 Estimated Growth
Percent Higher/ (Lower) Than 4Q 2007
Capacity Traffic
(Available Seat Miles) (Revenue Passenger Miles)
(11.7)% (13.5) – (12.5)%
Mainline
(0.7)% (1.5) – (0.5)%
Express
(10.6)% (12.5) – (11.5)%
Consolidated
Revenue Update
Fourth quarter 2008 mainline passenger unit revenue (“PRASM”) is expected to increase
between 2.5 percent and 3.5 percent year-over-year excluding the impact of Mileage Plus
accounting changes. Including the impact of the Mileage Plus accounting changes, mainline
PRASM is expected to increase/(decrease) between (0.3) percent and 0.7 percent year-over-year.
Fourth quarter consolidated PRASM is expected to increase between 3.0 percent and 4.0 percent
year-over-year excluding the impact of Mileage Plus accounting changes. Including the impact
of the Mileage Plus accounting changes, consolidated PRASM is expected to increase between
0.2 percent and 1.2 percent year-over-year.
Accounting for the change in expiration policy from 36 to 18 months for inactive Mileage Plus
accounts, which was announced in January 2007 and became effective on December 31, 2007,
added approximately $121 million of non-cash revenue to the Company’s consolidated
passenger revenue for the fourth quarter of 2007. There was no comparable impact in the 2008
quarter.
The Company expects that deferred revenue accounting for the Mileage Plus program, excluding
the change in expiration policy noted above, will reduce consolidated passenger revenue by
approximately $61 million in the fourth quarter of 2008 versus the Company’s best estimate
using the previous incremental cost method. Using the same comparison, deferred revenue
accounting decreased consolidated passenger revenue by approximately $61 million in the fourth
quarter of 2007.
The United Building: 77 West Wacker Drive, Chicago, IL 60601
2. The Company estimates that cargo, mail and other revenue will be between $370 million and
$380 million for the quarter, including UAFC sales of approximately $3 million.
Unit Costs
The Company estimates that mainline operating cost per available seat mile (“CASM”),
excluding fuel and the impact of certain primarily non-cash impairment, severance, and other
similar accounting charges expected to be incurred in the fourth quarter as described below, will
be up 1.0 percent to 1.5 percent for the fourth quarter of 2008 from the same period in 2007.
This unit cost projection includes a non-cash charge for maintenance inventory of approximately
$20 million that the Company expects to record in the fourth quarter. The non-cash maintenance
inventory charge represents approximately 80 basis points of non-fuel unit cost growth year over
year.
Fuel
Fourth quarter total estimated mainline fuel consumption is 491 million gallons. The Company
expects the following fuel prices based on the closing forward curve on December 11th:
Three Months
Estimated Mainline Fuel Price Ending Dec. 31,
2008
Price Per Gallon
Mainline Fuel price including taxes and excluding impact of hedges $2.55
Mainline Fuel price including taxes and cash net losses on settled hedges* $2.85
Mainline Fuel price including taxes and impact of mark to market net losses on settled and
unsettled hedges* $3.63
* Includes only the hedge gains/losses that are accounted for in the fuel expense line; additional gains/losses on fuel hedges are
included in non-operating income / expense.
The actual gain or loss on fuel hedges will be determined based on market prices prevailing at
the end of the quarter.
The table below outlines the Company’s estimated collateral provisions at various crude oil
prices, based on the hedge portfolio as of December 11, 2008:
Approximate Change in Cash Collateral For Each
Price of Crude Oil, in Dollars per Barrel: $5 per Barrel Change in the Price of Crude Oil
Above $115 No Collateral Required
Above $70, but Below $115 $70 million
Above $50, but Below $70 $65 million
Below $50 $50 million
For example, using the table above, at an illustrative $80 per barrel the Company’s required
collateral provision to its derivative counterparties would be approximately $490 million.
The United Building: 77 West Wacker Drive, Chicago, IL 60601
3. Non-Operating Income / Expense
The Company estimates that non-operating expense will be between $120 million to $130
million for the quarter, excluding the impact of any fuel hedging gains or losses that may be
recorded in the non-operating income / expense line. A portion of the Company’s total hedge
impact is recorded in non-operating expense, with the rest recorded in fuel expense. The
Company estimates that $222 million in cash fuel hedging losses and $86 million in non-cash net
mark-to-market fuel hedging losses will be recorded in non-operating income / expense at the
end of the quarter based on December 11th closing forward curve prices. The actual gain or loss
will be determined based on market prices prevailing at the end of the quarter.
Impairment, Severance and Other Similar Charges
The Company anticipates that it will record accounting charges in the fourth quarter associated
with severance, asset impairments, and other charges as a result of its previously announced
capacity reductions. At this time, the Company is unable to accurately estimate the amounts of
these charges.
Liquidity
The company expects to end the fourth quarter with unrestricted cash, cash equivalents and
short-term investments of approximately $2.0 billion, restricted cash of approximately $0.3
billion, and posted fuel hedge collateral of approximately $0.9 billion. The fuel hedge collateral
deposit estimates are based on December 11th closing forward curve prices. Actual fuel hedge
collateral will be determined based on market prices prevailing at the end of the quarter. The
Company is currently pursuing certain additional liquidity initiatives that are expected to close in
the first few months of 2009.
Tax Rate
The Company expects to have an effective income tax rate of zero for the fourth quarter of 2008
and therefore will not record a tax benefit for the quarter.
The United Building: 77 West Wacker Drive, Chicago, IL 60601
4. Share Count
Shown below, for illustrative purposes only, are estimated basic and dilutive share counts for the
fourth quarter of 2008 and full year 2008. Share counts shown below include the weighted
average impact of shares sold through December 16th, 2008 in conjunction with the $200 million
equity offering announced by the Company on December 1, 2008. Share counts shown below do
not include any shares which may be sold after December 16th, 2008. The calculation of share
counts is based on a number of assumptions including, but not limited to, an assumed market
stock price, number of shares outstanding and a statutory tax rate of 37%. Actual share counts
may be different from those shown below.
4Q 2008
Net Income (Estimated)
Basic Share Count Diluted Share Count Interest Add-back
(in millions) (in millions) (in millions)
Less than or equal to $0 130.9 130.9 $ -
$1 million - $30 million 130.9 131.5 $ -
$31 million- $48 million 130.9 153.7 $ 5.2
Greater than $49 million 130.9 157.1 $ 6.3
Full Year 2008
Net Income (Estimated)
Basic Share Count Diluted Share Count Interest Add-back
(in millions) (in millions) (in millions)
Less than or equal to $3 million 126.6 126.6 $ -
$4 million -$120 million 126.6 127.0 $ -
$121 million 126.6 149.2 $ 20.6
$122 million- $190 million 126.6 152.3 $ 20.6
Greater than $191 million 126.6 155.7 $ 25.4
The United Building: 77 West Wacker Drive, Chicago, IL 60601
5. Safe Harbor Statement under the Private Securities Litigation Reform Act of 1995: Certain
statements included in this investor update are forward-looking and thus reflect our current expectations and beliefs
with respect to certain current and future events and financial performance. Such forward-looking statements are and
will be subject to many risks and uncertainties relating to our operations and business environment that may cause
actual results to differ materially from any future results expressed or implied in such forward-looking statements.
Words such as “expects,” “will,” “plans,” “anticipates,” “indicates,” “believes,” “forecast,” “guidance,” “outlook”
and similar expressions are intended to identify forward-looking statements. Additionally, forward-looking
statements include statements that do not relate solely to historical facts, such as statements which identify
uncertainties or trends, discuss the possible future effects of current known trends or uncertainties, or which indicate
that the future effects of known trends or uncertainties cannot be predicted, guaranteed or assured. All forward-
looking statements in this report are based upon information available to us on the date of this report. We undertake
no obligation to publicly update or revise any forward-looking statement, whether as a result of new information,
future events, changed circumstances or otherwise. Our actual results could differ materially from these forward-
looking statements due to numerous factors including, without limitation, the following: our ability to comply with
the terms of our Amended Credit Facility and other financing arrangements; the costs and availability of financing;
our ability to maintain adequate liquidity; our ability to execute our operational plans; our ability to realize benefits
from our resource optimization efforts and cost reduction initiative programs; our ability to utilize our net operating
losses; our ability to attract, motivate and/or retain key employees; our ability to attract and retain customers;
demand for transportation in the markets in which we operate; general economic conditions (including interest rates,
foreign currency exchange rates, investment or credit market conditions, crude oil prices, costs of aviation fuel and
refining capacity in relevant markets); our ability to cost-effectively hedge against increases in the price of aviation
fuel; any potential realized or unrealized gains or losses related to fuel or currency hedging programs; the effects of
any hostilities, act of war or terrorist attack; the ability of other air carriers with whom we have alliances or
partnerships to provide the services contemplated by the respective arrangements with such carriers; the costs and
availability of aircraft insurance; the costs associated with security measures and practices; labor costs; industry
consolidation; competitive pressures on pricing and on demand; capacity decisions of United and/or our
competitors; U.S. or foreign governmental legislation, regulation and other actions (including open skies
agreements); our ability to maintain satisfactory labor relations; any disruptions to operations due to any potential
actions by our labor groups; weather conditions; and other risks and uncertainties set forth under the caption “Risk
Factors” in Item 1A. of the 2007 Annual Report, as well as other risks and uncertainties set forth from time to time
in the reports we file with U.S. Securities and Exchange Commission (“SEC”). Consequently, forward- looking
statements should not be regarded as representations or warranties by UAL or United that such matters will be
realized.
The United Building: 77 West Wacker Drive, Chicago, IL 60601
6. Non-GAAP To GAAP Reconciliations
Pursuant to SEC Regulation G, the Company has included the following reconciliation of
reported non-GAAP financial measures to comparable financial measures reported on a GAAP
basis. The Company believes that excluding fuel costs from certain measures is useful to
investors because it provides an additional measure of management's performance excluding the
effects of a significant cost item over which management has limited influence. In addition, the
Company believes that adjusting for Mileage Plus accounting changes provides a better
comparison to several of its peers as many still apply the incremental cost method of accounting
to their loyalty plans.
Three Months Ending Dec. 31, 2008
Operating expense per ASM – CASM* Year-over-Year
2008 Estimate 2007
(cents) % Change
Low High Actual
Low High
Mainline operating expense 14.15 14.19 12.39 14.2% 14.6%
Less: fuel expense & cost of third party
(5.79) (5.79) (4.11) 40.9% 40.9%
sales – UAFC
Mainline excluding fuel & UAFC 8.36 8.40 8.28 1.0% 1.5%
* Operating expense per ASM – CASM also excludes the impact of certain primarily non-cash impairment, severance, and other
similar accounting charges. While we anticipate that we will record such an accounting charge in the fourth quarter, at this
time the Company is unable to accurately estimate the amounts of these charges
Three Months Ending Dec. 31, 2008
Mainline Passenger Revenue per ASM Year-over-Year
2008 Estimate 2007
- PRASM (cents) % Change
Low High Actual
Low High
Mainline passenger revenue 10.83 10.93 10.86 (0.3)% 0.7%
Plus/(Less): Mileage Plus impacts 0.16 0.16 (0.14) - -
Mainline passenger revenue excluding
11.09 10.72
10.99 2.5% 3.5%
Mileage Plus impacts
Three Months Ending Dec. 31, 2008
Consolidated Passenger Revenue per Year-over-Year
2008 Estimate 2007
ASM - PRASM (cents) % Change
Low High Actual
Low High
Consolidated passenger revenue 11.74 11.85 11.71 0.2% 1.2%
Plus/(Less): Mileage Plus impacts 0.17 0.17 (0.15) - -
Consolidated passenger revenue
12.02 11.56
11.91 3.0% 4.0%
excluding Mileage Plus impacts
The United Building: 77 West Wacker Drive, Chicago, IL 60601