VIP Call Girl in Thane 💧 9920725232 ( Call Me ) Get A New Crush Everyday With...
tjx Annual Reports2000
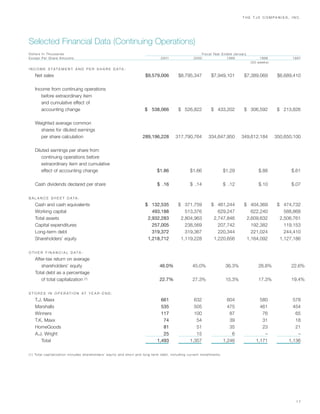
1. T H E T J X C O M PA N I E S , I N C .
Selected Financial Data (Continuing Operations)
Dollars In Thousands F i s c a l Ye a r E n d e d J a n u a r y
E x c e p t P e r S h a re A m o u n t s 2001 2000 1999 1998 1997
(53 weeks)
I N C O M E S TAT E M E N T A N D P E R S H A R E D ATA :
Net sales $9,579,006 $8,795,347 $7,949,101 $7,389,069 $6,689,410
Income from continuing operations
before extraordinary item
and cumulative effect of
accounting change $ 538,066 $ 526,822 $ 433,202 $ 306,592 $ 213,826
Weighted average common
shares for diluted earnings
per share calculation 289,196,228 317,790,764 334,647,950 349,612,184 350,650,100
Diluted earnings per share from
continuing operations before
extraordinary item and cumulative
effect of accounting change $1.86 $1.66 $1.29 $.88 $.61
Cash dividends declared per share $ .16 $ .14 $ .12 $.10 $.07
B A L A N C E S H E E T D ATA :
Cash and cash equivalents $ 132,535 $ 371,759 $ 461,244 $ 404,369 $ 474,732
Working capital 493,188 513,376 629,247 622,240 588,868
Total assets 2,932,283 2,804,963 2,747,846 2,609,632 2,506,761
Capital expenditures 257,005 238,569 207,742 192,382 119,153
Long-term debt 319,372 319,367 220,344 221,024 244,410
Shareholders’ equity 1,218,712 1,119,228 1,220,656 1,164,092 1,127,186
O T H E R F I N A N C I A L D ATA :
After-tax return on average
shareholders’ equity 46.0% 45.0% 36.3% 26.8% 22.6%
Total debt as a percentage
of total capitalization (1) 22.7% 27.3% 15.3% 17.3% 19.4%
S T O R E S I N O P E R AT I O N AT Y E A R - E N D :
T.J. Maxx 661 632 604 580 578
Marshalls 535 505 475 461 454
Winners 117 100 87 76 65
T.K. Maxx 74 54 39 31 18
HomeGoods 81 51 35 23 21
A.J. Wright 25 15 6 – –
Total 1,493 1,357 1,246 1,171 1,136
( 1 ) To t a l c a p i t a l i z a t i o n i n c l u d e s s h a re h o l d e r s ’ e q u i t y a n d s h o r t a n d l o n g - t e r m d e b t , i n c l u d i n g c u r re n t i n s t a l l m e n t s .
17
2. T H E T J X C O M PA N I E S , I N C .
Consolidated Statements of Income
F i s c a l Ye a r E n d e d
January 27, January 29, January 30,
D o l l a r s I n T h o u s a n d s E x c e p t P e r S h a re A m o u n t s 2001 2000 1999
Net sales $9,579,006 $8,795,347 $7,949,101
Cost of sales, including buying and occupancy costs 7,188,124 6,579,400 5,957,415
Selling, general and administrative expenses 1,503,036 1,354,665 1,285,988
Interest expense, net 22,904 7,345 1,686
Income from continuing operations before income taxes
and cumulative effect of accounting change 864,942 853,937 704,012
Provision for income taxes 326,876 327,115 270,810
Income from continuing operations before
cumulative effect of accounting change 538,066 526,822 433,202
(Loss) from discontinued operations, net of income taxes – – (9,048)
Income before cumulative effect of accounting change 538,066 526,822 424,154
Cumulative effect of accounting change, net of income taxes – (5,154) –
Net income 538,066 521,668 424,154
Preferred stock dividends – – 3,523
Net income available to common shareholders $ 538,066 $ 521,668 $ 420,631
BASIC EARNINGS PER SHARE:
Income from continuing operations before
cumulative effect of accounting change $1.87 $1.67 $1.35
Net income $1.87 $1.66 $1.32
Weighted average common shares — basic 287,440,637 314,577,145 318,073,081
DILUTED EARNINGS PER SHARE:
Income from continuing operations before
cumulative effect of accounting change $1.86 $1.66 $1.29
Net income $1.86 $1.64 $1.27
Weighted average common shares — diluted 289,196,228 317,790,764 334,647,950
Cash dividends declared per share $ .16 $ .14 $ .12
T h e a c c o m p a n y i n g n o t e s a re a n i n t e g r a l p a r t o f t h e f i n a n c i a l s t a t e m e n t s .
18
3. T H E T J X C O M PA N I E S , I N C .
Consolidated Balance Sheets
January 27, January 29,
In Thousands 2001 2000
ASSETS
Current assets:
Cash and cash equivalents $ 132,535 $ 371,759
Accounts receivable 61,845 55,461
Merchandise inventories 1,452,877 1,229,587
Prepaid expenses and other current assets 74,690 43,758
Total current assets 1,721,947 1,700,565
Property at cost:
Land and buildings 133,714 116,005
Leasehold costs and improvements 704,011 622,962
Furniture, fixtures and equipment 984,848 849,932
1,822,573 1,588,899
Less accumulated depreciation and amortization 914,590 754,314
907,983 834,585
Other assets 69,976 55,826
Deferred income taxes, net 47,391 23,143
Goodwill and tradename, net of amortization 184,986 190,844
Total Assets $2,932,283 $2,804,963
LIABILITIES
Current liabilities:
Current installments of long-term debt $ 73 $ 100,359
Short-term debt 39,000 –
Accounts payable 645,672 615,671
Accrued expenses and other current liabilities 544,014 471,159
Total current liabilities 1,228,759 1,187,189
Other long-term liabilities 165,440 179,179
Long-term debt, exclusive of current installments 319,372 319,367
Commitments and contingencies – –
SHAREHOLDERS’ EQUITY
Common stock, authorized 1,200,000,000 shares, par value $1,
issued and outstanding 280,378,675 and 299,979,363 shares, respectively 280,379 299,979
Additional paid-in capital – –
Accumulated other comprehensive income (loss) (3,288) (1,433)
Retained earnings 941,621 820,682
Total shareholders’ equity 1,218,712 1,119,228
Total Liabilities and Shareholders’ Equity $2,932,283 $2,804,963
T h e a c c o m p a n y i n g n o t e s a re a n i n t e g r a l p a r t o f t h e f i n a n c i a l s t a t e m e n t s .
19
4. T H E T J X C O M PA N I E S , I N C .
Consolidated Statements of Cash Flows
F i s c a l Ye a r E n d e d
January 27, January 29, January 30,
In Thousands 2001 2000 1999
C A S H F L O W S F R O M O P E R AT I N G A C T I V I T I E S :
Net income $ 538,066 $ 521,668 $ 424,154
Adjustments to reconcile net income to net cash
provided by operating activities:
Loss from discontinued operations – – 9,048
Cumulative effect of accounting change – 5,154 –
Depreciation and amortization 175,781 160,466 136,469
Property disposals and impairments 4,559 4,624 6,037
Tax benefit of employee stock options 15,941 11,736 13,821
Deferred income tax (benefit) provision (24,235) 1,790 (19,902)
Changes in assets and liabilities:
(Increase) in accounts receivable (6,501) (8,137) (6,639)
(Increase) decrease in merchandise inventories (232,031) (26,856) 2,340
(Increase) in prepaid expenses and other current assets (12,083) (15,519) (1,130)
Increase (decrease) in accounts payable 34,158 (2,747) 35,528
Increase (decrease) in accrued expenses
and other liabilities 69,134 (35,673) 49,174
Other, net (6,026) (21,282) (6,451)
Net cash provided by operating activities 556,763 595,224 642,449
CASH FLOWS FROM INVESTING ACTIVITIES:
Property additions (257,005) (238,569) (207,742)
Issuance of note receivable (23,100) (5,848) –
Proceeds from sale of other assets 9,183 – 9,421
Net cash (used in) investing activities (270,922) (244,417) (198,321)
CASH FLOWS FROM FINANCING ACTIVITIES:
Proceeds from borrowings of short-term debt, net 39,000 – –
Proceeds from borrowings of long-term debt – 198,060 –
Principal payments on long-term debt (100,203) (695) (23,360)
Proceeds from sale and issuance of common stock, net 26,101 9,312 13,942
Cash payments for repurchase of common stock (444,105) (604,560) (337,744)
Cash dividends paid (44,693) (42,739) (40,411)
Net cash (used in) financing activities (523,900) (440,622) (387,573)
Effect of exchange rate changes on cash (1,165) 330 320
Net (decrease) increase in cash and cash equivalents (239,224) (89,485) 56,875
Cash and cash equivalents at beginning of year 371,759 461,244 404,369
Cash and cash equivalents at end of year $ 132,535 $ 371,759 $ 461,244
T h e a c c o m p a n y i n g n o t e s a re a n i n t e g r a l p a r t o f t h e f i n a n c i a l s t a t e m e n t s .
20
5. T H E T J X C O M PA N I E S , I N C .
Consolidated Statements of Shareholders’ Equity
Accumulated
P re f e r re d Common Additional Other
Stock Stock, Par Paid-in Comprehensive Retained
In Thousands F a c e Va l u e Va l u e $ 1 Capital Income (Loss) Earnings To t a l
$ 72,730 $159,901 $198,736 $ 3,317 $729,408 $1,164,092
BALANCE, JANUARY 31, 1998
Comprehensive income:
Net income – – – – 424,154 424,154
Foreign currency translation – – – 152 – 152
Reclassification of prior unrealized gain on securities – – – (4,998) – (4,998)
Total comprehensive income 419,308
Cash dividends declared:
Preferred stock – – – – (3,523) (3,523)
Common stock – – – – (38,134) (38,134)
Conversion of Series E cumulative
convertible preferred stock into
common stock (72,730) 14,682 58,048 – – –
Common stock repurchased – (12,998) (187,859) – (149,462) (350,319)
Stock split, two–for–one – 158,954 (96,555) – (62,399) –
Issuance of common stock under stock
incentive plans and related tax benefits – 1,602 27,630 – – 29,232
– 322,141 – (1,529) 900,044 1,220,656
BALANCE, JANUARY 30, 1999
Comprehensive income:
Net income – – – – 521,668 521,668
Foreign currency translation – – – 229 – 229
Unrealized (loss) on securities – – – (133) – (133)
Total comprehensive income – – – – – 521,764
Cash dividends declared on common stock – – – – (43,716) (43,716)
Common stock repurchased – (23,578) (20,368) – (557,314) (601,260)
Issuance of common stock under stock
incentive plans and related tax benefits – 1,416 20,368 – – 21,784
– 299,979 – (1,433) 820,682 1,119,228
BALANCE, JANUARY 29, 2000
Comprehensive income:
Net income – – – – 538,066 538,066
Foreign currency translation – – – (313) – (313)
Minimum pension liability adjustment – – – (1,675) – (1,675)
Reclassification of prior unrealized loss on securities – – – 133 – 133
Total comprehensive income 536,211
Cash dividends declared on common stock – – – – (45,266) (45,266)
Common stock repurchased – (22,233) (40,736) – (371,861) (434,830)
Issuance of common stock under stock
incentive plans and related tax benefits – 2,633 40,736 – – 43,369
$ – $280,379 $ – $ (3,288) $941,621 $1,218,712
BALANCE, JANUARY 27, 2001
T h e a c c o m p a n y i n g n o t e s a re a n i n t e g r a l p a r t o f t h e f i n a n c i a l s t a t e m e n t s .
21
6. T H E T J X C O M PA N I E S , I N C .
Notes to Consolidated Financial Statements
SUMMARY OF ACCOUNTING POLICIES
The consolidated financial statements of The TJX Companies, Inc. (TJX) include the financial statements of all
B A S I S O F P R E S E N TAT I O N :
TJX’s wholly owned subsidiaries, including its foreign subsidiaries. All intercompany transactions have been eliminated in consolidation. The
notes pertain to continuing operations except where otherwise noted.
TJX’s fiscal year ends on the last Saturday in January. The fiscal years ended January 27, 2001, January 29, 2000 and
FISCAL YEAR:
January 30, 1999 each included 52 weeks.
The preparation of the financial statements, in conformity with generally accepted accounting principles, requires
U S E O F E S T I M AT E S :
management to make estimates and assumptions that affect the reported amounts of assets and liabilities, and disclosure of contin-
gent liabilities, at the date of the financial statements as well as the reported amounts of revenues and expenses during the reporting
period. Actual results could differ from those estimates.
TJX records revenue at the time of sale and delivery of merchandise to the customer, net of a reserve for
REVENUE RECOGNITION:
estimated returns.
TJX generally considers highly liquid investments with an initial
C A S H , C A S H E Q U I VA L E N T S A N D S H O R T – T E R M I N V E S T M E N T S :
maturity of three months or less to be cash equivalents. TJX’s investments are primarily high–grade commercial paper, institutional
money market funds and time deposits with major banks. The fair value of cash equivalents approximates carrying value. During
September 1999, TJX received 693,537 common shares of Manulife Financial Corporation (Manulife). The shares reflect ownership
interest in the demutualized insurer due to policies held by TJX. These securities were recorded at market value upon receipt resulting
in an $8.5 million pre–tax gain. TJX classified the Manulife common shares as available–for–sale at January 29, 2000 and included
them in other current assets on the balance sheets. During fiscal 2001, TJX sold the Manulife shares for $9.2 million and realized a
gain of $722,000. In years prior to fiscal 2000, TJX also held available–for–sale marketable securities received as proceeds from the
sale of its former Chadwick’s of Boston division (see Note B). Available–for–sale securities are stated at fair market value with unreal-
ized gains or losses, net of income taxes, included as a component of accumulated other comprehensive income (loss). Realized gains
or losses are included in net income when the securities are sold or disposed of, resulting in a related reclassification adjustment to
accumulated other comprehensive income (loss).
Inventories are stated at the lower of cost or market. TJX uses the retail method for valuing inventories
MERCHANDISE INVENTORIES:
on the first–in first–out basis.
C A P I TA L I Z E D I N T E R E S T :
TJX capitalizes interest on borrowings during the active construction period of major capital projects.
Capitalized interest is added to the cost of the related assets. TJX capitalized interest of $311,000 in fiscal 2001 and $483,000 in
fiscal 1999. No interest was capitalized in fiscal 2000.
For financial reporting purposes, TJX provides for depreciation and amortization of property by
D E P R E C I AT I O N A N D A M O R T I Z AT I O N :
the use of the straight–line method over the estimated useful lives of the assets. Buildings are depreciated over 33 years, leasehold costs
and improvements are generally amortized over the lease term or their estimated useful life, whichever is shorter, and furniture, fixtures
and equipment are depreciated over 3 to 10 years. Depreciation and amortization expense for property was $169.1 million for fiscal year
2001, $154.2 million for fiscal year 2000 and $130.4 million for fiscal year 1999. Maintenance and repairs are charged to expense as
incurred. Significant costs incurred for internally developed software are capitalized and depreciated over three to five years. Upon retire-
ment or sale, the cost of disposed assets and the related accumulated depreciation are eliminated and any gain or loss is included in net
income. Debt discount and related issue expenses are amortized to interest expense over the lives of the related debt issues. Pre–opening
costs are expensed as incurred.
Goodwill is primarily the excess of the purchase price incurred over the carrying value of the minority
GOODWILL AND TRADENAME:
interest in TJX’s former 83%–owned subsidiary. The minority interest was acquired pursuant to TJX’s fiscal 1990 restructuring. In addition,
goodwill includes the excess of cost over the estimated fair market value of the net assets of Winners acquired by TJX in fiscal 1991. Good-
will, net of amortization, totaled $74.1 million and $76.8 million as of January 27, 2001 and January 29, 2000, respectively, and is being
22
7. T H E T J X C O M PA N I E S , I N C .
amortized over 40 years on a straight–line basis. Annual amortization of goodwill was $2.6 million in fiscal years 2001, 2000 and 1999.
Cumulative amortization as of January 27, 2001 and January 29, 2000 was $30.3 million and $27.7 million, respectively.
Tradename is the value assigned to the name “Marshalls” as a result of TJX’s acquisition of the Marshalls chain on November 17, 1995. The
value of the tradename was determined by the discounted present value of assumed after–tax royalty payments, offset by a reduction for its
pro–rata share of the total negative goodwill acquired. The final purchase price allocated to the tradename, including a reduction for a pro–rata
share of reserve adjustments recorded in fiscal 2000 and fiscal 1998, amounted to $128.3 million. The tradename is being amortized over 40
years. Amortization expense was $3.2 million for fiscal years 2001, 2000 and 1999. Cumulative amortization was $17.4 million as of January
27, 2001 and $14.2 million as of January 29, 2000.
TJX periodically reviews the value of its property and intangible assets in relation to the current
I M PA I R M E N T O F L O N G – L I V E D A S S E T S :
and expected operating results of the related business segments in order to assess whether there has been a permanent impairment of
their carrying values. An impairment exists when the undiscounted cash flow of an asset is less than the carrying cost of that asset. TJX
recorded an impairment loss of $3.1 million in fiscal 2001 as a component of the $6.3 million estimated cost of closing its three T.K. Maxx
stores in the Netherlands.
TJX expenses advertising costs as incurred. Advertising expense was $121.8 million for fiscal year 2001,
ADVERTISING COSTS:
$114.7 million for fiscal year 2000, and $106.4 million for fiscal year 1999.
All earnings per share amounts discussed refer to diluted earnings per share unless otherwise indicated. All
EARNINGS PER SHARE:
historical earnings per share amounts reflect the June 1998 two–for–one stock split.
F O R E I G N C U R R E N C Y T R A N S L A T I O N : TJX’s foreign assets and liabilities are translated at the year–end exchange rate. Activity of the
foreign operations that impact the statements of income and cash flows are translated at the average exchange rates prevailing during the
year. A large portion of TJX’s net investment in foreign operations is hedged with foreign currency swap agreements and forward contracts.
The translation adjustments associated with the foreign operations and the related hedging instruments are included in shareholders’ equity
as a component of accumulated other comprehensive income (loss). Cumulative foreign currency translation adjustments, net, included in
shareholders’ equity amounted to losses of $1.6 million as of January 27, 2001 and $1.3 million as of January 29, 2000.
During 1998, the Financial Accounting Standards Board (FASB) issued Statement of
N E W A C C O U N T I N G S TA N D A R D S ( U N A U D I T E D ) :
Financial Accounting Standards (SFAS) No. 133, “Accounting for Derivative Instruments and Hedging Activities.” This Statement, as
amended, established accounting and reporting standards for derivative instruments, including certain derivative instruments embedded
in other contracts, and for hedging activities. This Statement requires that an entity recognize all derivatives as either assets or liabilities
in the statements of financial position and measure those instruments at fair value. This Statement also requires that companies recog-
nize adjustments to the fair value of derivatives in earnings when they occur, if they do not qualify for hedge accounting. For derivatives
that qualify for hedge accounting, changes in the fair value of the derivatives can be recognized currently in earnings, along with an
offsetting adjustment against the basis of the underlying hedged item, or can be deferred in accumulated other comprehensive income.
This Statement will affect the accounting for TJX’s hedging contracts as described in Note D to the consolidated financial statements.
As described in Note D, TJX periodically enters into forward foreign currency exchange contracts to hedge certain merchandise purchase
commitments and to hedge its net investment in foreign subsidiaries. Through January 27, 2001, TJX applied hedge accounting to these
contracts. TJX adopted SFAS No. 133 at the beginning of its first quarter for fiscal 2002. Upon adoption of SFAS No. 133 TJX elected
not to apply the hedge accounting rules to its merchandise related contracts even though these contracts effectively function as an
economic hedge of the underlying exposure. Thus, the changes in fair value of the inventory related contracts will impact earnings in the
period of change. TJX will continue to apply hedge accounting on its net investment hedge contracts and changes in fair value of these
contracts will continue to be recorded in accumulated other comprehensive income.
In accordance with SFAS No. 133, the fair value of all of TJX’s hedge contracts amounted to a net asset of $10 million, most of which
are for the net investment hedge contracts. The carrying value of all its hedging contracts, before adoption, was $12 million and thus
TJX recorded a charge to accumulated other comprehensive income for the cumulative effect of an accounting change of $2 million
effective January 28, 2001.
Certain amounts in prior years’ financial statements have been reclassified for comparative purposes. Significant
R E C L A S S I F I C AT I O N S :
reclassifications include certain liabilities on the balance sheets and the cash flow presentation of the tax benefit from exercise of stock
options as well as the effect on cash of foreign currency exchange rate changes.
23
8. T H E T J X C O M PA N I E S , I N C .
A. C H A N G E IN ACCOUNTING PRINCIPLE
Effective January 31, 1999, TJX changed its method of accounting for layaway sales in compliance with Staff Accounting Bulletin
No. 101 “Revenue Recognition in Financial Statements,” issued by the Securities and Exchange Commission during the fourth
quarter of fiscal 2000. Under the new accounting method, TJX defers recognition of a layaway sale and its related profit to the
accounting period when the customer picks up layaway merchandise. The cumulative effect of this change for periods prior to
January 31, 1999 of $5.2 million (net of income taxes of $3.4 million), or $.02 per share, is shown as the cumulative effect of
accounting change in the consolidated statements of income. The accounting change has virtually no impact on annual sales and
earnings (before cumulative effect). However, due to the seasonal influences of the business, the accounting change results in a shift
of sales and earnings among quarterly periods.
B. D I S P O S I T I O N S AND ACQUISITIONS
TJX sold its former Chadwick’s division in fiscal 1997 to Brylane, Inc. As part of the proceeds
SALE OF CHADWICK’S OF BOSTON:
from the sale, TJX received a $20 million convertible note. During fiscal 1998, TJX converted a portion of the Brylane note into 352,908
shares of Brylane, Inc. common stock which it sold for $15.7 million. This sale resulted in an after–tax gain of $3.6 million. During fiscal
1999, the balance of the note was converted into shares of Brylane common stock. A portion of the shares were donated to TJX’s char-
itable foundation, and the remaining shares were sold. The net pre–tax impact of these transactions was immaterial. Pursuant to the
disposition, TJX agreed to purchase certain amounts of excess inventory from Chadwick’s. This arrangement has been extended
through fiscal 2002.
S A L E O F H I T O R M I S S : Effective September 30, 1995, TJX sold its Hit or Miss division to members of Hit or Miss management and
outside investors. TJX received $3.0 million in cash and a seven–year $10 million note with interest at 10%. During fiscal 1998, TJX forgave
a portion of this note and was released from certain obligations and guarantees which reduced the note to $5.5 million. During fiscal 1999,
TJX settled the note for $2.0 million, and the balance of $3.5 million was charged to selling, general and administrative expenses.
A C Q U I S I T I O N O F M A R S H A L L S : On November 17, 1995, TJX acquired Marshalls from Melville Corporation. TJX paid $424.3 million in
cash and $175 million in junior convertible preferred stock. The total purchase price of Marshalls, including acquisition costs of $6.7
million, was $606 million.
C. LONG–TERM DEBT AND CREDIT LINES
At January 27, 2001 and January 29, 2000, long–term debt, exclusive of current installments, consisted of the following:
January 27, January 29,
In Thousands Except Unamortized Debt Discount Amounts 2001 2000
Equipment notes, interest at 11.25% maturing December 30, 2001 $ – $ 73
General corporate debt:
Medium term notes, interest at 5.87% to 7.97%, $15 million maturing October 21, 2003 and
$5 million maturing September 20, 2004 20,000 20,000
7% unsecured notes, maturing June 15, 2005 (effective interest rate of 7.02% after reduction of
the unamortized debt discount of $61,000 and $75,000 in fiscal 2001 and 2000, respectively) 99,939 99,925
7.45% unsecured notes, maturing December 15, 2009 (effective interest rate of 7.50% after reduction
of unamortized debt discount of $567,000 and $631,000 in fiscal 2001 and 2000, respectively) 199,433 199,369
Total general corporate debt 319,372 319,294
Long–term debt, exclusive of current installments $319,372 $319,367
24
9. T H E T J X C O M PA N I E S , I N C .
The aggregate maturities of long–term debt, exclusive of current installments, at January 27, 2001 are as follows:
General
Corporate
In Thousands Debt
Fiscal Year
2003 $ –
2004 15,000
2005 5,000
2006 99,939
Later years 199,433
Aggregate maturities of long–term debt, exclusive of current installments $319,372
In December 1999, TJX issued $200 million of 7.45% ten–year notes. The proceeds were used for general corporate purposes,
including TJX’s ongoing stock repurchase program.
TJX periodically enters into financial instruments to manage its cost of borrowing. In December 1999, TJX entered into a rate–lock agree-
ment to hedge the underlying treasury rate of the $200 million ten–year notes, prior to their issuance. The cost of this agreement has been
deferred and is being amortized to interest expense over the term of the notes and results in an effective rate of 7.60% on the debt.
In September 1997, TJX entered into a five–year $500 million revolving credit facility. In addition, in July 2000, TJX entered into a $250
million, 364–day revolving credit agreement. The agreements have similar terms which include certain financial covenants requiring that TJX
maintain specified fixed charge coverage and leverage ratios. The revolving credit facilities are used as backup to TJX’s commercial paper
program. As of January 27, 2001, $711 million of the revolving credit facilities were available for use. Interest is payable on borrowings at
rates equal to or less than prime. The maximum amount of TJX’s U.S. short–term borrowings was $330 million in fiscal 2001 and $108
million in fiscal 2000, with no borrowings during fiscal 1999. The weighted average interest rate on TJX’s U.S. short–term borrowings was
6.82% in fiscal 2001 and 6.06% in fiscal 2000. TJX does not have any compensating balance requirements under these arrangements.
TJX also has C$40 million of credit lines for its Canadian subsidiary, all of which were available as of January 27, 2001. The maximum
amount outstanding under TJX’s Canadian credit lines was C$15.2 million during fiscal 2001, C$19.2 million in fiscal 2000 and C$15.6
million during fiscal 1999.
In February 2001, TJX raised gross proceeds of $347.6 million through the issuance of twenty–year zero coupon convertible
subordinated notes. See Note O to the consolidated financial statements for further information.
D. F I N A N C I A L INSTRUMENTS
TJX periodically enters into forward foreign currency exchange contracts to hedge firm U.S. dollar and Euro merchandise purchase
commitments made by its foreign subsidiaries. As of January 27, 2001, TJX had $26.6 million of such contracts outstanding for its
Canadian subsidiary and $5.6 million and ¤ 4.8 million Euro for its subsidiary in the United Kingdom. The contracts cover certain commit-
ments for the first quarter of fiscal 2002. Through January 27, 2001 gains and losses on such contracts were included as a component
of the item being hedged.
TJX also has entered into several foreign currency swap and forward contracts in both Canadian dollars and British pounds sterling.
Both the swap and forward agreements are accounted for as a hedge against TJX’s investment in its foreign subsidiaries. Foreign
exchange gains and losses on the agreements are recognized in shareholders’ equity, thereby offsetting translation adjustments asso-
ciated with TJX’s investment in its foreign subsidiaries.
The Canadian swap and forward agreements will require TJX to pay C$94.3 million in exchange for $65.9 million in U.S. currency
between January 2002 and January 2005. The British pounds sterling swap and forward agreements will require TJX to pay £75.0 million
between January 2002 and January 2003 in exchange for $117.5 million in U.S. currency.
The agreements contain rights of offset which minimize TJX’s exposure to credit loss in the event of nonperformance by one of the
counterparties. The interest rates payable on the foreign currency swap agreements are slightly higher than the interest rates receivable
on the currency exchanged, resulting in deferred interest costs which are being amortized to interest expense over the term of the related
agreements. The premium costs or discounts associated with the forward contracts are being amortized over the term of the related
agreements and are included with the gains or losses of the hedging instrument. The unamortized balance of the net deferred costs
was $1.5 million and $2.1 million as of January 27, 2001 and January 29, 2000, respectively.
The counterparties to the forward exchange contracts and swap agreements are major international financial institutions. TJX
periodically monitors its position and the credit ratings of the counterparties and does not anticipate losses resulting from the nonper-
formance of these institutions.
25
10. T H E T J X C O M PA N I E S , I N C .
The fair value of TJX’s long–term debt, including current installments, is estimated using discounted cash flow analysis based upon
TJX’s current incremental borrowing rates for similar types of borrowing arrangements. The fair value of long–term debt, including current
installments, at January 27, 2001 approximates the carrying value of $319.4 million. These estimates do not necessarily reflect certain
provisions or restrictions in the various debt agreements which might affect TJX’s ability to settle these obligations.
E. C O M M I T M E N T S
TJX is committed under long–term leases related to its continuing operations for the rental of real estate and fixtures and equipment.
Most of TJX’s leases are for a ten–year initial term with options to extend for one or more five–year periods. Certain Marshalls leases,
acquired in fiscal 1996, had remaining terms ranging up to twenty–five years. Leases for T.K. Maxx are generally for fifteen to twenty–five
years with ten–year kick–out options. Many of the leases contain escalation clauses and early termination penalties. In addition, TJX is
generally required to pay insurance, real estate taxes and other operating expenses including, in some cases, rentals based on a
percentage of sales.
Following is a schedule of future minimum lease payments for continuing operations as of January 27, 2001:
Capital Operating
In Thousands Leases Leases
Fiscal Year
2002 $ 2,794 $ 415,696
2003 3,726 391,925
2004 3,726 360,157
2005 3,726 324,268
2006 3,726 281,485
Later years 37,848 1,250,644
Total future minimum lease payments $55,546 $3,024,175
The capital lease commitments relate to a 283,000 square foot addition to TJX’s home office facility. Construction of the addition is in
progress, with completion currently scheduled for the spring of fiscal 2002. At the time rental payments are to commence, TJX will
recognize a capital lease asset and related obligation equal to the present value of the lease payments, of approximately $34 million.
The rental expense under operating leases for continuing operations amounted to $390.6 million, $352.6 million and $318.1 million
for fiscal years 2001, 2000 and 1999, respectively. The present value of TJX’s operating lease obligations approximates $2,147.6 million
as of January 27, 2001, including $265.6 million payable on operating lease obligations in fiscal 2002.
TJX had outstanding letters of credit in the amounts of $31.6 million as of January 27, 2001 and $37.6 million as of January 29, 2000.
Letters of credit are issued by TJX primarily for the purchase of inventory.
F. S T O C K C O M P E N S AT I O N P L A N S
In the following note, all references to historical awards, outstanding awards and availability of shares for future grants under TJX’s stock
incentive plans and related prices per share have been restated, for comparability purposes, for historical stock splits.
TJX has a stock incentive plan under which options and other stock awards may be granted to officers and key employees. The
Stock Incentive Plan, as amended, provides for the issuance of up to 42 million shares with 8.7 million shares available for future grants
as of January 27, 2001. TJX also has a Directors’ Stock Option Plan under which stock options are granted to directors who are not
otherwise employed by TJX. This plan provides for the issuance of up to 200,000 shares. There were 38,000 shares available for future
grants under this plan as of January 27, 2001.
Under its stock option plans, TJX has granted options for the purchase of common stock, generally within ten years from the grant
date at option prices of 100% of market price on the grant date. Most options outstanding are exercisable at various percentages
starting one year after the grant, and are exercisable in their entirety three years after the grant date. Options granted to directors
become fully exercisable one year after the date of grant.
26
11. T H E T J X C O M PA N I E S , I N C .
A summary of the status of TJX’s stock options and related Weighted Average Exercise Prices (WAEP), adjusted for historical stock
splits, is presented below (shares in thousands):
F i s c a l Ye a r E n d e d
January 27, 2001 January 29, 2000 January 30, 1999
S h a re s WA E P S h a re s WA E P S h a re s WA E P
Outstanding at beginning of year 11,832 $17.06 10,105 $12.04 10,507 $ 9.04
Granted 5,178 20.75 3,164 29.26 1,964 21.77
Exercised (2,724) 9.85 (1,275) 7.13 (2,215) 6.31
Canceled (249) 24.59 (162) 20.52 (151) 13.35
Outstanding at end of year 14,037 19.69 11,832 17.06 10,105 12.04
Options exercisable at end of year 5,880 $15.98 5,980 $10.77 4,796 $ 8.01
Virtually all canceled options are forfeitures. TJX realizes an income tax benefit from the exercise of stock options which results in a
decrease in current income taxes payable and an increase in additional paid–in capital. Such benefits amounted to $15.9 million, $11.7
million and $13.8 million for the fiscal years ended January 27, 2001, January 29, 2000 and January 30, 1999, respectively.
TJX has adopted the disclosure–only provisions of Statement of Financial Accounting Standards (SFAS) No. 123, “Accounting for
Stock–Based Compensation,” and continues to apply the provisions of Accounting Principles Board (APB) Opinion No. 25, “Accounting for
Stock Issued to Employees,” in accounting for compensation expense under its stock option plans. TJX grants options at fair market value
on the date of the grant; accordingly, no compensation expense has been recognized for the stock options issued during fiscal years 2001,
2000 or 1999. Compensation expense determined in accordance with SFAS No. 123, net of related income taxes, would have amounted
to $19.2 million, $12.9 million and $8.7 million for fiscal 2001, fiscal 2000 and fiscal 1999, respectively. Income from continuing operations,
net income and related earnings per share amounts, presented on a pro forma basis, are as follows:
U n a u d i t e d P ro F o r m a F i s c a l Ye a r E n d e d
January 27, January 29, January 30,
D o l l a r s I n T h o u s a n d s E x c e p t P e r S h a re A m o u n t s 2001 2000 1999
Income from continuing operations before
cumulative effect of accounting change $518,837 $513,862 $424,512
Per diluted share $ 1.79 $ 1.62 $ 1.27
Net income $518,837 $508,708 $415,464
Per diluted share $ 1.79 $ 1.60 $ 1.24
For purposes of applying the provisions of SFAS No. 123 for the pro forma calculations, the fair value of each option grant issued during
fiscal 2001, 2000 and 1999 is estimated on the date of grant using the Black–Scholes option pricing model with the following assump-
tions: dividend yield of 1% in each fiscal year, expected volatility of 48%, 46% and 40% in fiscal 2001, 2000 and 1999, respectively, a
risk–free interest rate of 5.2% in fiscal 2001, 6.4% in fiscal 2000 and 5.0% in fiscal 1999, and expected holding periods of six years in
all fiscal periods. The weighted average fair value of options granted during fiscal 2001, 2000 and 1999 was $10.07, $14.38 and $9.28
per share, respectively.
The effects of applying SFAS No. 123 in this pro forma disclosure are not indicative of future amounts. SFAS No. 123 does not apply
to awards prior to 1995 and additional awards in future years are anticipated.
The following table summarizes information about stock options outstanding as of January 27, 2001 (shares in thousands):
Options Outstanding O p t i o n s E x e rc i s a b l e
We i g h t e d We i g h t e d We i g h t e d
Av e r a g e Av e r a g e Av e r a g e
Range of Remaining E x e rc i s e E x e rc i s e
E x e rc i s e P r i c e s S h a re s Contract Life Price S h a re s Price
$ 2.5625 – $ 6.3125 652 3.4 Years $ 4.71 652 $ 4.71
$ 6.3126 – $10.6875 1,661 5.9 Years 9.90 1,661 9.90
$10.6876 – $14.4688 1,973 6.5 Years 13.85 1,473 14.45
$14.4689 – $21.7500 6,729 9.1 Years 20.98 1,065 21.75
$21.7501 – $30.5000 3,022 8.6 Years 29.22 1,029 29.16
Total 14,037 8.0 Years $19.69 5,880 $15.98
27
12. T H E T J X C O M PA N I E S , I N C .
TJX was subject to income statement charges for changes in the fair market value of its common stock due to a special executive
deferred compensation award, granted in fiscal 1998, that was initially denominated in shares of TJX common stock. TJX recorded
compensation expense of $1.1 million and $6.3 million in fiscal 2000 and 1999, respectively, due to the increase in market value of the
shares of TJX stock from date of grant. During fiscal 2000 and 1999, all of the shares were denominated into other investments. TJX
separately transferred funds to a trust in an amount equal to the value of the new investment elections at the time such elections were
made by the executive. The trust assets are included in other current assets on the balance sheet as of January 27, 2001 and in other
assets for all prior periods. The trust assets are invested in a manner that matches the elections made by the executive. Thus, deferred
compensation adjustments due to the change in the executive’s deferred compensation account are offset by similar amounts due to
gains or losses on the trust assets. TJX anticipates that the assets will be distributed to the executive in fiscal 2002 in settlement of the
deferred obligation.
TJX has also issued restricted stock and performance-based stock awards under the Stock Incentive Plan. Restricted stock awards
are issued at par value, or at no cost, and have restrictions which generally lapse over three years from date of grant. Performance-
based shares have restrictions that generally lapse over one to three years once specified criteria are met. The market value in excess
of cost is charged to income ratably over the period during which these awards vest. Such pre–tax charges amounted to $1.4 million,
$1.1 million and $619,000 in fiscal years 2001, 2000 and 1999, respectively. The market value of the awards is determined at date of
grant for restricted stock awards, and at the date shares are earned for performance-based awards.
There has been a combined total of 135,000 shares, 131,480 shares and 4,000 shares for deferred, restricted and performance-based awards
issued in the fiscal years ended January 2001, 2000 and 1999, respectively. There were 33,000 and 3,000 shares forfeited for the fiscal years ended
January 2001 and 2000, respectively. There were no shares forfeited during the fiscal year ended January 1999. The weighted average market
value per share of these stock awards at grant date was $29.60, $29.55 and $18.03 for fiscal 2001, 2000 and 1999, respectively.
During fiscal 1998, TJX created a deferred stock compensation plan for its outside directors replacing TJX’s retirement plan for direc-
tors, which was terminated. The deferred stock account of each director who had an accrued retirement benefit was credited with
deferred stock to compensate for the value of that benefit. Additional share awards valued at $10,000 are issued annually to each eligible
director. Currently, there are 23,026 deferred shares outstanding; actual shares will be issued at retirement. TJX has 92,029 shares held
in treasury from which such shares will be issued.
G. C A P I T A L STOCK AND EARNINGS PER SHARE
TJX distributed a two–for–one stock split, effected in the form of a 100% stock dividend, on June 25, 1998 to shareholders
C A P I TA L S T O C K :
of record on June 11, 1998, which resulted in the issuance of 158.9 million shares of common stock and corresponding decreases of $96.5
million in additional paid–in capital and $62.4 million in retained earnings. All historical earnings per share amounts have been restated to reflect
the two–for–one stock split. Reference to common stock activity before the distribution of the related stock split has not been restated unless
otherwise noted. All activity after the distribution date reflects the two–for–one stock split.
During fiscal 1999, 357,300 shares of the outstanding Series E cumulative convertible preferred stock, initially issued in fiscal 1996,
were voluntarily converted into 6.7 million shares of common stock. On November 18, 1998, the then remaining 370,000 shares of the
Series E preferred stock were mandatorily converted into 8.0 million shares of common stock in accordance with its terms. Inducement
fees of $130,000 were paid on the Series E voluntary conversion in fiscal 1999, and TJX recorded aggregate dividends, including induce-
ment fees, on its preferred stock of $3.5 million in fiscal 1999. The preferred dividends reduce net income in computing net income
available to common shareholders. As of January 27, 2001, TJX has authorization for the issuance of up to 5 million shares of preferred
stock, par value $1, with none issued or outstanding at January 27, 2001.
During fiscal 2001, TJX completed a $750 million stock repurchase program and announced a new multi–year, $1 billion stock
repurchase program. These stock repurchase programs followed two separate $250 million stock repurchase programs used by TJX
in fiscal 1999 and 1998. TJX has had cash expenditures, under all of its programs, of $444.1 million, $604.6 million and $337.7 million
in fiscal 2001, 2000 and 1999, respectively, funded primarily by excess cash generated from operations. The total common shares
repurchased and retired (adjusted for stock split) amounted to 22.2 million shares in fiscal 2001, 23.6 million in fiscal 2000 and 15.6
million in fiscal 1999. As of January 27, 2001 TJX has repurchased and retired 19.6 million shares of its common stock at a cost of
$381.6 million under the current $1 billion stock repurchase program.
28
13. T H E T J X C O M PA N I E S , I N C .
The following schedule presents the calculation of basic and diluted earnings per share for income from
EARNINGS PER SHARE:
continuing operations:
F i s c a l Ye a r E n d e d
January 27, January 29, January 30,
D o l l a r s I n T h o u s a n d s E x c e p t P e r S h a re A m o u n t s 2001 2000 1999
BASIC EARNINGS PER SHARE:
Income from continuing operations before
cumulative effect of accounting change $538,066 $526,822 $433,202
Less preferred stock dividends – – 3,523
Income from continuing operations before cumulative effect of
accounting change available to common shareholders $538,066 $526,822 $429,679
Weighted average common stock outstanding
for basic earnings per share calculation 287,440,637 314,577,145 318,073,081
Basic earnings per share $1.87 $1.67 $1.35
DILUTED EARNINGS PER SHARE:
Income from continuing operations before cumulative effect of
accounting change available to common shareholders $538,066 $526,822 $429,679
Add preferred stock dividends – – 3,523
Income from continuing operations before
cumulative effect of accounting change for diluted
earnings per share calculation $538,066 $526,822 $433,202
Weighted average common stock outstanding
for basic earnings per share calculation 287,440,637 314,577,145 318,073,081
Assumed conversion/exercise of:
Convertible preferred stock – – 10,914,354
Stock options and awards 1,755,591 3,213,619 5,660,515
Weighted average common shares for
diluted earnings per share calculation 289,196,228 317,790,764 334,647,950
Diluted earnings per share $1.86 $1.66 $1.29
The weighted average common shares for the diluted earnings per share calculation exclude the incremental effect related to
outstanding stock options whose exercise price is in excess of the average price of TJX’s common stock. Such options are excluded
because they would have an antidilutive affect. These options amounted to 4.6 million as of January 27, 2001 and 3.1 million as of
January 29, 2000. There were 28,000 antidilutive options excluded from the calculation at January 30, 1999.
H. I N C O M E TA X E S
The provision for income taxes includes the following:
F i s c a l Ye a r E n d e d
January 27, January 29, January 30,
In Thousands 2001 2000 1999
C U R R E N T:
Federal $272,075 $255,277 $231,811
State 51,217 49,836 45,117
Foreign 27,819 20,212 13,784
DEFERRED:
Federal (22,359) 3,885 (13,084)
State (2,269) 1,984 (2,306)
Foreign 393 (4,079) (4,512)
Provision for income taxes $326,876 $327,115 $270,810
29
14. T H E T J X C O M PA N I E S , I N C .
TJX had a net deferred tax asset as follows:
January 27, January 29,
In Thousands 2001 2000
D E F E R R E D TA X A S S E T S :
Loss on investment in foreign subsidiary $ 7,013 $ –
Foreign net operating loss carryforward 17,998 30,107
Reserve for discontinued operations 10,129 10,900
Reserve for closed store and restructuring costs 6,443 11,569
Pension, postretirement and employee benefits 53,487 46,468
Leases 19,455 15,596
Other 29,111 28,234
Valuation allowance (3,396) (15,678)
Total deferred tax assets 140,240 127,196
D E F E R R E D TA X L I A B I L I T I E S :
Property, plant and equipment 17,211 19,240
Safe harbor leases 16,274 24,450
Tradename 44,140 45,408
Other 15,224 14,955
Total deferred tax liabilities 92,849 104,053
Net deferred tax asset $ 47,391 $ 23,143
TJX has elected to repatriate the earnings of its Canadian subsidiary after fiscal 1998. The majority of the fiscal 2001, 2000 and 1999
earnings from its Canadian subsidiary were repatriated and deferred foreign tax credits have been provided for on the undistributed
portions for these years. Earnings prior to fiscal 1999 of its Canadian subsidiary and all the earnings of TJX’s other foreign subsidiaries
are indefinitely reinvested and no deferred taxes have been provided for on those earnings.
TJX has a United Kingdom net operating loss carryforward of approximately $39 million for both tax and financial reporting purposes.
TJX recognized a deferred tax benefit of $7.0 million in fiscal 2001 due to the anticipated utilization of the balance of T.K. Maxx’s net oper-
ating loss carryforward. The United Kingdom net operating loss does not expire under current tax law. Due to TJX’s decision to close its
Netherlands operation, TJX does not expect to be able to utilize net operating losses of that operation. TJX, however, did recognize U.S.
tax benefits associated with the write-off of its total investment in the Netherlands operation. TJX also has a Puerto Rico net operating loss
carryforward of approximately $16 million, for tax and financial reporting purposes, which was acquired in the Marshalls acquisition and
expires in fiscal years 2002 through 2003. TJX recognized a deferred tax asset of $8.0 million and $3.4 million, in fiscal years 2000 and
1999, respectively, for the estimated future utilization of the Puerto Rico net operating loss carryforward. In fiscal 2001 a portion of the
deferred tax asset was reversed due to lower than anticipated earnings of the Puerto Rico operations. The valuation allowance relates to
TJX’s Puerto Rico net operating losses that have not yet been recognized or are likely to expire. Additional utilization of these net operating
loss carryforwards is dependent upon the level of future earnings in Puerto Rico.
TJX’s worldwide effective income tax rate was 37.8% for the fiscal year ended January 27, 2001, 38.3% for the fiscal year ended
January 29, 2000, and 38.5% for the fiscal year ended January 30, 1999. The difference between the U.S. federal statutory income tax
rate and TJX’s worldwide effective income tax rate is reconciled below:
F i s c a l Ye a r E n d e d
January 27, January 29, January 30,
2001 2000 1999
U.S. federal statutory income tax rate 35.0% 35.0% 35.0%
Effective state income tax rate 4.0 4.2 4.1
Impact of foreign operations (1.0) (1.0) (.4)
All other (.2) .1 (.2)
Worldwide effective income tax rate 37.8% 38.3% 38.5%
30
15. T H E T J X C O M PA N I E S , I N C .
I. P E N S I O N PLANS AND OTHER RETIREMENT BENEFITS
TJX has a non–contributory defined benefit retirement plan covering the majority of its full–time U.S. employees. Employees who have
attained twenty–one years of age and have completed one year of service are covered under the plan. Benefits are based on compen-
sation earned in each year of service. TJX also has an unfunded supplemental retirement plan which covers key employees of TJX and
provides additional retirement benefits based on average compensation; and an unfunded postretirement medical plan which provides
limited postretirement medical and life insurance benefits to associates who participate in TJX’s retirement plan and who retire at age
fifty–five or older with ten or more years of service.
Presented below is financial information relating to TJX’s retirement plans for the fiscal years indicated:
Pension P o s t re t i re m e n t M e d i c a l
F i s c a l Ye a r E n d e d F i s c a l Ye a r E n d e d
January 27, January 29, January 27, January 29,
Dollars In Thousands 2001 2000 2001 2000
C H A N G E I N B E N E F I T O B L I G AT I O N :
Benefit obligation at beginning of year $140,010 $152,047 $18,529 $24,992
Service cost 10,734 11,781 1,353 1,366
Interest cost 11,560 10,768 1,624 1,430
Participants’ contributions – – 42 14
Amendments 1,080 – – –
Actuarial (gains) losses 22,564 (20,393) 4,376 (8,165)
Settlement (1,141) (7,434) – –
Benefits paid (6,616) (6,039) (1,162) (1,108)
Expenses paid (830) (720) – –
Benefit obligation at end of year $177,361 $140,010 $24,762 $18,529
CHANGE IN PLAN ASSETS:
Fair value of plan assets at beginning of year $140,191 $123,191 $ – $ –
Actual return on plan assets 1,665 15,024 – –
Employer contribution 15,532 8,735 1,120 1,094
Participants’ contributions – – 42 14
Benefits paid (6,616) (6,039) (1,162) (1,108)
Expenses paid (830) (720) – –
Fair value of plan assets at end of year $149,942 $140,191 $ – $ –
R E C O N C I L I AT I O N O F F U N D E D S TAT U S :
Benefit obligation at end of year $177,361 $140,010 $24,762 $18,529
Fair value of plan assets at end of year 149,942 140,191 – –
Funded status – excess (assets) obligations 27,419 (181) 24,762 18,529
Unrecognized transition obligation – 447 – –
Unrecognized prior service cost 218 685 946 1,278
Unrecognized actuarial (gains) losses 11,554 (21,282) 394 (4,167)
Net amount recognized $ 15,647 $ 19,969 $23,422 $21,418
A M O U N T R E C O G N I Z E D I N T H E S TAT E M E N T O F
FINANCIAL POSITION CONSISTS OF:
Net accrued liability $ 12,215 $ 19,969 $23,422 $21,418
Intangible asset 1,757 – – –
Reduction to accumulated other comprehensive income 1,675 – – –
Net amount recognized $ 15,647 $ 19,969 $23,422 $21,418
WEIGHTED AVERAGE ASSUMPTIONS:
Discount rate 7.41% 7.66% 7.50% 7.75%
Expected return on plan assets 9.00% 9.00% N/A N/A
Rate of compensation increase 4.00% 4.00% 4.00% 4.00%
31
16. T H E T J X C O M PA N I E S , I N C .
The projected benefit obligation and accumulated benefit obligation of TJX’s unfunded supplemental retirement plan was $23.8 million
and $18.2 million, respectively, as of January 27, 2001 and $18.6 million and $14.3 million, respectively, as of January 29, 2000. The
increase in the projected benefit obligation as of January 27, 2001 reflects actuarial losses due to a change in the assumptions regarding
mortality and a decrease in the discount rate for valuation purposes.
The portion of the net accrued liability attributable to TJX’s unfunded supplemental retirement plan amounted to $14.8 million at
January 27, 2001 and $14.0 million at January 29, 2000 and is included in other long-term liabilities on the balance sheet. The balance
of the net accrued liability is attributable to TJX’s non-contributory defined benefit retirement plan and is included in current assets as of
January 27, 2001 and in accrued expenses and other current liabilities as of January 29, 2000.
For purposes of measuring the postretirement medical plan, a 3.41% annual rate of increase in the per capita cost of covered health
care benefits was assumed and is gradually reduced to zero. The impact of medical inflation eventually diminishes because of the $3,000
per capita annual limit on medical benefits. An increase in the assumed health care cost trend rate of one percentage point for all future
years would increase the accumulated postretirement benefit obligation at January 27, 2001 by about $3,409,000 and the total of the
service cost and interest cost components of net periodic postretirement cost for fiscal 2001, by about $477,000. Similarly, decreasing
the trend rate by one percentage point for all future years would decrease the accumulated postretirement benefit obligation at January
27, 2001 by about $2,908,000 as well as the total of the service cost and interest cost components of net periodic postretirement cost
for fiscal 2001, by about $404,000.
Following are the components of net periodic benefit cost:
Pension P o s t re t i re m e n t M e d i c a l
F i s c a l Ye a r E n d e d F i s c a l Ye a r E n d e d
January 27, January 29, January 30, January 27, January 29, January 30,
In Thousands 2001 2000 1999 2001 2000 1999
Service cost $10,734 $11,781 $10,538 $1,353 $1,366 $1,405
Interest cost 11,560 10,768 9,647 1,624 1,430 1,610
Expected return on plan assets (12,783) (11,060) (9,991) – – –
Amortization of transition obligation 75 75 75 – – –
Amortization of prior service cost 164 87 87 332 332 338
Recognized actuarial (gains) losses (1,085) 415 2,702 (185) – 103
Net periodic benefit cost $ 8,665 $12,066 $13,058 $3,124 $3,128 $3,456
Net pension expense reflects amortization of unrecognized actuarial losses for the unfunded plan in fiscal 1999 and amortization of
unrecognized gains on the defined benefit plan in fiscal 2001. The change in assumption regarding mortality will increase the net
pension expense in future years.
During the fiscal year ended January 29, 2000, TJX and an executive officer entered into an agreement whereby the executive waived
his right to benefits under TJX’s nonqualified plan in exchange for TJX’s funding of a split–dollar life insurance policy. The exchange was
accounted for as a settlement and TJX incurred a $1.5 million settlement loss, which was primarily the recognition of a portion of the
deferred losses under the plan. During fiscal 2001, TJX entered into a similar arrangement with another executive who waived the right
to a portion of his supplemental retirement benefit in exchange for TJX’s funding of a split-dollar life insurance policy. TJX recognized a
settlement loss of $224,000 in fiscal 2001 due to this exchange. The benefit exchanges were designed so that the after–tax cash expen-
ditures by TJX on the split–dollar policies are substantially equivalent, on a present value basis, to the after–tax cash expenditures TJX
would have incurred under the nonqualified plan.
TJX also sponsors an employee savings plan under Section 401(k) of the Internal Revenue Code for all eligible U.S. employees.
Employees may contribute up to 15% of eligible pay. TJX matches employee contributions, up to 5% of eligible pay, at rates ranging
from 25% to 50% based upon the company’s performance. TJX contributed for all 401(k) plans $5.8 million in fiscal 2001, $6.2 million
in fiscal 2000 and $6.4 million in fiscal 1999.
In the fourth quarter of fiscal 1999, TJX established a nonqualified savings plan for certain U.S. employees. TJX matches employee
contributions at various rates which amounted to $163,000 in fiscal 2001, $464,000 in fiscal 2000 and $210,000 in fiscal 1999. TJX
transfers employee withholdings and the related company match to a separate trust designated to fund the future obligations. TJX
includes the trust assets in other assets on the balance sheets.
In addition to the plans described above, TJX also maintains retirement/deferred savings plans for all eligible associates at its foreign
subsidiaries. TJX contributed for these plans $1.2 million, $682,000 and $534,000 in fiscal years 2001, 2000 and 1999, respectively.
32