1. Aetna Inc.
The following is a summary of certain 2005 projected financial information and metrics provided on Aetna’s investor
conference call on July 28, 2005. This information is provided for reference only, and has not been updated. You should
consider the information to speak only as of its date of original publication. Aetna does not assume any responsibility to
update the information to reflect subsequent events. Please also refer to the Cautionary Statement below for additional
information regarding important risk factors that may affect the forward looking and other information.
You should read this information in conjunction with Aetna’s earnings press release issued July 28, 2005 and should
review the replay of the related investor call in full, since the press release provides further discussion of the Company’s
results, and the investor call provides important context for the forward looking information.
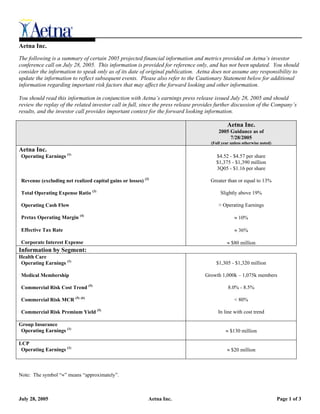
Aetna Inc.
2005 Guidance as of
7/28/2005
(Full year unless otherwise noted)
Aetna Inc.
Operating Earnings (1) $4.52 - $4.57 per share
$1,375 - $1,390 million
3Q05 - $1.16 per share
Revenue (excluding net realized capital gains or losses) (2) Greater than or equal to 13%
Total Operating Expense Ratio (3) Slightly above 19%
> Operating Earnings
Operating Cash Flow
Pretax Operating Margin (4) ≈ 10%
≈ 36%
Effective Tax Rate
≈ $80 million
Corporate Interest Expense
Information by Segment:
Health Care
Operating Earnings (1) $1,305 - $1,320 million
Growth 1,000k – 1,075k members
Medical Membership
Commercial Risk Cost Trend (5) 8.0% - 8.5%
Commercial Risk MCR (5) (6) < 80%
Commercial Risk Premium Yield (5) In line with cost trend
Group Insurance
Operating Earnings (1) ≈ $130 million
LCP
Operating Earnings (1) ≈ $20 million
Note: The symbol “≈” means “approximately”.
July 28, 2005 Aetna Inc. Page 1 of 3
2. Aetna Inc.
Footnotes
(1) Projected 2005 operating earnings and projected 2005 operating earnings per share exclude the following after tax net realized capital gains
(losses) reported by the Company for the six months ended June 30, 2005: Aetna Inc. $6.6 million; Health Care $3.8 million; Group Insurance
$3.3 million and Large Case Pensions $(0.5) million and also exclude any future net realized capital gains or losses from income from
continuing operations. The Company is not able to project the amount of future net realized capital gains or losses and cannot therefore
reconcile projected 2005 operating earnings to projected income from continuing operations or reconcile to a projected change in income from
continuing operations. Although the excluded items may recur, management believes that operating earnings and operating earnings per share
provide a useful comparison of its underlying business performance from period to period. Net realized capital gains and losses arise from
various types of transactions in the course of managing a portfolio of assets that support the payment of liabilities, but these transactions do not
directly relate to the underwriting or servicing of products for customers and are not directly related to the core performance of Aetna’s
business operations. In addition, management uses operating earnings to assess business performance and to make decisions regarding its
operations and allocation of resources among its businesses.
Projected full year 2005 operating earnings and projected full year 2005 operating earnings per share for Aetna Inc. and Large Case Pensions
exclude the $43.4 million after tax reduction of reserves for anticipated future losses on discontinued products, included as an other item by the
Company for second quarter 2005. This represents a reduction of reserves previously established for certain products no longer offered by the
Company and does not benefit ongoing business operations.
Projected full year 2005 operating earnings and projected full year 2005 operating earnings per share for Aetna Inc. and the Health Care
segment exclude favorable development of prior period health care costs estimates of approximately $133 million pretax (approximately $84
million after tax), which were included in the results reported for first quarter 2005 and favorable development of prior period health care costs
estimates of approximately $55 million pretax (approximately $35 million after tax), which were included in the results reported for second
quarter 2005 and any further prior period reserve development. Projected operating earnings per share reflect the effect of the March 11, 2005
two-for-one stock split. Projected operating earnings per share for 2005 assume approximately 304 million weighted average diluted shares.
(2) Revenue excludes net realized capital gains or losses (pretax), which are included in reported GAAP revenue. Full year 2004 revenue of
$19.8 billion excludes net realized capital gains of $70.8 million; GAAP revenue was $19.9 billion. The projected full year 2005 revenue
excludes net realized capital gains (pretax) of $10.1 million reported by the Company for the six months ending June 30, 2005. The Company
cannot reconcile the projected 2005 revenue to GAAP revenue as it cannot project net realized capital gains or losses. The Company may from
time to time project revenue for the segments which cannot be reconciled for the same reasons.
(3) The operating expense ratio is calculated by dividing operating expenses by total revenue excluding net realized capital gains or losses. The
Company cannot reconcile the projected operating expense ratio to a comparable GAAP measure, as it cannot project net realized capital gains
or losses.
(4) Pretax operating margins are calculated by dividing pretax operating earnings, excluding net realized capital gains or losses, interest
expense and amortization of other acquired intangible assets by total revenue excluding net realized capital gains or losses. The projected
2005 pretax operating margin also excludes the favorable development of prior period health care cost estimates reported for first quarter and
second quarter 2005 (refer to Footnote 1) and any further prior period reserve development. The Company cannot reconcile the projected
pretax operating margins to a comparable GAAP measure, as it cannot project net realized capital gains or losses.
(5) Commercial Risk includes all medical and dental risk products except Medicare and Medicaid. Risk includes all medical and dental
products for which the Company assumes all or a majority of health care cost, utilization, or other risk.
(6) The projected 2005 MCR excludes the 2005 favorable development of prior period health care cost estimates reported for first quarter and
second quarter 2005 (refer to Footnote 1) and any further prior period reserve development, which the Company cannot project.
ADDITIONAL INFORMATION; CAUTIONARY STATEMENT - The 2005 information in this document is forward looking. Forward-
looking information is based on management's estimates, assumptions and projections, and is subject to significant uncertainties and other
factors, many of which are beyond Aetna's control. Important risk factors could cause actual future results and other future events to differ
materially from those currently estimated by management. Those risk factors include, but are not limited to: unanticipated increases in medical
costs (including increased medical utilization, increased pharmacy costs, increases resulting from unfavorable changes in contracting or re-
contracting with providers, changes in membership mix to lower-premium or higher-cost products or membership-adverse selection; as well as
changes in medical cost estimates due to the necessary extensive judgment that is used in the medical cost estimation process, the considerable
variability inherent in such estimates, and the sensitivity of such estimates to changes in medical claims payment patterns and changes in
medical cost trends); decreases in membership or failure to achieve desired membership growth due to significant competition or other factors;
increases in medical costs or Group Insurance claims resulting from any acts of terrorism or otherwise; the ability to reduce administrative
expenses while maintaining targeted levels of service and operating performance, and to improve relations with providers while taking actions
July 28, 2005 Aetna Inc. Page 2 of 3
3. Aetna Inc.
to reduce medical costs; the ability to successfully implement Aetna's operating model to a projected growing membership base and to
successfully implement multiple strategic and operational initiatives simultaneously; lower levels of investment income from continued low
interest rates; adverse government regulation (including legislative proposals eliminating or reducing ERISA pre-emption of state laws that
would increase potential litigation exposure, and other proposals, such as patients' rights legislation, that would increase potential litigation
exposure or mandate coverage of certain health benefits); adverse pricing actions by government payors; changes in size, product mix and
medical cost experience of membership in key markets; our ability to integrate, simplify, and enhance our existing information technology
system and platform to keep pace with changing customer and regulatory needs; and the outcome of various litigation and regulatory matters,
including litigation and ongoing reviews of business practices by various regulatory authorities (including the current industry wide
investigation into insurance brokerage practices concerning broker compensation arrangements, bid quoting practices and potential antitrust
violations being conducted by the New York Attorney General, the Connecticut Attorney General, and others, and for which the Company has
received and may receive subpoenas, and may be subject to related litigation). For more discussion of important risk factors that may materially
affect Aetna, please see the risk factors contained in Aetna's 2004 Annual Report on Form 10-K, on file with the Securities and Exchange
Commission. You also should read Aetna's 2004 Annual Report on Form 10-K and Aetna's 2005 second quarter report on Form 10-Q when
filed with the Securities and Exchange Commission for a discussion of Aetna's historical results of operations and financial condition.
###
July 28, 2005 Aetna Inc. Page 3 of 3