Revisiting the Global Role of Tropical Forest Nations

This is a journal article written by Fitrian Ardiansyah for The Strategic Review (volume January-March 2012). The Strategic Review is the Indonesian Journal of Leadership, Policy and World Affairs with its editorial board led by Dr Hassan Wirajuda (Former Minister of Foreign Affairs) and its advisory board consists of Prof Juwono Sudarsono (Former Minister of Defense), Let Gen (Ret) Agus Widjojo (Executive Board in the Partnership for Governance Reform), Prof. John Thomas (Harvard Kennedy School of Government USA), Prof. Erhard Friedberg (Sciences Po France) and Prof Arne Westad (London School of Economics UK). Along with my article, there are other articles published in this edition including those written by Christine Lagarde (Managing Director of the IMF), Dr Dino Patti Djalal (The Ambassador of Indonesia to the US), Dr Muhammad Chatib Basri (the Vice Chairman of the National Economic Committee of the President of the Republic of Indonesia) and Sydney Jones (International Crisis Group). The complete journal can be found at http://www.sr-indonesia.com/

Recomendados
Recomendados
Más contenido relacionado
La actualidad más candente
La actualidad más candente (20)
Destacado
Similar a Revisiting the Global Role of Tropical Forest Nations
Similar a Revisiting the Global Role of Tropical Forest Nations (20)
Último
Último (20)
Revisiting the Global Role of Tropical Forest Nations
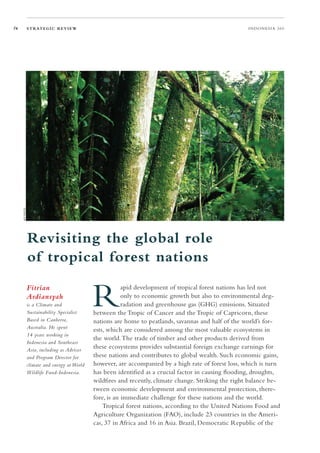
- 1. 56 S T R AT E G I C R E V I E W INDONESIA 360 AFP PHOTO Revisiting the global role of tropical forest nations R Fitrian apid development of tropical forest nations has led not Ardiansyah only to economic growth but also to environmental deg- is a Climate and radation and greenhouse gas (GHG) emissions. Situated Sustainability Specialist between the Tropic of Cancer and the Tropic of Capricorn, these Based in Canberra, nations are home to peatlands, savannas and half of the world’s for- Australia. He spent ests, which are considered among the most valuable ecosystems in 14 years working in the world. The trade of timber and other products derived from Indonesia and Southeast Asia, including as Adviser these ecosystems provides substantial foreign exchange earnings for and Program Director for these nations and contributes to global wealth. Such economic gains, climate and energy at World however, are accompanied by a high rate of forest loss, which is turn Wildlife Fund-Indonesia. has been identified as a crucial factor in causing flooding, droughts, wildfires and recently, climate change. Striking the right balance be- tween economic development and environmental protection, there- fore, is an immediate challenge for these nations and the world. Tropical forest nations, according to the United Nations Food and Agriculture Organization (FAO), include 23 countries in the Ameri- cas, 37 in Africa and 16 in Asia. Brazil, Democratic Republic of the
- 2. INDONESIA 360 JA N UA RY- M A R C H 2 0 1 2 / VO L 2 - N O 1 57 Congo (DRC) and Indonesia are the three in 2000 revealed that macroeconomic and largest tropical forest nations, each repre- regional policies implemented after the 1960s senting a different continent (Figure 1). The played a decisive role in driving forest ex- combined total estimated forest area of these ploitation and clearance. For instance, credit three nations in 2010, as reported by the and fiscal subsidies to agriculture, supported International Tropical Timber Organization by an expanded road network, pushed the (ITTO), is 771.5 million hectares – more agricultural frontier, particularly cattle ranch- Figure 1 : The Map of Brazil, Democratic Republic of the Congo and Indonesia Indonesia Brazil DRC Source: The Sustainable Trade Initiative (IDH), 2011 than half of the world’s tropical forests. ing, further into the Amazon, the world’s For decades, government policies and pri- largest tropical rainforest. In recent decades, vate investment in these three nations have however, multiple factors and actors have been viewed as the root causes of the ex- been considered as the driving forces. These ploitation of their forests and terrestrial include road, railway and other infrastruc- ecosystems. These policies and investments ture construction, government policies on have yielded considerable economic returns. colonization and subsidies for agro-pastoral Forests play an important role in the na- projects (mainly cattle ranching), agricul- tional economies of these three countries and tural modernization (associated with the provide livelihoods for local communities. diversification of output towards commer- In Brazil, a study written by Eustáquio J cial crops such as soybeans), timber extrac- Reis and Fernando A Blanco and published tion and mining, and charcoal production.
- 3. 58 S T R AT E G I C R E V I E W INDONESIA 360 Commercial exploitation of natural forests was considered a major driver of the Indonesian economy from 1980 to 1990. During this period, Indonesia secured substantial global market share in tropical timber products through its exports of logs, sawn timber, plywood (the world’s largest exporter), pulp, paper and other timber products. This development appears to have pre- by the International Institute for Environ- sented Brazil with unprecedented economic ment and Development, however, Brazil has benefits and a bigger role at the global level. been a net exporter of wood products since Large-scale cattle ranching, for example, has 1978 and the trend for exports is upward. continuously supplied the global beef mar- This report states that since 1981, exports ket, with Brazil being one of the world’s have outpaced imports by more than 150 largest exporters of beef. The Center for percent. The World Forest Institute Confer- International Forestry Research (CIFOR) ence held in Brazil in 1997 suggested that reported that between 1990 and 2001, the government fiscal incentives would drive market share of Europe’s processed meat a rapid growth of plantation forests feed- imports originating from Brazil rose from ing into the timber market, as well as pulp 40 percent to 74 percent, and by 2003 the and paper. In 2006, Brazilian forest product growth in Brazilian cattle production – 80 exports ranked the highest in South America, percent of which was in the Amazon – was with a value of $5.6 billion, according to the largely export-driven. In 2010, the Middle FAO’s Forest Products Annual Market Review. East region was Brazil’s major market, tak- ing 42 percent of its beef exports, as recorded by the Brazilian Exporters Association. Commercial crops such as soybeans A similar picture presents itself in Indone- sia. Under a heavily centralized govern- ment system between the 1960s and 1990s, also have become one of the most impor- the country experienced intensified forest tant contributors to the Brazilian economy. exploitation and clearance. A 2000 study writ- The total export revenues from soybeans in ten by Beni Nasendi identified rapid popula- the first eight months of 2011 amounted tion growth, increasing domestic and foreign to $17.8 billion, up from $17.1 billion for timber demand (shaping logging concession the whole of 2010. In the near future, Bra- policies) and growing demand for vegetable zil may surpass the United States as the oil (pushing agricultural expansion such as oil world’s leading exporter of soybeans, as palm), coupled with transmigration and infra- China-led demand increases – increas- structure development, as the driving forces. ing already high soybean prices – and a A paper published by the London School of new variety of soybean is developed. Economics and Massachusetts Institute of In the case of logging, exports constitute only Technology confirmed that a similar pattern a small percentage of Brazilian production for of development continued under Indonesia’s all wood products. According to a 2003 report current decentralized government system.
- 4. INDONESIA 360 JA N UA RY- M A R C H 2 0 1 2 / VO L 2 - N O 1 59 Commercial exploitation of natural forests expanded to other regions including Kalim- was considered a major driver of the Indo- antan and Papua. The market seems to have nesian economy from 1980 to 1990. Dur- clearly driven this oil palm boom, prompted ing this period, Indonesia secured substantial largely by the increase in food demand in global market share in tropical timber prod- Indonesia, India and China as well as the ucts through its exports of logs, sawn tim- plan to expand biofuel usage in Europe. This ber, plywood (the world’s largest exporter), increase in demand was reflected by a sharp pulp, paper and other timber products. By increase in price. In a 2010 article for the Law 1999, according to the Indonesian Minis- and Policy journal, John McCarthy and Zahari try of Forestry, the export value of forestry Zen showed that the price of crude palm products had reached $6 billion (about 16 oil had increased by 88 percent from $570 percent of the total value of non-oil and gas per ton at the beginning of 2007 to more exports), up from about $1.2 billion in 1985. than $1,440 per ton in early March 2008. By 2003, the reported value of Indonesian forestry commodity exports had grown to $6.6 billion, although the forestry sector’s proportional contribution to the country’s I n the Democratic Republic of the Congo (DRC), on the other hand, the rate of for- est exploitation and clearance is not as high gross domestic product decreased to 13.7 as in Brazil and Indonesia. This is likely due percent of total non-oil and gas exports. to the fact that most of the country’s forests Palm oil as a commercial crop emerged in are almost inaccessible, and because of politi- the late 1990s as one of the most significant cal and regulatory disincentives to invest in contributors to Indonesia’s economy outside the DRC, as argued by the World Resource oil, gas and mineral products. In 2009, Indo- Institute (WRI). The lower rate of forest nesia surpassed Malaysia to become the big- exploitation could also stem from the fact that gest producer of crude palm oil (CPO) in the the DRC has been focusing on the mining world, and today CPO is considered one of sector. The country holds the world’s larg- Indonesia’s fastest-growing export commodi- est deposits of cobalt and tantalum, as well as ties. According to figures from the Indonesian significant reserves of copper, gold, diamonds Ministry of Agriculture, production has soared and other minerals. Forest resources, there- from 105,900 metric tons in 1967 to 19.8 fore, serve mainly domestic purposes. Many million tons in 2010. Similarly, Indonesia’s people depend on the forests for their basic CPO exports and revenues have increased livelihoods. WRI estimated that 70 percent significantly over the last several decades, from of the DRC’s population used timber and 3.8 million tons (valued at $1 billion) in 1999 non-timber products for food, shelter and to 17.85 million tons ($10.03 billion) in 2010. artisan products in the 1990s. Fuelwood Indonesia also possesses the largest area of oil and charcoal are significant forest products palm plantations in the world, amounting to utilized inside the country. In 2000, accord- approximately 7.8 million hectares in 2010, ing to the Encyclopedia of the Nations, round- as documented by the Indonesian Ministry wood removals were estimated at 68.6 million of Agriculture. In the past, oil palm develop- cubic meters, about 95 percent of which was ment had been concentrated primarily on for fuel. Exports of forest products in the Sumatra Island. Today, the palm oil sector has same year amounted to just $11.1 million.
- 5. 60 S T R AT E G I C R E V I E W INDONESIA 360 The vast timber resources, nevertheless, countries (Figure 2). Brazil and Indonesia are have begun to attract commercial interest, also considered among the top producers of with companies eyeing the country’s 61 mil- vegetable oils, with soybean oil produced by lion hectares of exploitable wooded area. A Brazil and palm oil by Indonesia (Figure 3). 2008 report by the University of Gothenburg In addition, Brazil is among the world’s largest argued that logging and conversion of lands exporters of beef, while Indonesia is one of the top producers of paper (Figure 4 and 5). The economic boost and greater role in Figure 2 : Major Tropical Log Producers, 2004- global commodity markets enjoyed by tropi- 2006 (1,000 m3) Malaysia cal forest nations does come at a cost. The aforementioned developments have led to significant negative environmental impacts, Brazil the most obvious one being a considerable loss of forest cover. According to FAO’s forest Indonesia review, The Global Forest Resources Assessment 2010, around 13 million hectares of forests were converted for other uses or lost through India natural causes each year between 2000 and 2010, down from around 16 million hectares 0 Others per year during the 1990s. Satellite imagery 10,000 20,000 30,000 40,000 50,000 and assessments on the ground have revealed a rapid rate of deforestation (Figure 6) in Source: UNCTAD secretariat, based on data from the the tropics. FAO figures show that tropi- ITTO, 2011 (Note:The category “Others” includes cal deforestation rates increased 8.5 percent other ITTO member countries) from 2000 to 2005 when compared with the could become widespread if stability is en- 1990s, while loss of primary forests appears sured and infrastructure is developed. In 2002, to have expanded by 25 percent during the according to this report, more than 40 percent same period. The FAO also estimates that of the Congolese forests (43.5 million of a 10.4 million hectares of tropical forest were total 108 million hectares) were earmarked permanently destroyed each year in the pe- for industrial logging, locked up in 25-year riod from 2000 to 2005, an increase from the contracts awarded before and during the war. 1990s when around 10.16 million hectares Forestry development will further expand of forest were lost. Brazil, according to the when and if sizable foreign capital pours into FAO, lost an average of 3.1 million hectares the country and the government makes its of forest annually between 2000 and 2005 tax structure and export procedures more and 2.2 million hectares between 2005 and attractive. The economic picture of tropical 2010, as compared with 2.9 million hectares forest nations outlined above, particularly of per year in the 1990s. Deforestation rates for Brazil and Indonesia, shows that these na- Indonesia, meanwhile, were measured at 0.3 tions play a strategic role in global commod- (2000-2005) and 0.69 million hectares (2005- ity markets. ITTO lists Brazil and Indonesia 2010) respectively, as compared to 1.9 million among the top four tropical log-producing hectares per year between 1990 and 2000.
- 6. INDONESIA 360 JA N UA RY- M A R C H 2 0 1 2 / VO L 2 - N O 1 61 Figure 3 : World Vegetable Oil Production A lthough covering less than 10 percent of the earth’s land area, tropical forests and terrestrial ecosystems harbor the largest ter- restrial reservoir of biological diversity. More than half of known plant species grow in tropical forests. Tropical deforestation is hence responsible for significant destruction of the ecosystem and a loss in species. A 2007 study conducted by Ken Chomitz for the World Bank found that more than 800 million peo- ple depend on tropical forests for fuel, food or income. If deforestation continues at the current alarming rate, the livelihoods of these people are likely to be further eroded. Tropi- cal forests and peatlands also have a vital role to play in the fight against global warming, Share of major countries in soya meal export, in million tons being storehouses of vast amounts of carbon. The increases in deforestation and forest deg- radation have made tropical forests and peat- lands the third-largest source of greenhouse gas after coal and oil (Figure 7). A global ini- tiative to reduce GHG emissions from tropical deforestation and forest degradation, known globally as REDD+, is therefore a critical part of the global strategy to tackle climate change. Not only are measures to halt deforesta- tion and forest degradation needed to reduce carbon emissions and contribute to carbon sequestration, but they would also provide benefits to forest-dependent people and help maintain or enhance global biodiversity. The Stern Review on the Economics of Cli- mate Change of 2007 suggested that curbing deforestation is a highly cost-effective way of reducing greenhouse gas emissions, sug- gesting that “the opportunity cost of forest protection in eight countries responsible for 70 percent of emissions from land use could Source: USDA, 2011; Oil World in the Economist, be around $5 billion per annum initially, 2011; Al About Feed, 2011 although over time marginal costs would rise.” In another eminent study, Eliasch in 2008 calculated that the costs of reducing global
- 7. 62 S T R AT E G I C R E V I E W INDONESIA 360 Figure 4 : Market Overview Beef and Veal - Global market • Global production grew on average 1.1% p.a between 2005 and 2008. • Brazil is the 2nd largest world producer of beef and veal, and the largest exporter. • Brazil, Australia, and the USA and India account for 65% of global exports. Source: USDA in Credit Suisse, 2009 Figure 5 : Map of the World’s Largest Wood and Paper Exporters Source: World Mapper, 2011 (Note: Canada, Finland, Sweden and Indonesia export the most wood and paper in net US dollars. These territories export almost two-thirds of all net wood and paper exports.)
- 8. INDONESIA 360 JA N UA RY- M A R C H 2 0 1 2 / VO L 2 - N O 1 63 Figure 6 : The Global Map of Tropical Deforestation emissions to half of 1990 levels by the year tives part of the climate agreement. After 2050 could be lowered by 25 to 50 percent intense negotiations and following some by 2030 and by 20 to 40 percent by 2050, if fine-tuning, REDD+ was incorporated in reduced deforestation and forest degradation the Bali Action Plan of the UNFCCC at as well as afforestation/reforestation options COP-13 in Indonesia. REDD+ was also were included in emission-reduction schemes. recognized as one of the principal building The fundamental concept behind blocks at the 2010 COP in Cáncun, Mexico. REDD+ is to provide financial incentives Many tropical forest nations are hopeful of to tropical developing nations to make their progress with regards to tackling deforestation forests more valuable standing than cut down. and promoting economic development. With- Incentivizing options for keeping forests out the decisions taken at the UNFCCC, for intact is a particularly valuable concept, not instance, carbon storage and other environ- only in terms of providing opportunities to mental services provided by standing forests mitigate emissions, but also because forests would rarely be factored into the calculation. have the potential to serve as a net carbon Forest owners would not receive compensa- sink, rather than be the source of approxi- tion for supplying these services. Yet, provided mately one-fifth of greenhouse gas emis- their forests are near a road, railway or port, sions, as they are today. Collectively, tropical forest owners could often make hard cash by forest nations have been trying since the mining a forest for its timber. After logging, 11th Conference of Parties (COP-11) of the way to raise further income would be to the United Nations Framework Conven- convert the forest into pasture, plantations or tion on Climate Change (UNFCCC) in cropland. It is these economic realities that Montreal to make anti-deforestation incen- drive deforestation in many places of high
- 9. 64 S T R AT E G I C R E V I E W INDONESIA 360 FAO also estimates that 10.4 to reducing net deforestation to zero by 2015 in the Amazon region. If this policy succeeds, million hectares of tropical the total emissions reduction would reach forest were permanently 420 million tons of carbon between 2009 and destroyed each year in the 2014 (assuming a linear decline in emissions from deforestation between now and 2015). period from 2000 to 2005, an increase from the 1990s when around 10.16 million T here are some positive signs that de- forestation may be slowing. Having had the highest loss of forests in the 1990s, hectares of forest were lost. the rate of deforestation in the Brazilian Amazon declined by more than 60 per- conservation value and significantly contrib- cent between 2004 (a peak year) and 2007. ute to global GHG emissions. In principle, The Brazilian Ministry of Environment REDD+ aims to cut forest loss by changing attributes this decline to the implementa- the economics. To be able to do this, REDD+ tion of unprecedented policies such as: requires the involvement of different layers of government and various sectors and actors. • Establishment of protected areas in zones These sectors and actors are regulated under where agricultural fronts are rapidly different ministries and agencies (forestry, expanding (earlier they tended to be agriculture, energy and mineral resources, established in more isolated areas); etc) and layers of governments. These institu- • Improved monitoring of deforestation; tions are known to have issued overlapping • Actions on the ground to enforce laws policies on land use and land use changes against deforestation in municipali- across tropical forest nations, influencing the ties with the highest rates, with sup- whole economic structure of the nations. port from the federal police; Gradually, market mechanisms and other • Closing illegal sawmills; and financial streams would need to be estab- • Reduced access to credit by landowners lished to generate adequate financial sup- who don’t comply with the law regard- port for governments of these nations and ing forest cover on their properties. cash returns for those who maintain natural forests to supply carbon storage services. If The total rate of deforestation, however, done appropriately, these mechanisms would is still very high and the area of primary benefit the remaining large intact forests, forest – forests undisturbed by human activ- especially those adjacent to agricultural and ity – continues to decrease. Hence, to imple- other development frontiers. Individually, ment its policies successfully, Brazil ought nations like Brazil and Indonesia have taken to further strengthen its efforts to better proactive approaches to take advantage of conserve and manage remaining forests. Ad- opportunities provided by REDD+. In Brazil, ditional financial support such as from the such approaches have shaped government Norwegian government is a good starting policies and programs. The Brazilian Ministry point. This performance-based fund, which of Environment, for example, has committed amounts to up to $1 billion and aims at
- 10. INDONESIA 360 JA N UA RY- M A R C H 2 0 1 2 / VO L 2 - N O 1 65 reducing deforestation in the Amazon, can Figure 7 : Global GHG Emissions (2005) help strengthen the further development of Brazil’s systems for monitoring deforesta- tion. The government of Brazil, in particu- lar, still has a Herculean task to coordinate and synergize sectoral and state policies so they are in harmony with policies on defor- estation. Such coordination and synergy are critical because the policy of the Ministry of Environment may not have strong support from decisive sectors such as the ministries of Agriculture, Transport and Mines and Energy. Attributing recent declines in defor- estation solely to policies of the Brazilian Ministry of Environment is probably not accurate, and a strong correlation between deforestation and higher prices for com- modities such as beef and soy may increase forest destruction in the future. The situa- tion could worsen, especially when Brazil embarks on an ambitious program to expand infrastructure throughout the region, primar- ily involving transport (roads) and energy (hydro and fossil fuel exploration). As a result, a number of different policies have been is- sued to address this challenge, including: • Low Carbon Agriculture Plan of Brazil • National Plan on Climate Change (Decree 6.263) • National REDD Strategy for Brazil • Plan for Prevention and Control of De- forestation and Forest Fires in the Cerrado • Plan for Prevention and Control of Deforestation in the Amazon • Law No 2.308, October 22, 2010 (State of Acre) Source: Global GHG Emissions (2005) as quoted • National Policy on Climate Change by Conservation International; NRDC, 2008 (Federal law 12187/2009) • Law No 12.114, December 9, 2009
- 11. 66 S T R AT E G I C R E V I E W INDONESIA 360 In Indonesia, the situation is similar The forestry sector, to Brazil. For example, the importance of REDD+ appears to have motivated Presi- agriculture, mining and dent Susilo Bambang Yudhoyono, when infrastructure are the key he pledged his commitment to reduce the players in Indonesia, and country’s GHG emissions at the 2009 G20 Leaders Meeting in Pittsburgh. At this meet- therefore their involvement ing, the president stated that his government and coordination in was devising a policy to cut emissions by the REDD+ planning 26 percent by 2020 from “business as usual” levels. The president expressed confidence and implementation that, with international support, Indonesia process is crucial. could cut emissions by as much as 41 per- cent. He further stated that his administra- and move it from the preparation stage to tion was committed to changing the status launching pilot programs and, eventually, fully of Indonesia’s forests from a net-emitter implementing a national REDD+ strategy. To sector to a net-sink sector by 2030. To back further strengthen the Indonesian-Norwegian up his announcement, the following month partnership, the president announced that Yudhoyono and his cabinet committed to Indonesia would halt the granting of new formulating a five-year action plan to ad- concessions on peatlands and natural forests dress climate change and environmental for a period of two years, which had been degradation. More specifically, the president slated to begin in January 2011. However, emphasized sustainable forest management, only on May 20 2011, a year after the sign- action against illegal logging, the prevention ing of the agreement, did Yudhoyono issue of forest and land fires and the preservation of Presidential Instruction Number 10 of 2011 areas under forest protection (hutan lindung). regarding a two-year moratorium on new Inspired by the country’s pledges, the permits to clear primary forests and peatlands Norwegian government, as demonstrated with throughout Indonesia. Later in the year, two Brazil, agreed to help Indonesia to imple- other presidential decrees were issued, num- ment a national REDD+ program. A Letter ber 25 of 2011 regarding the formulation of of Intent was signed by both governments in a REDD+ task force, and number 61 of 2011 May 2010. Under this partnership, Norway outlining more than 70 self-funded govern- is expected to provide a grant of $1 billion ment programs as part of the national action to help Indonesia significantly reduce GHG plan to mitigate greenhouse gas emissions. emissions from deforestation, forest degrada- Similar to Brazil, Indonesia’s national tion and peatland conversion. According to REDD+ strategy can only be successful if the Center for International Forestry Re- the program actively involves the businesses search, this partnership is one of the largest- and various layers of government that are ever bilateral deals to combat environmental influential in land use change. The forestry destruction and climate change, and has sector (logging concessions, industrial timber created big opportunities as well as challenges plantations), agriculture (oil palm plantations), to accelerate the country’s REDD+ program mining and infrastructure are the key players
- 12. INDONESIA 360 JA N UA RY- M A R C H 2 0 1 2 / VO L 2 - N O 1 67 in Indonesia, and therefore their involvement will be allocated among the various actors/ and coordination in the REDD+ plan- stakeholders at different levels. At present, 40 ning and implementation process is crucial. REDD+ pilot or demonstration projects are However, a huge challenge remains in gain- reported to be operating across the country. ing support without detailing the program’s These can provide Indonesia and other tropi- potential options and benefits for each of the cal forest nations with research insights that sectors affected. There is also a big question will enrich REDD+ discussion at the global mark as to whether REDD+ incentives can level, such as the recent COP-17 negotiations compete with big investments that have thus in Durban, South Africa. At the sub-national far been responsible for changing Indo- level, various initiatives have been developed, nesia’s land use patterns. Failure to address such as the signing of an agreement among this issue may hinder the development and 10 governors in Sumatra and four national implementation of a national REDD+ strat- ministers on saving the ecosystems of Su- egy and consequently disrupt Indonesia’s matra, as well as the pledges of REDD+ in opportunity to reduce, and perhaps halt, the Papua, Aceh, Central Kalimantan and East destruction of its forests and peatlands. Kalimantan provinces made by their respec- Another big challenge is to formulate tive governors. These initiatives could change REDD+ policies and programs that seri- the economics of the nation by cutting forest ously reflect local aspirations and incorporate loss but still ensuring economic development. ongoing efforts at the local level. Because Overall, the collective and individual ac- Indonesia is a massive archipelagic nation tions embraced by tropical forest nations have with a decentralized system of government, set new precedents for them and strengthened local governments and people must be part of their already increasing role at the global level. the REDD+ process, particularly in design- Further progress on the new global chal- ing positive incentives, including financial lenge faced by these tropical forest nations is ones, and their distribution mechanisms. For definitely daunting. It is, however, imperative these mechanisms to be successful, further for the sake of the nations’ economies, the en- clarity is required regarding how incentives vironment and, most importantly, the people.