SlideShare una empresa de Scribd logo
1 de 18
Business Framework
Product Lifecycle Analysis
Product Lifecycle Analysis is an invaluable tool for
developing a robust product marketing strategy. This
document details a 5-phase approach to proper Product
Lifecycle Analysis and draws out key strategic insights
at each stage of the lifecycle. Additional concepts
discussed include Consumer Adoption Curve, Bass
Diffusion Model, Lifecycle-Performance Factor Matrix,
Strategic Positioning, and Substitution Analysis.
Innovators
(2.5%)
Early Adopters
(13.5%)
Early Majority
(34%)
Late Majority
(34%)
Laggards
(16%)
STAGE 1
INTRO
STAGE 2
GROWTH
STAGE 3
MATURITY
STAGE 4
DECLINE
Time / Adoption
Saturation/Sales
Compactor
Dishwasher
Color TV
Room A/C
Automatic
Washers
Freezers
Refrigerators
Ranges &
Ovens
B&W TV
Wringer
Find our other documents at http://flevy.com/seller/learnppt
3
Contents
• Overview
- Consumer Adoption Curve
- Product Profitability
- Product Lifecycle Stages
- Strategic Purposes
- Drawbacks
• Product Lifecycle Analysis
- Areas of Analysis
- 5 Phases
- Bass Diffusion Model
• Strategic Insights
- Stage-based Strategies
- Strategic Positioning Matrix
5
“CrossingtheChasm”
The Product Lifecycle is typically mapped against the Consumer Adoption
Curve to draw out key marketing and competitive insights
Product Lifecycle – Consumer Adoption Curve
It is useful to map all products within an industry or product category against the Adoption
Curve—to visualize dynamics among products (e.g. substitution, complements).
Innovators
(2.5%)
Early Adopters
(13.5%)
Early Majority
(34%)
Late Majority
(34%)
Laggards
(16%)
STAGE 1
INTRODUCTION
STAGE 2
GROWTH
STAGE 3
MATURITY
STAGE 4
DECLINE
Source: Hax and Majluf, 1984
7
The lifecycle concept is also closely related to Substitution Analysis
Relation to Substitution Analysis
• As a product moves through its lifecycle, the likelihood of customers switching to a
replacement—or substitute—product increases
• This trend is referred to as the Technology S-curve
- As the diffusion rate of new technology generally follows an S-shaped curve
• Since substitution estimates the adoption rate, the focus is only on the early stages of the
Product Lifecycle (i.e. Introduction, Growth, Early Maturity)
9
The appropriate strategy for a business depends on the stage of lifecycle
for the related industry
Product Lifecycle Stages
INTRODUCTION
Typified by slow
growth rate
• Heavy expenditures across the areas of advertising, selling, sampling,
promotion, distribution to stimulate awareness of and demand for the product
• Initial market awareness is minimal, so the focus is on educating the customer
to encourage a trial usage (net cash flow and profitability are negative during
this stage)
DETAILED CHARACTERTIZATION
GROWTH
Signaled by a significant
increase in sales growth
and profitability
• Expenditures remain relatively high, but the focus shifts toward building and
holding loyal customers (e.g. product variation increases as more competitors
enter market)
• The increase in volume sold more than compensates for the decrease in
pricing (driven by competitive pressures and experience curve effects),
causing cash flows and profitability to increase
PRIMARY CHARACTERIZATIONSTAGE
MATURITY
Defined by the
reduction in the rate of sales
growth and a further reduction
in unit costs
• As the growth rate of the market slows, weaker competitors are forced out—
we see larger players consolidating and acquiring smaller players, and excess
capacity drives down prices
• Customer preferences and expectations begin to stabilize, driving up
competitive rivalry as companies compete for customer loyalty and satisfaction
• By the end of the maturity stage, units sales, cash flows, and profitability all
decline
DECLINE
See a continuation of
decline in unit sales, cash
flows, and profitability
• Customers switch to new and/or better products—private labels take an
increasing market share
• Some competitors maintain profitability by being the focus, niche player with
specialized products—however, long term prospects for these small players
are unlikely
11
With all the strategic benefits of Product Lifecycle Analysis, it is important
to note this framework’s drawbacks
Drawbacks of Product Lifecycle Analysis
Lifecycle Analysis is based entirely
on time.
• This framework assumes all industries/products move through a predictable growth
pattern as time passes
• This is a limited point of view is and does no consider the structural economics in an
industry that might impact sales and profitability
- E.g., not all industries follow an S-shaped sales growth pattern—some industries
skip the Introduction stage, others skip Maturity and begin to decline immediately
(e.g. due to a disruptive technology)
- Companies can be impact the shape of the sales growth curve through product
innovation or strategic market repositioning
The actual timing of the lifecycle
stages different from industry-to-
industry and product-to-product.
• To use Lifecycle Analysis as a forecasting tool, we must make broad assumptions
regarding the stage of the product’s life
- Resultantly, sales forecasts are typically incorrect
- E.g., a slump in sales could be mistakenly be interpreted as that a product has
reached the Maturity or Decline stage, when other factors may be at play
From a strategic perspective, there
is no clear relation between the
nature of competition in an industry
and its current lifecycle stage.
• To illustrate this point, some industry remains highly concentrated throughout the
lifecycle—others main highly fragmented
• The nature of competition is more dependent on the underlying economics of the
business, rather than the lifecycle concept—and over-reliance on this framework may
provide misleading conclusions
DRAWBACK DETAILS
Lifecycle Analysis should be used as a starting point to developing strategic hypotheses—
underlying economics should be further analyzed before specific action is recommended.
13
Contents
• Overview
- Consumer Adoption Curve
- Product Profitability
- Product Lifecycle Stages
- Strategic Purposes
- Drawbacks
• Product Lifecycle Analysis
- Areas of Analysis
- 5 Phases
- Bass Diffusion Model
• Strategic Insights
- Stage-based Strategies
- Strategic Positioning Matrix
15
There are 5 phases to conducting Lifecycle Analysis
Product Lifecycle Analysis Approach
Define the industry/
scope of analysis
Determine the
level of lifecycle
performance
metrics
Identify the
lifecycle stage
Forecast sales
based on
lifecycle stage
Develop strategic
hypotheses and
action steps
1 2 3 4 5
• Be clear about your
industry, as this drives
the scope of your
analysis
• Determine the SIC code
to focus on
• Evaluate product
performance against 7
external factors
• Develop a Lifecycle-
Performance Factor
Matrix
• Validate the lifecycle
stage against generic
performance metrics
• Estimate sales by the
lifecycle stage
• Utilize the Bass
Diffusion Model for
new technology or
product innovation
• Draw strategic
recommendations
based on knowledge
of the select lifecycle
stage
17
Phase 2
Determine the level of lifecycle performance metrics
Business and product performance across seven external factors must be assessed.
 There are 7 external performance factors that must be evaluated, which are:
 Relative growth rate
 Market industry potential
 Breadth of the product lines
 Number of competitors
 Distribution/stability of market share among competitors
 Barriers to entry
 Technology innovation
 The levels of these metrics should be identified through focus interviews and secondary
research (e.g. trade association publications, analyst reports, annual reports, SEC filings,
business journals)
Define the industry/
scope of analysis
Determine the
level of lifecycle
perf. metrics
Identify the
lifecycle stage
Forecast sales
based on
lifecycle stage
Develop strategic
hypotheses and
action steps
1 2 3 4 5
19
This is a typical Lifecycle-Performance Factor Matrix
Lifecycle-Performance Factor Matrix
The matrix above is true to most industry and product lifecycles,
but many exceptions exist.
INTRODUCTION GROWTH MATURITY DECLINE
Relative Growth Rate Positive, increasing Positive, increasing Positive, decreasing Negative, increasing
Market Industry Potential Uncertain Strong Moderate Weak
Breadth of Product Lines Narrow Increasing
Wide, private label
emerging
Decreasing
Number of Competitors Few Increasing
Several, consolidation
occurring
Decreasing
Distribution/Stability of Market
Share
Unstable Stabilizing Stable, strong loyalty
Stable, customers
loyal
Barriers to Entry Low Increasing High High
Technology Innovation High Stable Stable Low
EXTERNAL PERFORMANCE FACTOR
LIFECYCLE STAGE
Source: Hax and Majluf, 1984
Define the industry/
scope of analysis
Determine the
level of lifecycle
perf. metrics
Identify the
lifecycle stage
Forecast sales
based on
lifecycle stage
Develop strategic
hypotheses and
action steps
1 2 3 4 5
21
In addition to validation, these
generic performance metrics can provide strategic insight
Generic Performance Metrics by Lifecycle Stage (2 of 2)
INTRODUCTION GROWTH MATURITY DECLINE
Foreign Trade
 Some exports  Significant exports
 Few imports
 Falling exports
 Significant imports
 No exports
 Significant imports
Competition
 Few competitors  Entry high, many competitors
 Increasing mergers
 Price competition
 Industry shake out
 Increase in private brands
 Exist
 Few competitors
Risk
 High risk  Growth covers risk taking
behavior
 Cyclicality
Margins and
Profits
 High prices and margins
 Low profits
 Price elasticity low
 High profits, fairly high prices
 Recession resistant
 High P/E ratios
 Good acquisition climate
 Falling prices, lower profits
and margins
 Lower dealer margins
 Increase market share
stability
 Poor acquisition climate,
tough to sell companies
 Low prices and margins
 Price may rise in late decline
Overall
Strategy
 Best period to increase share
 R&D and engineering are key
functions
 Practical to change price or
quality image
 Marketing is key function
 Bad time to increase share,
change price, or quality
image
 Competitive cost structure
key
 Marketing effectiveness is
key
 Cost management is key
PERFORMANCE
FACTOR
Source: Michael Porter, Competitive Strategy
Use these metrics and trends to develop strategic insight into the market dynamics.
Define the industry/
scope of analysis
Determine the
level of lifecycle
perf. metrics
Identify the
lifecycle stage
Forecast sales
based on
lifecycle stage
Develop strategic
hypotheses and
action steps
1 2 3 4 5
23
Apply product knowledge and
insight when using Product Lifecycle for forecasting
Implications on Sales Growth
 If we determine the product to be in the Growth stage of its lifecycle, the sales growth would be
expected to be grow at a slower rate
 We should recognize that the product will eventually reach maturity, at which point the sales growth
rate will begin to decline
 This insight should be incorporated into the sale forecasts
 For forecasting purposes, the timing of these stages and subsequent changes to the sales growth
rate should be estimated by reviewing the sales histories of comparable products or industries
Define the industry/
scope of analysis
Determine the
level of lifecycle
perf. metrics
Identify the
lifecycle stage
Forecast sales
based on
lifecycle stage
Develop strategic
hypotheses and
action steps
1 2 3 4 5
25
Here is the Bass Model Diffusion Equation
Bass Diffusion Model – Equation
The Bass Model approximate the
S-curve using the following adoption
equation:
Where:
Pt probability of a purchase at time t, given that no purchase has
yet been made
p coefficient of innovation, initial probability of adoption (from
comparable products)
q coefficient of imitation, measure of the ―word of mouth‖ effect
(from comparable products)
yt-1 cumulative sales prior to period t (i.e. including period t-1)
m market potential / potential sales volume (determined from
market research)
(yt-1/m) fraction of the Total Available Market (TAM) who have tried
the new technology
• Using this probability estimate, sales volume resulting from new adopters in any period would be equal to
the remaining potential sales multiplied by Pt
• Mathematically, sales volume in any period would be given by:
   S p m q p y
q
m
yt t t
     1 1
2
P p q
y
m
t
t
 






 1
Define the industry/
scope of analysis
Determine the
level of lifecycle
perf. metrics
Identify the
lifecycle stage
Forecast sales
based on
lifecycle stage
Develop strategic
hypotheses and
action steps
1 2 3 4 5
27
Phase 5
Develop strategic hypotheses and action steps
The results of the Lifecycle Analysis should be drive strategic hypotheses
 The lifecycle stage has implications for strategic and tactics selected by your organization
 These implications are based on generalizations across several industries
 They may be used to drive strategic hypotheses, but should be rigorously analyzed prior to
recommendation or implementation
Define the industry/
scope of analysis
Determine the
level of lifecycle
perf. metrics
Identify the
lifecycle stage
Forecast sales
based on
lifecycle stage
Develop strategic
hypotheses and
action steps
1 2 3 4 5
Stage specific strategies are
detailed in the next section
29
In the Introduction stage, get your pricing strategy right
Introduction Stage Strategies
INTRO GROWTH MATURITY DECLINE

Invest heavily in advertising, selling, sampling, promotion, and distribution to stimulate diffusion of the new
product to earn new customers
 Experiment with production processes to ensure continuous improvement and innovation
 Monitor competitors and adjust positioning to preempt competitive moves
 Pricing should receive special attention in the Introduction stage

There are two general pricing strategies in the Introduction stage: 1) set prices high to ―skim the market,‖ or 2) set
prices low to maximize ―market penetration‖ – decision on strategy depends on level of competition

By setting prices high, margins will be maximized—minimizing consumer surplus with innovator/early adopter
markets

Competitors will enter the market, pushing prices down, unless the incumbent has a cost advantage (e.g. economy
of scale, experience, investment required)
 If prices are set low, initial investment in the product may not be recovered

Although competitors will be less likely enter the market, a technological innovation may make the current product
obsolete

Thus, the pricing decision must be made by weighing the benefits and risks of potential market demand (size and
growth), competitive entry, and technological development
31
The Maturity stage leads to 3 strategic options
Maturity Stage Strategies
INTRO GROWTH MATURITY DECLINE

Based on the competitive dynamics in the industry, there are 3 strategies we should follow to extend the
profitability and duration of the Maturity stage
 Maintenance
 Employed when the threat from competitive entry or technology innovation are minimal
 Maintain the market position/profitability through advertising, promotion, and pricing
 Monitor competitive positioning, product development activities, and general business and macro-environmental trends

Defense
 Employed when new or current competitors are altering the status quo by changing their marketing mix (i.e. product,
pricing, promotion, placement)
 Adjust advertising and promotion, improve their product performance, modify pricing, and alter distribution spending to
maintain profitability

Innovation
 Employed to expand the market, fill customer needs, and preempt competition
 Develop product innovation through ―flankers‖ (E.g. new flavors, colors, sizes, new uses and users (e.g. Arm &
Hammer’s baking soda to deodorize refrigerator smells), or significant product innovation (e.g. cannibalization,
introduction of new models)
 In addition to these generic strategies, we should identify and exploit core competencies and competitive advantages to
survive the industry shake-out/massive consolidation at the end of the Maturity stage (e.g. brand equity, cost
advantages, channel dominance/partnerships)
33
Product Lifecycle Analysis can be extended and applied to the BCG
Growth-Share Matrix
Competitive Positioning Categories
The strategic actions implied by Lifecycle Analysis depend on both the current stage, as
well as the competitive positioning of the business or product in the market.
The competitive position of our business or product can be estimated based on a set of
qualitative and quantitative criteria for each the 6 competitive categories below:
DOMINANT
STRONG
FAVORABLE
TENABLE
WEAK
NONVIABLE
Results from quasi-monopoly or a strongly protective technical leadership
Can usually follow strategies of their choice, irrespective of competitors
Fragment industries, with no competitor clearly standing out
Can usually be maintained profitably through specialization in the niche
Can be too small to survive independently and remain profitable in the long-term,
given the competitive economics of the industry; can be a large firm suffering from
past mistakes
Market is too small, product is not differentiated, costs are too high to be competitive
1
Flevy (www.flevy.com) is the marketplace
for premium documents. These
documents can range from Business
Frameworks to Financial Models to
PowerPoint Templates.
Flevy was founded under the principle that
companies waste a lot of time and money
recreating the same foundational business
documents. Our vision is for Flevy to
become a comprehensive knowledge base
of business documents. All organizations,
from startups to large enterprises, can use
Flevy— whether it's to jumpstart projects, to
find reference or comparison materials, or
just to learn.
Contact Us
Please contact us with any questions you may have
about our company.
• General Inquiries
support@flevy.com
• Media/PR
press@flevy.com
• Billing
billing@flevy.com

Más contenido relacionado

Destacado

Product life cycle & marketing strategies
Product life cycle & marketing strategiesProduct life cycle & marketing strategies
Product life cycle & marketing strategiesAmar Ingale
 
Analyse De Cycle De Vie Life Cycle Analysis
Analyse De Cycle De Vie   Life Cycle AnalysisAnalyse De Cycle De Vie   Life Cycle Analysis
Analyse De Cycle De Vie Life Cycle AnalysisBenjamin Warr
 
What marketing strategies are appropriate at each stage ?
What marketing strategies are appropriate at each stage ?What marketing strategies are appropriate at each stage ?
What marketing strategies are appropriate at each stage ?Sameer Mathur
 
Life Cycle Analysis - Comparative analysis of tealight candles with Soy wax &...
Life Cycle Analysis - Comparative analysis of tealight candles with Soy wax &...Life Cycle Analysis - Comparative analysis of tealight candles with Soy wax &...
Life Cycle Analysis - Comparative analysis of tealight candles with Soy wax &...Meera Vaidya, LEED GA
 
2.2 life cycle design strategies cortesi 10-11
2.2 life cycle design strategies cortesi 10-112.2 life cycle design strategies cortesi 10-11
2.2 life cycle design strategies cortesi 10-11LeNS_slide
 
7.1 design exercise presentation 12 13 (35)
7.1 design exercise presentation 12 13 (35)7.1 design exercise presentation 12 13 (35)
7.1 design exercise presentation 12 13 (35)LeNS_slide
 
Systems for strategy comparison
Systems for strategy comparisonSystems for strategy comparison
Systems for strategy comparisonShashi Gurung
 
Chemistry, Energy & Climate Change
Chemistry, Energy & Climate ChangeChemistry, Energy & Climate Change
Chemistry, Energy & Climate ChangeGavin Harper
 
Energy & Chemistry Review
Energy & Chemistry ReviewEnergy & Chemistry Review
Energy & Chemistry ReviewEllena Bethea
 
14863 green chemistry
14863 green chemistry14863 green chemistry
14863 green chemistrystudent
 
Makerspaces in Libraries: Technology as catalyst for better learning, better ...
Makerspaces in Libraries: Technology as catalyst for better learning, better ...Makerspaces in Libraries: Technology as catalyst for better learning, better ...
Makerspaces in Libraries: Technology as catalyst for better learning, better ...Patrick "Tod" Colegrove
 
Life cycle assessment of bags final
Life cycle assessment of bags finalLife cycle assessment of bags final
Life cycle assessment of bags finalTejas Metaliya
 
Dr Richard Pike Chemistry, Energy and Climate Change
Dr Richard Pike   Chemistry, Energy and Climate ChangeDr Richard Pike   Chemistry, Energy and Climate Change
Dr Richard Pike Chemistry, Energy and Climate ChangeJon Edwards
 
Chapter17 section01 edit Flow of Heat Energy By Hamdy Karim.
Chapter17 section01 edit Flow of Heat Energy By Hamdy Karim.Chapter17 section01 edit Flow of Heat Energy By Hamdy Karim.
Chapter17 section01 edit Flow of Heat Energy By Hamdy Karim.Hamdy Karim
 
Lower Secondary Science-Source of Energy
Lower Secondary Science-Source of EnergyLower Secondary Science-Source of Energy
Lower Secondary Science-Source of EnergyMarioSonic54
 

Destacado (16)

Product life cycle & marketing strategies
Product life cycle & marketing strategiesProduct life cycle & marketing strategies
Product life cycle & marketing strategies
 
Analyse De Cycle De Vie Life Cycle Analysis
Analyse De Cycle De Vie   Life Cycle AnalysisAnalyse De Cycle De Vie   Life Cycle Analysis
Analyse De Cycle De Vie Life Cycle Analysis
 
What marketing strategies are appropriate at each stage ?
What marketing strategies are appropriate at each stage ?What marketing strategies are appropriate at each stage ?
What marketing strategies are appropriate at each stage ?
 
Life Cycle Analysis - Comparative analysis of tealight candles with Soy wax &...
Life Cycle Analysis - Comparative analysis of tealight candles with Soy wax &...Life Cycle Analysis - Comparative analysis of tealight candles with Soy wax &...
Life Cycle Analysis - Comparative analysis of tealight candles with Soy wax &...
 
2.2 life cycle design strategies cortesi 10-11
2.2 life cycle design strategies cortesi 10-112.2 life cycle design strategies cortesi 10-11
2.2 life cycle design strategies cortesi 10-11
 
7.1 design exercise presentation 12 13 (35)
7.1 design exercise presentation 12 13 (35)7.1 design exercise presentation 12 13 (35)
7.1 design exercise presentation 12 13 (35)
 
Systems for strategy comparison
Systems for strategy comparisonSystems for strategy comparison
Systems for strategy comparison
 
Chemistry, Energy & Climate Change
Chemistry, Energy & Climate ChangeChemistry, Energy & Climate Change
Chemistry, Energy & Climate Change
 
Energy & Chemistry Review
Energy & Chemistry ReviewEnergy & Chemistry Review
Energy & Chemistry Review
 
14863 green chemistry
14863 green chemistry14863 green chemistry
14863 green chemistry
 
Makerspaces in Libraries: Technology as catalyst for better learning, better ...
Makerspaces in Libraries: Technology as catalyst for better learning, better ...Makerspaces in Libraries: Technology as catalyst for better learning, better ...
Makerspaces in Libraries: Technology as catalyst for better learning, better ...
 
Life cycle assessment of bags final
Life cycle assessment of bags finalLife cycle assessment of bags final
Life cycle assessment of bags final
 
Dr Richard Pike Chemistry, Energy and Climate Change
Dr Richard Pike   Chemistry, Energy and Climate ChangeDr Richard Pike   Chemistry, Energy and Climate Change
Dr Richard Pike Chemistry, Energy and Climate Change
 
Chapter17 section01 edit Flow of Heat Energy By Hamdy Karim.
Chapter17 section01 edit Flow of Heat Energy By Hamdy Karim.Chapter17 section01 edit Flow of Heat Energy By Hamdy Karim.
Chapter17 section01 edit Flow of Heat Energy By Hamdy Karim.
 
Lower Secondary Science-Source of Energy
Lower Secondary Science-Source of EnergyLower Secondary Science-Source of Energy
Lower Secondary Science-Source of Energy
 
Energy
EnergyEnergy
Energy
 

Más de Flevy.com Best Practices

100 Case Studies on Strategy & Transformation.pdf
100 Case Studies on Strategy & Transformation.pdf100 Case Studies on Strategy & Transformation.pdf
100 Case Studies on Strategy & Transformation.pdfFlevy.com Best Practices
 
[Whitepaper] Business Transformation Success Factors
[Whitepaper] Business Transformation Success Factors[Whitepaper] Business Transformation Success Factors
[Whitepaper] Business Transformation Success FactorsFlevy.com Best Practices
 
[Whitepaper] 5 Dimensions of Employee Engagement Scorecard
[Whitepaper] 5 Dimensions of Employee Engagement Scorecard[Whitepaper] 5 Dimensions of Employee Engagement Scorecard
[Whitepaper] 5 Dimensions of Employee Engagement ScorecardFlevy.com Best Practices
 
[Whitepaper] Digital Transformation: Workforce Digitization
[Whitepaper] Digital Transformation: Workforce Digitization[Whitepaper] Digital Transformation: Workforce Digitization
[Whitepaper] Digital Transformation: Workforce DigitizationFlevy.com Best Practices
 
[Whitepaper] Strategic Human Resources: Evolution of Competition
[Whitepaper] Strategic Human Resources: Evolution of Competition[Whitepaper] Strategic Human Resources: Evolution of Competition
[Whitepaper] Strategic Human Resources: Evolution of CompetitionFlevy.com Best Practices
 
[Whitepaper] 8 Key Steps of Data Integration: Restructuring Redeployment Asse...
[Whitepaper] 8 Key Steps of Data Integration: Restructuring Redeployment Asse...[Whitepaper] 8 Key Steps of Data Integration: Restructuring Redeployment Asse...
[Whitepaper] 8 Key Steps of Data Integration: Restructuring Redeployment Asse...Flevy.com Best Practices
 
[Whitepaper] Strategy Classics: Value Disciplines Model
[Whitepaper] Strategy Classics: Value Disciplines Model[Whitepaper] Strategy Classics: Value Disciplines Model
[Whitepaper] Strategy Classics: Value Disciplines ModelFlevy.com Best Practices
 
[Whitepaper] The Definitive Guide to Strategic Planning: Here’s What You Need...
[Whitepaper] The Definitive Guide to Strategic Planning: Here’s What You Need...[Whitepaper] The Definitive Guide to Strategic Planning: Here’s What You Need...
[Whitepaper] The Definitive Guide to Strategic Planning: Here’s What You Need...Flevy.com Best Practices
 
[Whitepaper] The Definitive Introduction to Strategy Development and Strategy...
[Whitepaper] The Definitive Introduction to Strategy Development and Strategy...[Whitepaper] The Definitive Introduction to Strategy Development and Strategy...
[Whitepaper] The Definitive Introduction to Strategy Development and Strategy...Flevy.com Best Practices
 
[Whitepaper] The “Theory of Constraints:” What’s Limiting Your Organization?
[Whitepaper] The “Theory of Constraints:” What’s Limiting Your Organization?[Whitepaper] The “Theory of Constraints:” What’s Limiting Your Organization?
[Whitepaper] The “Theory of Constraints:” What’s Limiting Your Organization?Flevy.com Best Practices
 
[Whitepaper] Transportation Cost Reduction in Supply Chain Management
[Whitepaper] Transportation Cost Reduction in Supply Chain Management[Whitepaper] Transportation Cost Reduction in Supply Chain Management
[Whitepaper] Transportation Cost Reduction in Supply Chain ManagementFlevy.com Best Practices
 
[Whitepaper] A Great Leadership Experience: Dr. Rachid Yazami, Inventor of th...
[Whitepaper] A Great Leadership Experience: Dr. Rachid Yazami, Inventor of th...[Whitepaper] A Great Leadership Experience: Dr. Rachid Yazami, Inventor of th...
[Whitepaper] A Great Leadership Experience: Dr. Rachid Yazami, Inventor of th...Flevy.com Best Practices
 
[Whitepaper] Finding It Hard to Manage Conflict at the Workplace? Use the Tho...
[Whitepaper] Finding It Hard to Manage Conflict at the Workplace? Use the Tho...[Whitepaper] Finding It Hard to Manage Conflict at the Workplace? Use the Tho...
[Whitepaper] Finding It Hard to Manage Conflict at the Workplace? Use the Tho...Flevy.com Best Practices
 
[Whitepaper] Key Account Management: Handling Large Global Accounts the Right...
[Whitepaper] Key Account Management: Handling Large Global Accounts the Right...[Whitepaper] Key Account Management: Handling Large Global Accounts the Right...
[Whitepaper] Key Account Management: Handling Large Global Accounts the Right...Flevy.com Best Practices
 
[Whitepaper] Nudge Theory: An Effective Way to Transform Negative Behaviors
[Whitepaper] Nudge Theory: An Effective Way to Transform Negative Behaviors[Whitepaper] Nudge Theory: An Effective Way to Transform Negative Behaviors
[Whitepaper] Nudge Theory: An Effective Way to Transform Negative BehaviorsFlevy.com Best Practices
 
[Whitepaper] Business Model Innovation: Creation of Scalable Business Models ...
[Whitepaper] Business Model Innovation: Creation of Scalable Business Models ...[Whitepaper] Business Model Innovation: Creation of Scalable Business Models ...
[Whitepaper] Business Model Innovation: Creation of Scalable Business Models ...Flevy.com Best Practices
 
[Whitepaper] Shareholder Value Traps: How to Evade Them and Focus on Value Cr...
[Whitepaper] Shareholder Value Traps: How to Evade Them and Focus on Value Cr...[Whitepaper] Shareholder Value Traps: How to Evade Them and Focus on Value Cr...
[Whitepaper] Shareholder Value Traps: How to Evade Them and Focus on Value Cr...Flevy.com Best Practices
 

Más de Flevy.com Best Practices (20)

100 Case Studies on Strategy & Transformation.pdf
100 Case Studies on Strategy & Transformation.pdf100 Case Studies on Strategy & Transformation.pdf
100 Case Studies on Strategy & Transformation.pdf
 
Project Management for MBA (in French)
Project Management for MBA (in French)Project Management for MBA (in French)
Project Management for MBA (in French)
 
4 Stages of Disruption
4 Stages of Disruption4 Stages of Disruption
4 Stages of Disruption
 
Customer-centric Culture
Customer-centric CultureCustomer-centric Culture
Customer-centric Culture
 
[Whitepaper] Business Transformation Success Factors
[Whitepaper] Business Transformation Success Factors[Whitepaper] Business Transformation Success Factors
[Whitepaper] Business Transformation Success Factors
 
[Whitepaper] 5 Dimensions of Employee Engagement Scorecard
[Whitepaper] 5 Dimensions of Employee Engagement Scorecard[Whitepaper] 5 Dimensions of Employee Engagement Scorecard
[Whitepaper] 5 Dimensions of Employee Engagement Scorecard
 
[Whitepaper] Digital Transformation: Workforce Digitization
[Whitepaper] Digital Transformation: Workforce Digitization[Whitepaper] Digital Transformation: Workforce Digitization
[Whitepaper] Digital Transformation: Workforce Digitization
 
[Whitepaper] Strategic Human Resources: Evolution of Competition
[Whitepaper] Strategic Human Resources: Evolution of Competition[Whitepaper] Strategic Human Resources: Evolution of Competition
[Whitepaper] Strategic Human Resources: Evolution of Competition
 
[Whitepaper] 8 Key Steps of Data Integration: Restructuring Redeployment Asse...
[Whitepaper] 8 Key Steps of Data Integration: Restructuring Redeployment Asse...[Whitepaper] 8 Key Steps of Data Integration: Restructuring Redeployment Asse...
[Whitepaper] 8 Key Steps of Data Integration: Restructuring Redeployment Asse...
 
[Whitepaper] Strategy Classics: Value Disciplines Model
[Whitepaper] Strategy Classics: Value Disciplines Model[Whitepaper] Strategy Classics: Value Disciplines Model
[Whitepaper] Strategy Classics: Value Disciplines Model
 
[Whitepaper] The Definitive Guide to Strategic Planning: Here’s What You Need...
[Whitepaper] The Definitive Guide to Strategic Planning: Here’s What You Need...[Whitepaper] The Definitive Guide to Strategic Planning: Here’s What You Need...
[Whitepaper] The Definitive Guide to Strategic Planning: Here’s What You Need...
 
[Whitepaper] The Definitive Introduction to Strategy Development and Strategy...
[Whitepaper] The Definitive Introduction to Strategy Development and Strategy...[Whitepaper] The Definitive Introduction to Strategy Development and Strategy...
[Whitepaper] The Definitive Introduction to Strategy Development and Strategy...
 
[Whitepaper] The “Theory of Constraints:” What’s Limiting Your Organization?
[Whitepaper] The “Theory of Constraints:” What’s Limiting Your Organization?[Whitepaper] The “Theory of Constraints:” What’s Limiting Your Organization?
[Whitepaper] The “Theory of Constraints:” What’s Limiting Your Organization?
 
[Whitepaper] Transportation Cost Reduction in Supply Chain Management
[Whitepaper] Transportation Cost Reduction in Supply Chain Management[Whitepaper] Transportation Cost Reduction in Supply Chain Management
[Whitepaper] Transportation Cost Reduction in Supply Chain Management
 
[Whitepaper] A Great Leadership Experience: Dr. Rachid Yazami, Inventor of th...
[Whitepaper] A Great Leadership Experience: Dr. Rachid Yazami, Inventor of th...[Whitepaper] A Great Leadership Experience: Dr. Rachid Yazami, Inventor of th...
[Whitepaper] A Great Leadership Experience: Dr. Rachid Yazami, Inventor of th...
 
[Whitepaper] Finding It Hard to Manage Conflict at the Workplace? Use the Tho...
[Whitepaper] Finding It Hard to Manage Conflict at the Workplace? Use the Tho...[Whitepaper] Finding It Hard to Manage Conflict at the Workplace? Use the Tho...
[Whitepaper] Finding It Hard to Manage Conflict at the Workplace? Use the Tho...
 
[Whitepaper] Key Account Management: Handling Large Global Accounts the Right...
[Whitepaper] Key Account Management: Handling Large Global Accounts the Right...[Whitepaper] Key Account Management: Handling Large Global Accounts the Right...
[Whitepaper] Key Account Management: Handling Large Global Accounts the Right...
 
[Whitepaper] Nudge Theory: An Effective Way to Transform Negative Behaviors
[Whitepaper] Nudge Theory: An Effective Way to Transform Negative Behaviors[Whitepaper] Nudge Theory: An Effective Way to Transform Negative Behaviors
[Whitepaper] Nudge Theory: An Effective Way to Transform Negative Behaviors
 
[Whitepaper] Business Model Innovation: Creation of Scalable Business Models ...
[Whitepaper] Business Model Innovation: Creation of Scalable Business Models ...[Whitepaper] Business Model Innovation: Creation of Scalable Business Models ...
[Whitepaper] Business Model Innovation: Creation of Scalable Business Models ...
 
[Whitepaper] Shareholder Value Traps: How to Evade Them and Focus on Value Cr...
[Whitepaper] Shareholder Value Traps: How to Evade Them and Focus on Value Cr...[Whitepaper] Shareholder Value Traps: How to Evade Them and Focus on Value Cr...
[Whitepaper] Shareholder Value Traps: How to Evade Them and Focus on Value Cr...
 

Último

Pitch Deck Teardown: Geodesic.Life's $500k Pre-seed deck
Pitch Deck Teardown: Geodesic.Life's $500k Pre-seed deckPitch Deck Teardown: Geodesic.Life's $500k Pre-seed deck
Pitch Deck Teardown: Geodesic.Life's $500k Pre-seed deckHajeJanKamps
 
MAHA Global and IPR: Do Actions Speak Louder Than Words?
MAHA Global and IPR: Do Actions Speak Louder Than Words?MAHA Global and IPR: Do Actions Speak Louder Than Words?
MAHA Global and IPR: Do Actions Speak Louder Than Words?Olivia Kresic
 
Fordham -How effective decision-making is within the IT department - Analysis...
Fordham -How effective decision-making is within the IT department - Analysis...Fordham -How effective decision-making is within the IT department - Analysis...
Fordham -How effective decision-making is within the IT department - Analysis...Peter Ward
 
Unlocking the Future: Explore Web 3.0 Workshop to Start Earning Today!
Unlocking the Future: Explore Web 3.0 Workshop to Start Earning Today!Unlocking the Future: Explore Web 3.0 Workshop to Start Earning Today!
Unlocking the Future: Explore Web 3.0 Workshop to Start Earning Today!Doge Mining Website
 
Independent Call Girls Andheri Nightlaila 9967584737
Independent Call Girls Andheri Nightlaila 9967584737Independent Call Girls Andheri Nightlaila 9967584737
Independent Call Girls Andheri Nightlaila 9967584737Riya Pathan
 
Flow Your Strategy at Flight Levels Day 2024
Flow Your Strategy at Flight Levels Day 2024Flow Your Strategy at Flight Levels Day 2024
Flow Your Strategy at Flight Levels Day 2024Kirill Klimov
 
Youth Involvement in an Innovative Coconut Value Chain by Mwalimu Menza
Youth Involvement in an Innovative Coconut Value Chain by Mwalimu MenzaYouth Involvement in an Innovative Coconut Value Chain by Mwalimu Menza
Youth Involvement in an Innovative Coconut Value Chain by Mwalimu Menzaictsugar
 
8447779800, Low rate Call girls in Uttam Nagar Delhi NCR
8447779800, Low rate Call girls in Uttam Nagar Delhi NCR8447779800, Low rate Call girls in Uttam Nagar Delhi NCR
8447779800, Low rate Call girls in Uttam Nagar Delhi NCRashishs7044
 
8447779800, Low rate Call girls in New Ashok Nagar Delhi NCR
8447779800, Low rate Call girls in New Ashok Nagar Delhi NCR8447779800, Low rate Call girls in New Ashok Nagar Delhi NCR
8447779800, Low rate Call girls in New Ashok Nagar Delhi NCRashishs7044
 
8447779800, Low rate Call girls in Saket Delhi NCR
8447779800, Low rate Call girls in Saket Delhi NCR8447779800, Low rate Call girls in Saket Delhi NCR
8447779800, Low rate Call girls in Saket Delhi NCRashishs7044
 
Kenya’s Coconut Value Chain by Gatsby Africa
Kenya’s Coconut Value Chain by Gatsby AfricaKenya’s Coconut Value Chain by Gatsby Africa
Kenya’s Coconut Value Chain by Gatsby Africaictsugar
 
Cyber Security Training in Office Environment
Cyber Security Training in Office EnvironmentCyber Security Training in Office Environment
Cyber Security Training in Office Environmentelijahj01012
 
Darshan Hiranandani [News About Next CEO].pdf
Darshan Hiranandani [News About Next CEO].pdfDarshan Hiranandani [News About Next CEO].pdf
Darshan Hiranandani [News About Next CEO].pdfShashank Mehta
 
8447779800, Low rate Call girls in Shivaji Enclave Delhi NCR
8447779800, Low rate Call girls in Shivaji Enclave Delhi NCR8447779800, Low rate Call girls in Shivaji Enclave Delhi NCR
8447779800, Low rate Call girls in Shivaji Enclave Delhi NCRashishs7044
 
Memorándum de Entendimiento (MoU) entre Codelco y SQM
Memorándum de Entendimiento (MoU) entre Codelco y SQMMemorándum de Entendimiento (MoU) entre Codelco y SQM
Memorándum de Entendimiento (MoU) entre Codelco y SQMVoces Mineras
 
Organizational Structure Running A Successful Business
Organizational Structure Running A Successful BusinessOrganizational Structure Running A Successful Business
Organizational Structure Running A Successful BusinessSeta Wicaksana
 
APRIL2024_UKRAINE_xml_0000000000000 .pdf
APRIL2024_UKRAINE_xml_0000000000000 .pdfAPRIL2024_UKRAINE_xml_0000000000000 .pdf
APRIL2024_UKRAINE_xml_0000000000000 .pdfRbc Rbcua
 
Innovation Conference 5th March 2024.pdf
Innovation Conference 5th March 2024.pdfInnovation Conference 5th March 2024.pdf
Innovation Conference 5th March 2024.pdfrichard876048
 
Market Sizes Sample Report - 2024 Edition
Market Sizes Sample Report - 2024 EditionMarket Sizes Sample Report - 2024 Edition
Market Sizes Sample Report - 2024 EditionMintel Group
 
Investment in The Coconut Industry by Nancy Cheruiyot
Investment in The Coconut Industry by Nancy CheruiyotInvestment in The Coconut Industry by Nancy Cheruiyot
Investment in The Coconut Industry by Nancy Cheruiyotictsugar
 

Último (20)

Pitch Deck Teardown: Geodesic.Life's $500k Pre-seed deck
Pitch Deck Teardown: Geodesic.Life's $500k Pre-seed deckPitch Deck Teardown: Geodesic.Life's $500k Pre-seed deck
Pitch Deck Teardown: Geodesic.Life's $500k Pre-seed deck
 
MAHA Global and IPR: Do Actions Speak Louder Than Words?
MAHA Global and IPR: Do Actions Speak Louder Than Words?MAHA Global and IPR: Do Actions Speak Louder Than Words?
MAHA Global and IPR: Do Actions Speak Louder Than Words?
 
Fordham -How effective decision-making is within the IT department - Analysis...
Fordham -How effective decision-making is within the IT department - Analysis...Fordham -How effective decision-making is within the IT department - Analysis...
Fordham -How effective decision-making is within the IT department - Analysis...
 
Unlocking the Future: Explore Web 3.0 Workshop to Start Earning Today!
Unlocking the Future: Explore Web 3.0 Workshop to Start Earning Today!Unlocking the Future: Explore Web 3.0 Workshop to Start Earning Today!
Unlocking the Future: Explore Web 3.0 Workshop to Start Earning Today!
 
Independent Call Girls Andheri Nightlaila 9967584737
Independent Call Girls Andheri Nightlaila 9967584737Independent Call Girls Andheri Nightlaila 9967584737
Independent Call Girls Andheri Nightlaila 9967584737
 
Flow Your Strategy at Flight Levels Day 2024
Flow Your Strategy at Flight Levels Day 2024Flow Your Strategy at Flight Levels Day 2024
Flow Your Strategy at Flight Levels Day 2024
 
Youth Involvement in an Innovative Coconut Value Chain by Mwalimu Menza
Youth Involvement in an Innovative Coconut Value Chain by Mwalimu MenzaYouth Involvement in an Innovative Coconut Value Chain by Mwalimu Menza
Youth Involvement in an Innovative Coconut Value Chain by Mwalimu Menza
 
8447779800, Low rate Call girls in Uttam Nagar Delhi NCR
8447779800, Low rate Call girls in Uttam Nagar Delhi NCR8447779800, Low rate Call girls in Uttam Nagar Delhi NCR
8447779800, Low rate Call girls in Uttam Nagar Delhi NCR
 
8447779800, Low rate Call girls in New Ashok Nagar Delhi NCR
8447779800, Low rate Call girls in New Ashok Nagar Delhi NCR8447779800, Low rate Call girls in New Ashok Nagar Delhi NCR
8447779800, Low rate Call girls in New Ashok Nagar Delhi NCR
 
8447779800, Low rate Call girls in Saket Delhi NCR
8447779800, Low rate Call girls in Saket Delhi NCR8447779800, Low rate Call girls in Saket Delhi NCR
8447779800, Low rate Call girls in Saket Delhi NCR
 
Kenya’s Coconut Value Chain by Gatsby Africa
Kenya’s Coconut Value Chain by Gatsby AfricaKenya’s Coconut Value Chain by Gatsby Africa
Kenya’s Coconut Value Chain by Gatsby Africa
 
Cyber Security Training in Office Environment
Cyber Security Training in Office EnvironmentCyber Security Training in Office Environment
Cyber Security Training in Office Environment
 
Darshan Hiranandani [News About Next CEO].pdf
Darshan Hiranandani [News About Next CEO].pdfDarshan Hiranandani [News About Next CEO].pdf
Darshan Hiranandani [News About Next CEO].pdf
 
8447779800, Low rate Call girls in Shivaji Enclave Delhi NCR
8447779800, Low rate Call girls in Shivaji Enclave Delhi NCR8447779800, Low rate Call girls in Shivaji Enclave Delhi NCR
8447779800, Low rate Call girls in Shivaji Enclave Delhi NCR
 
Memorándum de Entendimiento (MoU) entre Codelco y SQM
Memorándum de Entendimiento (MoU) entre Codelco y SQMMemorándum de Entendimiento (MoU) entre Codelco y SQM
Memorándum de Entendimiento (MoU) entre Codelco y SQM
 
Organizational Structure Running A Successful Business
Organizational Structure Running A Successful BusinessOrganizational Structure Running A Successful Business
Organizational Structure Running A Successful Business
 
APRIL2024_UKRAINE_xml_0000000000000 .pdf
APRIL2024_UKRAINE_xml_0000000000000 .pdfAPRIL2024_UKRAINE_xml_0000000000000 .pdf
APRIL2024_UKRAINE_xml_0000000000000 .pdf
 
Innovation Conference 5th March 2024.pdf
Innovation Conference 5th March 2024.pdfInnovation Conference 5th March 2024.pdf
Innovation Conference 5th March 2024.pdf
 
Market Sizes Sample Report - 2024 Edition
Market Sizes Sample Report - 2024 EditionMarket Sizes Sample Report - 2024 Edition
Market Sizes Sample Report - 2024 Edition
 
Investment in The Coconut Industry by Nancy Cheruiyot
Investment in The Coconut Industry by Nancy CheruiyotInvestment in The Coconut Industry by Nancy Cheruiyot
Investment in The Coconut Industry by Nancy Cheruiyot
 

Product Lifecycle

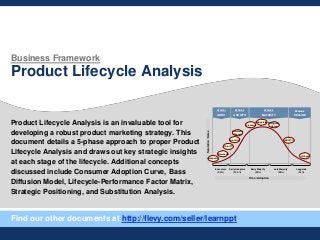
  • 1. Business Framework Product Lifecycle Analysis Product Lifecycle Analysis is an invaluable tool for developing a robust product marketing strategy. This document details a 5-phase approach to proper Product Lifecycle Analysis and draws out key strategic insights at each stage of the lifecycle. Additional concepts discussed include Consumer Adoption Curve, Bass Diffusion Model, Lifecycle-Performance Factor Matrix, Strategic Positioning, and Substitution Analysis. Innovators (2.5%) Early Adopters (13.5%) Early Majority (34%) Late Majority (34%) Laggards (16%) STAGE 1 INTRO STAGE 2 GROWTH STAGE 3 MATURITY STAGE 4 DECLINE Time / Adoption Saturation/Sales Compactor Dishwasher Color TV Room A/C Automatic Washers Freezers Refrigerators Ranges & Ovens B&W TV Wringer Find our other documents at http://flevy.com/seller/learnppt
  • 2. 3 Contents • Overview - Consumer Adoption Curve - Product Profitability - Product Lifecycle Stages - Strategic Purposes - Drawbacks • Product Lifecycle Analysis - Areas of Analysis - 5 Phases - Bass Diffusion Model • Strategic Insights - Stage-based Strategies - Strategic Positioning Matrix
  • 3. 5 “CrossingtheChasm” The Product Lifecycle is typically mapped against the Consumer Adoption Curve to draw out key marketing and competitive insights Product Lifecycle – Consumer Adoption Curve It is useful to map all products within an industry or product category against the Adoption Curve—to visualize dynamics among products (e.g. substitution, complements). Innovators (2.5%) Early Adopters (13.5%) Early Majority (34%) Late Majority (34%) Laggards (16%) STAGE 1 INTRODUCTION STAGE 2 GROWTH STAGE 3 MATURITY STAGE 4 DECLINE Source: Hax and Majluf, 1984
  • 4. 7 The lifecycle concept is also closely related to Substitution Analysis Relation to Substitution Analysis • As a product moves through its lifecycle, the likelihood of customers switching to a replacement—or substitute—product increases • This trend is referred to as the Technology S-curve - As the diffusion rate of new technology generally follows an S-shaped curve • Since substitution estimates the adoption rate, the focus is only on the early stages of the Product Lifecycle (i.e. Introduction, Growth, Early Maturity)
  • 5. 9 The appropriate strategy for a business depends on the stage of lifecycle for the related industry Product Lifecycle Stages INTRODUCTION Typified by slow growth rate • Heavy expenditures across the areas of advertising, selling, sampling, promotion, distribution to stimulate awareness of and demand for the product • Initial market awareness is minimal, so the focus is on educating the customer to encourage a trial usage (net cash flow and profitability are negative during this stage) DETAILED CHARACTERTIZATION GROWTH Signaled by a significant increase in sales growth and profitability • Expenditures remain relatively high, but the focus shifts toward building and holding loyal customers (e.g. product variation increases as more competitors enter market) • The increase in volume sold more than compensates for the decrease in pricing (driven by competitive pressures and experience curve effects), causing cash flows and profitability to increase PRIMARY CHARACTERIZATIONSTAGE MATURITY Defined by the reduction in the rate of sales growth and a further reduction in unit costs • As the growth rate of the market slows, weaker competitors are forced out— we see larger players consolidating and acquiring smaller players, and excess capacity drives down prices • Customer preferences and expectations begin to stabilize, driving up competitive rivalry as companies compete for customer loyalty and satisfaction • By the end of the maturity stage, units sales, cash flows, and profitability all decline DECLINE See a continuation of decline in unit sales, cash flows, and profitability • Customers switch to new and/or better products—private labels take an increasing market share • Some competitors maintain profitability by being the focus, niche player with specialized products—however, long term prospects for these small players are unlikely
  • 6. 11 With all the strategic benefits of Product Lifecycle Analysis, it is important to note this framework’s drawbacks Drawbacks of Product Lifecycle Analysis Lifecycle Analysis is based entirely on time. • This framework assumes all industries/products move through a predictable growth pattern as time passes • This is a limited point of view is and does no consider the structural economics in an industry that might impact sales and profitability - E.g., not all industries follow an S-shaped sales growth pattern—some industries skip the Introduction stage, others skip Maturity and begin to decline immediately (e.g. due to a disruptive technology) - Companies can be impact the shape of the sales growth curve through product innovation or strategic market repositioning The actual timing of the lifecycle stages different from industry-to- industry and product-to-product. • To use Lifecycle Analysis as a forecasting tool, we must make broad assumptions regarding the stage of the product’s life - Resultantly, sales forecasts are typically incorrect - E.g., a slump in sales could be mistakenly be interpreted as that a product has reached the Maturity or Decline stage, when other factors may be at play From a strategic perspective, there is no clear relation between the nature of competition in an industry and its current lifecycle stage. • To illustrate this point, some industry remains highly concentrated throughout the lifecycle—others main highly fragmented • The nature of competition is more dependent on the underlying economics of the business, rather than the lifecycle concept—and over-reliance on this framework may provide misleading conclusions DRAWBACK DETAILS Lifecycle Analysis should be used as a starting point to developing strategic hypotheses— underlying economics should be further analyzed before specific action is recommended.
  • 7. 13 Contents • Overview - Consumer Adoption Curve - Product Profitability - Product Lifecycle Stages - Strategic Purposes - Drawbacks • Product Lifecycle Analysis - Areas of Analysis - 5 Phases - Bass Diffusion Model • Strategic Insights - Stage-based Strategies - Strategic Positioning Matrix
  • 8. 15 There are 5 phases to conducting Lifecycle Analysis Product Lifecycle Analysis Approach Define the industry/ scope of analysis Determine the level of lifecycle performance metrics Identify the lifecycle stage Forecast sales based on lifecycle stage Develop strategic hypotheses and action steps 1 2 3 4 5 • Be clear about your industry, as this drives the scope of your analysis • Determine the SIC code to focus on • Evaluate product performance against 7 external factors • Develop a Lifecycle- Performance Factor Matrix • Validate the lifecycle stage against generic performance metrics • Estimate sales by the lifecycle stage • Utilize the Bass Diffusion Model for new technology or product innovation • Draw strategic recommendations based on knowledge of the select lifecycle stage
  • 9. 17 Phase 2 Determine the level of lifecycle performance metrics Business and product performance across seven external factors must be assessed.  There are 7 external performance factors that must be evaluated, which are:  Relative growth rate  Market industry potential  Breadth of the product lines  Number of competitors  Distribution/stability of market share among competitors  Barriers to entry  Technology innovation  The levels of these metrics should be identified through focus interviews and secondary research (e.g. trade association publications, analyst reports, annual reports, SEC filings, business journals) Define the industry/ scope of analysis Determine the level of lifecycle perf. metrics Identify the lifecycle stage Forecast sales based on lifecycle stage Develop strategic hypotheses and action steps 1 2 3 4 5
  • 10. 19 This is a typical Lifecycle-Performance Factor Matrix Lifecycle-Performance Factor Matrix The matrix above is true to most industry and product lifecycles, but many exceptions exist. INTRODUCTION GROWTH MATURITY DECLINE Relative Growth Rate Positive, increasing Positive, increasing Positive, decreasing Negative, increasing Market Industry Potential Uncertain Strong Moderate Weak Breadth of Product Lines Narrow Increasing Wide, private label emerging Decreasing Number of Competitors Few Increasing Several, consolidation occurring Decreasing Distribution/Stability of Market Share Unstable Stabilizing Stable, strong loyalty Stable, customers loyal Barriers to Entry Low Increasing High High Technology Innovation High Stable Stable Low EXTERNAL PERFORMANCE FACTOR LIFECYCLE STAGE Source: Hax and Majluf, 1984 Define the industry/ scope of analysis Determine the level of lifecycle perf. metrics Identify the lifecycle stage Forecast sales based on lifecycle stage Develop strategic hypotheses and action steps 1 2 3 4 5
  • 11. 21 In addition to validation, these generic performance metrics can provide strategic insight Generic Performance Metrics by Lifecycle Stage (2 of 2) INTRODUCTION GROWTH MATURITY DECLINE Foreign Trade  Some exports  Significant exports  Few imports  Falling exports  Significant imports  No exports  Significant imports Competition  Few competitors  Entry high, many competitors  Increasing mergers  Price competition  Industry shake out  Increase in private brands  Exist  Few competitors Risk  High risk  Growth covers risk taking behavior  Cyclicality Margins and Profits  High prices and margins  Low profits  Price elasticity low  High profits, fairly high prices  Recession resistant  High P/E ratios  Good acquisition climate  Falling prices, lower profits and margins  Lower dealer margins  Increase market share stability  Poor acquisition climate, tough to sell companies  Low prices and margins  Price may rise in late decline Overall Strategy  Best period to increase share  R&D and engineering are key functions  Practical to change price or quality image  Marketing is key function  Bad time to increase share, change price, or quality image  Competitive cost structure key  Marketing effectiveness is key  Cost management is key PERFORMANCE FACTOR Source: Michael Porter, Competitive Strategy Use these metrics and trends to develop strategic insight into the market dynamics. Define the industry/ scope of analysis Determine the level of lifecycle perf. metrics Identify the lifecycle stage Forecast sales based on lifecycle stage Develop strategic hypotheses and action steps 1 2 3 4 5
  • 12. 23 Apply product knowledge and insight when using Product Lifecycle for forecasting Implications on Sales Growth  If we determine the product to be in the Growth stage of its lifecycle, the sales growth would be expected to be grow at a slower rate  We should recognize that the product will eventually reach maturity, at which point the sales growth rate will begin to decline  This insight should be incorporated into the sale forecasts  For forecasting purposes, the timing of these stages and subsequent changes to the sales growth rate should be estimated by reviewing the sales histories of comparable products or industries Define the industry/ scope of analysis Determine the level of lifecycle perf. metrics Identify the lifecycle stage Forecast sales based on lifecycle stage Develop strategic hypotheses and action steps 1 2 3 4 5
  • 13. 25 Here is the Bass Model Diffusion Equation Bass Diffusion Model – Equation The Bass Model approximate the S-curve using the following adoption equation: Where: Pt probability of a purchase at time t, given that no purchase has yet been made p coefficient of innovation, initial probability of adoption (from comparable products) q coefficient of imitation, measure of the ―word of mouth‖ effect (from comparable products) yt-1 cumulative sales prior to period t (i.e. including period t-1) m market potential / potential sales volume (determined from market research) (yt-1/m) fraction of the Total Available Market (TAM) who have tried the new technology • Using this probability estimate, sales volume resulting from new adopters in any period would be equal to the remaining potential sales multiplied by Pt • Mathematically, sales volume in any period would be given by:    S p m q p y q m yt t t      1 1 2 P p q y m t t          1 Define the industry/ scope of analysis Determine the level of lifecycle perf. metrics Identify the lifecycle stage Forecast sales based on lifecycle stage Develop strategic hypotheses and action steps 1 2 3 4 5
  • 14. 27 Phase 5 Develop strategic hypotheses and action steps The results of the Lifecycle Analysis should be drive strategic hypotheses  The lifecycle stage has implications for strategic and tactics selected by your organization  These implications are based on generalizations across several industries  They may be used to drive strategic hypotheses, but should be rigorously analyzed prior to recommendation or implementation Define the industry/ scope of analysis Determine the level of lifecycle perf. metrics Identify the lifecycle stage Forecast sales based on lifecycle stage Develop strategic hypotheses and action steps 1 2 3 4 5 Stage specific strategies are detailed in the next section
  • 15. 29 In the Introduction stage, get your pricing strategy right Introduction Stage Strategies INTRO GROWTH MATURITY DECLINE  Invest heavily in advertising, selling, sampling, promotion, and distribution to stimulate diffusion of the new product to earn new customers  Experiment with production processes to ensure continuous improvement and innovation  Monitor competitors and adjust positioning to preempt competitive moves  Pricing should receive special attention in the Introduction stage  There are two general pricing strategies in the Introduction stage: 1) set prices high to ―skim the market,‖ or 2) set prices low to maximize ―market penetration‖ – decision on strategy depends on level of competition  By setting prices high, margins will be maximized—minimizing consumer surplus with innovator/early adopter markets  Competitors will enter the market, pushing prices down, unless the incumbent has a cost advantage (e.g. economy of scale, experience, investment required)  If prices are set low, initial investment in the product may not be recovered  Although competitors will be less likely enter the market, a technological innovation may make the current product obsolete  Thus, the pricing decision must be made by weighing the benefits and risks of potential market demand (size and growth), competitive entry, and technological development
  • 16. 31 The Maturity stage leads to 3 strategic options Maturity Stage Strategies INTRO GROWTH MATURITY DECLINE  Based on the competitive dynamics in the industry, there are 3 strategies we should follow to extend the profitability and duration of the Maturity stage  Maintenance  Employed when the threat from competitive entry or technology innovation are minimal  Maintain the market position/profitability through advertising, promotion, and pricing  Monitor competitive positioning, product development activities, and general business and macro-environmental trends  Defense  Employed when new or current competitors are altering the status quo by changing their marketing mix (i.e. product, pricing, promotion, placement)  Adjust advertising and promotion, improve their product performance, modify pricing, and alter distribution spending to maintain profitability  Innovation  Employed to expand the market, fill customer needs, and preempt competition  Develop product innovation through ―flankers‖ (E.g. new flavors, colors, sizes, new uses and users (e.g. Arm & Hammer’s baking soda to deodorize refrigerator smells), or significant product innovation (e.g. cannibalization, introduction of new models)  In addition to these generic strategies, we should identify and exploit core competencies and competitive advantages to survive the industry shake-out/massive consolidation at the end of the Maturity stage (e.g. brand equity, cost advantages, channel dominance/partnerships)
  • 17. 33 Product Lifecycle Analysis can be extended and applied to the BCG Growth-Share Matrix Competitive Positioning Categories The strategic actions implied by Lifecycle Analysis depend on both the current stage, as well as the competitive positioning of the business or product in the market. The competitive position of our business or product can be estimated based on a set of qualitative and quantitative criteria for each the 6 competitive categories below: DOMINANT STRONG FAVORABLE TENABLE WEAK NONVIABLE Results from quasi-monopoly or a strongly protective technical leadership Can usually follow strategies of their choice, irrespective of competitors Fragment industries, with no competitor clearly standing out Can usually be maintained profitably through specialization in the niche Can be too small to survive independently and remain profitable in the long-term, given the competitive economics of the industry; can be a large firm suffering from past mistakes Market is too small, product is not differentiated, costs are too high to be competitive
  • 18. 1 Flevy (www.flevy.com) is the marketplace for premium documents. These documents can range from Business Frameworks to Financial Models to PowerPoint Templates. Flevy was founded under the principle that companies waste a lot of time and money recreating the same foundational business documents. Our vision is for Flevy to become a comprehensive knowledge base of business documents. All organizations, from startups to large enterprises, can use Flevy— whether it's to jumpstart projects, to find reference or comparison materials, or just to learn. Contact Us Please contact us with any questions you may have about our company. • General Inquiries support@flevy.com • Media/PR press@flevy.com • Billing billing@flevy.com