SlideShare a Scribd company logo
1 of 10
Project AC/DC - Valuation Summary
($ in millions)
Representative Multiples Range Latest Quarter (1) Implied TEV Range
Methodology Level Low -- High Cash Total Debt Low -- High
Comparable Public Companies
TEV / Revenue
LTM $176.6 0.50x -- 0.60x 88.3 -- 106.0
FYE + 1 222.8 0.50x -- 0.60x 111.4 -- 133.7
TEV / EBITDA
LTM $15.8 9.0x -- 11.0x 142.1 -- 173.6
FYE + 1 18.6 8.0x -- 10.0x 148.6 -- 185.7
Price / Earnings
LTM $6.8 24.0x -- 28.0x $17.0 $36.9 182.4 -- 209.5
FYE + 1 8.1 18.0x -- 22.0x 17.0 36.9 165.7 -- 198.1
Precedent Transactions (2)
LTM Revenue $176.6 0.60x -- 0.70x 88.3 -- 103.0
LTM EBITDA 15.8 9.5x -- 10.5x 125.0 -- 138.1
Discounted Cash Flow (DCF) 164.3 -- 218.1
Median $142.1 -- $173.6
Mean $135.1 -- $162.9
(1) AC/DC does not have preferred stock or minority interest.
(2) Adjusted for a 20% acquisition premium.
Comparable Public Companies Analysis
($ in millions)
Comparable Companies - Consumer Electronics | Retail
THERE SHOULD BE NO HARDCODES ON THIS TAB
Multiples Analysis
Share
Price % of 52- Market Enterprise TEV / Revenue TEV / EBITDA Price / Earnings
Company Name Ticker 11/20/2006 week High Capitalization Value Cash Debt LTM FYE+1 LTM FYE+1 LTM FYE+1
Best Buy Co., Inc. BBY $54.63 8.2% $27,262.9 $24,903.9 $2,668.0 $680.0 0.76x 0.70x 10.8x 9.7x 21.9x 19.0x
Circuit City Stores, Inc. CC 23.55 25.3% 4,191.8 3,679.3 599.6 87.0 0.30x 0.28x 7.8x 7.3x 20.7x 18.0x
RadioShack Corp. RSH 17.88 25.3% 2,428.5 2,762.1 276.4 610.0 0.55x 0.56x 10.2x 9.0x 32.9x 24.9x
Median 25.3% $4,191.8 $3,679.3 $599.6 $610.0 0.55x 0.56x 10.2x 9.0x 21.9x 19.0x
Mean 19.6% $11,294.4 $10,448.4 $1,181.3 $459.0 0.54x 0.52x 9.6x 8.7x 25.2x 20.6x
Margins Analysis
Revenue Growth EBITDA Growth EPS Growth LTM CapEx % EBIT Margin EBITDA Margin Net Margin
Company Name FYE '05-06 FYE '06-07 FYE '05-06 FYE '06-07 FYE '05-06 FYE '06-07 of Revenue LTM FYE+1 LTM FYE+1 LTM FYE+1
Best Buy Co., Inc. 12.4% 14.9% 10.6% 22.2% 22.1% 26.1% 2.2% 5.6% 6.0% 7.1% 7.3% 3.8% 4.1%
Circuit City Stores, Inc. 10.8% 11.7% 36.9% 19.1% 68.6% 33.3% 1.7% 2.4% 2.6% 3.9% 3.9% 1.7% 2.0%
RadioShack Corp. 5.0% -3.2% -28.2% -35.1% -20.0% -63.8% 2.2% 2.8% 3.6% 5.4% 6.2% 1.5% 2.0%
Median 10.8% 11.7% 10.6% 19.1% 22.1% 26.1% 2.2% 2.8% 3.6% 5.4% 6.2% 1.7% 2.0%
Mean 9.4% 7.8% 6.4% 2.0% 23.6% -1.5% 2.0% 3.6% 4.1% 5.5% 5.8% 2.3% 2.7%
Source:
Company filings, Yahoo! Finance, equity analyst research and press releases.
Effective Tax Rate 35% FYE - 1 2005 FY + 1 2007P
Stock Valuation Date 11/20/2006 FYE 2006 FY + 2 2008P
Ticker BBY CC RSH
Name Best Buy Co., Inc. Circuit City Stores, Inc. RadioShack Corp. Company Name Company Name Company Name Company Name Company Name Company Name Company Name Company Name Company Name
Company Descriptions Best Buy Co., Inc. is
a specialty retailer of
consumer
electronics, home-
office products,
entertainment
software, appliances
and related services.
Circuit City Stores,
Inc. is a national
retailer of brand-
name consumer
electronics, personal
computers (PCs)
and entertainment
software.
RadioShack
Corporation is
primarily engaged in
the retail sale of
consumer electronic
goods and services
through its
RadioShack store
Insert Company
Information
Insert Company
Information
Insert Company
Information
Insert Company
Information
Insert Company
Information
Insert Company
Information
Insert Company
Information
Insert Company
Information
Insert Company
Information
Stock Price as of (11/20/06) $54.63 $23.55 $17.88 $0.00 $0.00 $0.00 $0.00 $0.00 $0.00 $0.00 $0.00 $0.00
52 Wk High $59.50 $31.54 $23.95 $0.00 $0.00 $0.00 $0.00 $0.00 $0.00 $0.00 $0.00 $0.00
52 Wk Low $42.75 $20.21 $13.73 $0.00 $0.00 $0.00 $0.00 $0.00 $0.00 $0.00 $0.00 $0.00
% Off High 8.2% 25.3% 25.3% #DIV/0! #DIV/0! #DIV/0! #DIV/0! #DIV/0! #DIV/0! #DIV/0! #DIV/0! #DIV/0!
Enterprise Value $24,903.9 $3,679.3 $2,762.1 $0.0 $0.0 $0.0 $0.0 $0.0 $0.0 $0.0 $0.0 $0.0
Equity Value $27,262.9 $4,191.8 $2,428.5 $0.0 $0.0 $0.0 $0.0 $0.0 $0.0 $0.0 $0.0 $0.0
EV / Sales 0.81x 0.32x 0.54x NA NA NA NA NA NA NA NA NA
EV / LTM Sales 0.76x 0.30x 0.55x NA NA NA NA NA NA NA NA NA
EV / 2007P Sales 0.70x 0.28x 0.56x NA NA NA NA NA NA NA NA NA
EV / 2008P Sales 0.59x 0.26x 0.54x NA NA NA NA NA NA NA NA NA
EV / EBITDA 11.8x 8.7x 5.8x NA NA NA NA NA NA NA NA NA
EV / LTM EBITDA 10.8x 7.8x 10.2x NA NA NA NA NA NA NA NA NA
EV / 2007P EBITDA 9.7x 7.3x 9.0x NA NA NA NA NA NA NA NA NA
EV / 2008P EBITDA 8.3x 5.8x 6.9x NA NA NA NA NA NA NA NA NA
EV / EBIT 15.1x 14.3x 7.9x NA NA NA NA NA NA NA NA NA
EV / LTM EBIT 13.8x 12.3x 19.6x NA NA NA NA NA NA NA NA NA
EV / 2007P EBIT 11.8x 11.0x 15.5x NA NA NA NA NA NA NA NA NA
EV / 2008P EBIT 9.8x 7.9x 10.2x NA NA NA NA NA NA NA NA NA
Gross Margin 25.0% 24.4% 46.7% #DIV/0! #DIV/0! #DIV/0! #DIV/0! #DIV/0! #DIV/0! #DIV/0! #DIV/0! #DIV/0!
LTM Gross Margin 24.9% 24.3% 45.2% #DIV/0! #DIV/0! #DIV/0! #DIV/0! #DIV/0! #DIV/0! #DIV/0! #DIV/0! #DIV/0!
EBITDA Margin 6.8% 3.6% 9.3% NA NA NA NA NA NA NA NA NA
LTM EBITDA Margin 7.1% 3.9% 5.4% NA NA NA NA NA NA NA NA NA
2007P EBITDA Margin 7.3% 3.9% 6.2% NA NA NA NA NA NA NA NA NA
2008P EBITDA Margin 7.1% 4.5% 7.8% NA NA NA NA NA NA NA NA NA
EBIT Margin 5.3% 2.2% 6.9% NA NA NA NA NA NA NA NA NA
LTM EBIT Margin 5.6% 2.4% 2.8% NA NA NA NA NA NA NA NA NA
2007P EBIT Margin 6.0% 2.6% 3.6% NA NA NA NA NA NA NA NA NA
2008P EBIT Margin 6.0% 3.3% 5.3% NA NA NA NA NA NA NA NA NA
Other Metric
Basic Shares Out. 480.3 175.2 135.8
Cash and Cash Equivalents $2,668.0 $599.6 $276.4
Total Debt on Balance Sheet 680.0 87.0 610.0
Less: Convertible Debt figured in FD Shares (402.0) 0.0 0.0 0.0 0.0 0.0 0.0 0.0 0.0 0.0 0.0 0.0
Preferred Equity 0.0 0.0 0.0
Less: Preferred Equity figured into FD Shares 0.0 0.0 0.0 0.0 0.0 0.0 0.0 0.0 0.0 0.0 0.0 0.0
Minority Interest 31.0 0.0 0.0
Net Debt ($2,359.0) ($512.6) $333.6 $0.0 $0.0 $0.0 $0.0 $0.0 $0.0 $0.0 $0.0 $0.0
Current Debt $496.0 $38.8 $265.3
Total Current Liabilities 6,366.0 1,729.3 923.3
Total Current Assets 7,887.0 2,844.5 1,488.1
Net Working Capital ($651.0) $554.4 $553.7 $0.0 $0.0 $0.0 $0.0 $0.0 $0.0 $0.0 $0.0 $0.0
Shareholders' Equity $5,434.0 $1,915.3 $600.9
Total Assets $12,407.0 $4,129.9 $1,984.5
F.D. Shares Outstanding 499.0 178.0 135.8 0.0 0.0 0.0 0.0 0.0 0.0 0.0 0.0 0.0
Equity Value $27,262.9 $4,191.8 $2,428.5 $0.0 $0.0 $0.0 $0.0 $0.0 $0.0 $0.0 $0.0 $0.0
Net Debt (2,359.0) (512.6) 333.6 0.0 0.0 0.0 0.0 0.0 0.0 0.0 0.0 0.0
Enterprise Value $24,903.9 $3,679.3 $2,762.1 $0.0 $0.0 $0.0 $0.0 $0.0 $0.0 $0.0 $0.0 $0.0
10-Q Current 8/26/2006 8/31/2006 9/30/2006
Net Sales $14,562.0 $5,456.2 $3,319.4
Gross Profit 3,667.0 1,316.2 1,568.0
SG&A 3,000.0 1,292.7 1,509.6 0.0 0.0 0.0 0.0 0.0 0.0 0.0 0.0 0.0
Reported EBIT 667.0 14.1 11.1
Reported NI 464.0 16.4 (11.1)
D&A 267.0 91.0 97.5
Non-Recurring Oper. Exp. (Inc.) 0.0 9.5 47.3
Final EBIT 667.0 23.6 58.4 0.0 0.0 0.0 0.0 0.0 0.0 0.0 0.0 0.0
Final EBITDA 934.0 114.6 155.9 0.0 0.0 0.0 0.0 0.0 0.0 0.0 0.0 0.0
Non-Recurring Non-Oper. Exp. (Inc.) 0.0 0.0 0.0
Final Net Income 464.0 22.6 19.6 0.0 0.0 0.0 0.0 0.0 0.0 0.0 0.0 0.0
CapEx 299.0 102.9 62.4
10-Q Previous Year 8/26/2005 8/31/2005 9/30/2005 ############# ############# ############# ############# ############# ############# ############# ############# #############
Net Sales $12,820.0 $4,784.9 $3,409.8
Gross Profit 3,269.0 1,167.5 1,688.5
SG&A 2,769.0 1,186.5 1,421.0 0.0 0.0 0.0 0.0 0.0 0.0 0.0 0.0 0.0
Reported EBIT 500.0 (23.6) 267.5
Reported NI 358.0 (8.0) 215.8
D&A 222.0 80.4 91.6
Non-Recurring Oper. Exp. (Inc.) 0.0 4.6 0.0
Final EBIT 500.0 (19.0) 267.5 0.0 0.0 0.0 0.0 0.0 0.0 0.0 0.0 0.0
Final EBITDA 722.0 61.4 359.1 0.0 0.0 0.0 0.0 0.0 0.0 0.0 0.0 0.0
Non-Recurring Non-Oper. Exp. (Inc.) 0.0 0.0 0.0
Final Net Income 358.0 (5.0) 215.8 0.0 0.0 0.0 0.0 0.0 0.0 0.0 0.0 0.0
CapEx 238.0 99.4 121.7
Current 10-K 2/25/2006 2/28/2006 12/31/2005
Net Sales $30,848.0 $11,597.7 $5,081.7
Gross Profit 7,726.0 2,830.9 2,375.4
SG&A 6,082.0 2,573.9 2,025.5 0.0 0.0 0.0 0.0 0.0 0.0 0.0 0.0 0.0
Reported EBIT 1,644.0 220.4 349.9
Reported NI 1,140.00 151.11 269.90
D&A 460.0 163.8 123.8
Non-Recurring Oper. Exp. (Inc.) 0.0 36.6
Final EBIT 1,644.0 257.0 349.9 0.0 0.0 0.0 0.0 0.0 0.0 0.0 0.0 0.0
Final EBITDA 2,104.0 420.8 473.7 0.0 0.0 0.0 0.0 0.0 0.0 0.0 0.0 0.0
Non-Recurring Non-Oper. Exp. (Inc.) 0.0 0.0 0.0
Final Net Income 1,140.0 174.9 269.9 0.0 0.0 0.0 0.0 0.0 0.0 0.0 0.0 0.0
CapEx 648.0 199.1 167.9
10-K Previous Year 2/25/2005 2/28/2005 12/31/2004 ############# ############# ############# ############# ############# ############# ############# ############# #############
Net Sales $27,433.0 $10,469.5 $4,841.2
Gross Profit 6,495.0 2,568.1 2,434.5
SG&A 5,073.0 2,414.7 1,876.2 0.0 0.0 0.0 0.0 0.0 0.0 0.0 0.0 0.0
Reported EBIT 1,422.0 92.8 558.3
Reported NI 934.0 64.4 337.2
D&A 481.0 153.9 101.4
Non-Recurring Oper. Exp. (Inc.) 0.0 60.6 0.0
Final EBIT 1,422.0 153.4 558.3 0.0 0.0 0.0 0.0 0.0 0.0 0.0 0.0 0.0
Final EBITDA 1,903.0 307.3 659.7 0.0 0.0 0.0 0.0 0.0 0.0 0.0 0.0 0.0
Non-Recurring Non-Oper. Exp. (Inc.) 0.0 0.0 0.0
Final Net Income 934.0 103.7 337.2 0.0 0.0 0.0 0.0 0.0 0.0 0.0 0.0 0.0
CapEx 502.0 162.7 226.9
LTM 8/26/2006 8/31/2006 9/30/2006 1/0/1900 1/0/1900 1/0/1900 1/0/1900 1/0/1900 1/0/1900 1/0/1900 1/0/1900 1/0/1900
Net Sales $32,590.0 $12,268.9 $4,991.3 $0.0 $0.0 $0.0 $0.0 $0.0 $0.0 $0.0 $0.0 $0.0
Gross Profit 8,124.0 2,979.6 2,254.9 0.0 0.0 0.0 0.0 0.0 0.0 0.0 0.0 0.0
SG&A 5,808.0 2,505.6 1,984.4 0.0 0.0 0.0 0.0 0.0 0.0 0.0 0.0 0.0
Reported EBIT 1,811.0 258.0 93.5 0.0 0.0 0.0 0.0 0.0 0.0 0.0 0.0 0.0
Reported NI 1,246.0 175.5 43.0 0.0 0.0 0.0 0.0 0.0 0.0 0.0 0.0 0.0
D&A 505.0 174.5 129.7 0.0 0.0 0.0 0.0 0.0 0.0 0.0 0.0 0.0
Non-Recurring Oper. Exp. (Inc.) 0.0 41.5 47.3 0.0 0.0 0.0 0.0 0.0 0.0 0.0 0.0 0.0
Final EBIT 1,811.0 299.5 140.8 0.0 0.0 0.0 0.0 0.0 0.0 0.0 0.0 0.0
Final EBITDA 2,316.0 474.0 270.5 0.0 0.0 0.0 0.0 0.0 0.0 0.0 0.0 0.0
Non-Recurring Non-Oper. Exp. (Inc.) 0.0 0.0 0.0 0.0 0.0 0.0 0.0 0.0 0.0 0.0 0.0 0.0
Final Net Income 1,246.0 202.5 73.7 0.0 0.0 0.0 0.0 0.0 0.0 0.0 0.0 0.0
CapEx 709.0 202.7 108.6 0.0 0.0 0.0 0.0 0.0 0.0 0.0 0.0 0.0
Kaufman
Brothers_10250
Kaufman
Brothers_10250
Kaufman
Brothers_10250
2007P FYE 2006P
Sales $35,430.0 $12,951.0 $4,919.7
EBIT 2,119.0 333.4 177.8
EBITDA 2,571.0 501.2 307.2
EPS $2.88 $1.31 $0.72
CapEx 770.8 213.9 107.0
2008P FYE 2007P
Sales $42,426.0 $14,231.3 $5,076.2
EBIT 2,554.0 467.2 269.5
EBITDA 3,006.0 635.0 397.5
EPS $3.30 $1.79 $1.08
CapEx 923.0 235.1 110.4
Convertible Debt
Amount Outstanding $402.00 $0.00 $0.00
Conversion Price $46.00 $0.00 $0.00
Number of Shares 8.7 0.0 0.0 0.0 0.0 0.0 0.0 0.0 0.0 0.0 0.0 0.0
Amount of Debt to Subtract from Net Debt (402.0) 0.0 0.0 0.0 0.0 0.0 0.0 0.0 0.0 0.0 0.0 0.0
Amount of Shares to add to FD Shares 8.7 0.0 0.0 0.0 0.0 0.0 0.0 0.0 0.0 0.0 0.0 0.0
Preferred Equity - Convertible
Amount Outstanding $0.00 $0.00 $0.00 $0.00 $0.00 $0.00 $0.00 $0.00 $0.00 $0.00 $0.00 $0.00
Conversion Price $0.00 $0.00 $0.00 $0.00 $0.00 $0.00 $0.00 $0.00 $0.00 $0.00 $0.00 $0.00
Number of Common Shares 0.0 0.0 0.0 0.0 0.0 0.0 0.0 0.0 0.0 0.0 0.0 0.0
Amount of Debt to Subtract from Net Debt 0.0 0.0 0.0 0.0 0.0 0.0 0.0 0.0 0.0 0.0 0.0 0.0
Amount of Shares to add to FD Shares 0.0 0.0 0.0 0.0 0.0 0.0 0.0 0.0 0.0 0.0 0.0 0.0
Number of Options Exercisable
A 19.60 0.37 2.44
B 0.98 4.31
C 1.75 1.84
D 0.25 3.91
E 0.50 4.93
F 0.83
G 0.12
H 4.08
I 1.10
Weighted Average Strike Price
A $26.60 $5.69 $19.88
B $7.40 $27.39
C $8.32 $31.29
D $10.06 $38.35
E $12.27 $47.10
F $14.43 $34.79
G $15.66
H $23.46
I $27.20
Calculation
A 10.1 0.3 0.0 0.0 0.0 0.0 0.0 0.0 0.0 0.0 0.0 0.0
B 0.0 0.7 0.0 0.0 0.0 0.0 0.0 0.0 0.0 0.0 0.0 0.0
C 0.0 1.1 0.0 0.0 0.0 0.0 0.0 0.0 0.0 0.0 0.0 0.0
D 0.0 0.1 0.0 0.0 0.0 0.0 0.0 0.0 0.0 0.0 0.0 0.0
E 0.0 0.2 0.0 0.0 0.0 0.0 0.0 0.0 0.0 0.0 0.0 0.0
F 0.0 0.3 0.0 0.0 0.0 0.0 0.0 0.0 0.0 0.0 0.0 0.0
G 0.0 0.0 0.0 0.0 0.0 0.0 0.0 0.0 0.0 0.0 0.0 0.0
H 0.0 0.0 0.0 0.0 0.0 0.0 0.0 0.0 0.0 0.0 0.0 0.0
I 0.0 0.0 0.0 0.0 0.0 0.0 0.0 0.0 0.0 0.0 0.0 0.0
Sum 18.8 2.8 0.0 0.0 0.0 0.0 0.0 0.0 0.0 0.0 0.0 0.0
EPS 5 Yr Growth
FX Country
USD / FX
Precedent Transactions - Consumer Electronics | Retail
($ in millions)
Announce Target LTM Transaction Implied TEV /
Date Acquiror Target Target Description Revenue EBITDA Value Revenue EBITDA
02/22/06 Best Buy Co. (1) Pacific Sales & Kitchen Privately owned retailer of high-end
home improvement products that
perates 14 showrooms in Southern
California
$431.6 $58.6 $410.0 0.95x 7.00x
04/17/05 GameStop Corp. (2) Electronics Boutique Leading global specialty retailer of video
game hardware, software and related
accessories.
1,989.4 116.8 1,210.4 0.61x 10.4x
02/15/05 Highfields Capital
Management
Circuit City Stores National retailer of brand-name
consumer electronics, PCs and
entertainment software.
10,154.0 253.0 2,576.7 0.25x 10.2x
Median 0.61x 10.2x
Mean 0.60x 9.2x
Source:
(1) Best Buy Co. Press Release
(2) GameStop's 8K as of April 18, 2005, including Electronics Boutique's 10K as of January 29, 2005.
(3) Circuit City's 10Q as of November 30, 2004 and 10K as of February 29, 2004, including a Boston Business Journal article as of February 15, 2005.
Discounted Cash Flow (DCF) Analysis
BEST BUY CO. - EXAMPLE ONLY
Fiscal Year Ending ($MMs) 02/25/06 02/25/07 02/25/08 02/25/09 02/25/10 02/25/11
Revenue $30,848 $35,430 $42,426 $48,790 $56,108 $64,525
EBITDA $2,571 $3,006 $3,684 $4,236 $4,872
EBIT $2,119 $2,554 $2,927 $3,367 $3,871
Less: Estimated Taxes at 35% 742 894 1,025 1,178 1,355
Tax-effected EBIT $1,377 $1,660 $1,903 $2,188 $2,516
Plus: D&A 452 452 756 870 1,000
Less: CapEx (771) (923) (921) (1,059) (1,218)
Less: Changes in Working Capital (458) (700) (636) (732) (842)
Free Cash Flow $600 $490 $1,102 $1,267 $1,457
Assumed Tansaction Date of 11/20/06
PV of FCF @ a Discount Rate of 11% $584 $429 $870 $901 $933
Assumed EBITDA Exit Multiple of 9.0x
PV of Terminal Value of $28,084
TEV - Sensitivity Analysis Terminal EBITDA Multiple
$31,801 7.0x 8.0x 9.0x 10.0x 11.0x
9.0% 27,503 30,875 34,247 37,619 40,992
10.0% 26,508 29,752 32,995 36,238 39,482
11.0% 25,560 28,680 31,801 34,921 38,042
12.0% 24,655 27,658 30,661 33,664 36,667
13.0% 23,790 26,682 29,573 32,464 35,356
Source:
Discount
Rate
Links to 'Comp Spread' Tab
Discounted Cash Flow (DCF) Analysis - Project AC/DC
THERE SHOULD BE NO HARDCODES ON THIS TAB
Fiscal Year Ending ($MMs) 02/25/06 02/25/07 02/25/08 02/25/09 02/25/10 02/25/11
Revenue $185.7 $222.8 $267.4 $320.9 $385.1 $462.1
EBITDA $22.3 $26.7 $32.1 $38.5 $46.2
EBIT $20.1 $24.1 $28.9 $34.7 $41.6
Less: Estimated Taxes at 0% 7.0 8.4 10.1 12.1 14.6
Tax-effected EBIT $13.0 $15.6 $18.8 $22.5 $27.0
Plus: D&A 2.2 2.7 3.2 3.9 4.6
Less: CapEx (11.1) (13.4) (16.0) (19.3) (23.1)
Less: Changes in Working Capital 1.1 (0.8) (1.6) (2.2) (2.8)
Free Cash Flow $5.2 $4.2 $4.3 $4.9 $5.7
Assumed Tansaction Date of 11/20/06
PV of FCF @ a Discount Rate of 21% $4.9 $3.3 $2.8 $2.6 $2.5
Assumed EBITDA Exit Multiple of 8.5x
PV of Terminal Value of $174
TEV - Sensitivity Analysis Terminal EBITDA Multiple
$190 6.5x 7.5x 8.5x 9.5x 10.5x
19.0% 159.7 181.7 203.7 225.7 247.7
20.0% 154.4 175.6 196.8 218.1 239.3
21.0% 149.3 169.8 190.3 210.8 231.3
22.0% 144.5 164.3 184.0 203.8 223.6
23.0% 139.8 158.9 178.0 197.1 216.2
Source:
Discount
Rate
Weighted Average Cost of Capital (WACC) Analysis
($ in millions)
Comparable Companies
Market Debt to Preferred to Equity to
Preferred Value of Total Debt to Total Total Total
Debt Stock Equity Capitalization Equity Capitalization Capitalization Capitalization
Best Buy Co., Inc. $680.0 $0.0 $27,262.9 $27,942.9 2.5% 2.4% 0.0% 97.6%
Circuit City Stores, Inc. 87.0 0.0 4,191.8 4,278.9 2.1% 2.0% 0.0% 98.0%
RadioShack Corp. 610.0 0.0 2,428.5 3,038.5 25.1% 20.1% 0.0% 79.9%
Median $610.0 $0.0 $4,191.8 $4,278.9 2.5% 2.4% 0.0% 97.6%
Mean $459.0 $0.0 $11,294.4 $11,753.4 #DIV/0! 8.2% 0.0% 91.8%
Decile Adjusted Equity Size
Levered Unlevered Based Unlevered Risk Risk Cost of Cost of Cost of
Beta Beta Beta Beta Premium (1) Premium (1) Equity Debt Preferred WACC
Best Buy Co., Inc. 1.05 1.03 0.91 1.60 6.3% -0.37% 10.8% 4.7% 0.0% 10.7%
Circuit City Stores, Inc. 0.12 0.12 1.10 0.15 6.3% 0.75% 6.1% 5.4% 0.0% 6.1%
RadioShack Corp. 1.09 0.94 1.13 1.17 6.3% 1.07% 12.5% 6.8% 0.0% 10.9%
Median 1.05 0.94 1.10 1.17 10.8% 5.4% 0.0% 10.7%
Mean 0.75 0.70 1.05 0.97 9.8% 5.6% 0.0% 9.2%
Footnotes:
Source: Company filings, equity analyst research and Bloomberg.
Weighted Average Cost of Capital (WACC) = (Cost of Debt * (1-Tax Rate) * Debt to Enterprise Value) + (Cost of Equity * Equity to Enterprise Value)
+ (Cost of Preferred * Preferred to Enterprise Value).
Cost of Equity = Risk Free Rate + (Levered Beta * Equity Risk Premium) + Size Risk Premium.
Risk-free rate as of November 20, 2006.
(1) Ibbotson Associates, Stocks Bonds Bills and Inflation 2005 Yearbook, pp. 138, 140, 169, and 179.
Weighted Average Cost of Capital (WACC) Analysis (cont.)
Project AC/DC
Market Assumptions Beta Assumptions Capital Structure Assumptions
20-Year Treasury Bond Yield 4.6% Company Specific Decile Beta 1.41 Preferred to Enterprise Value 0.0%
Equity Risk Premium (1) 6.30% Selected Adjusted Unlevered Beta 1.17 Debt to Enterprise Value 2.4%
Size Risk Premium (1) 6.41% Levered Beta 1.19 Equity to Enterprise Value 97.6%
Company Specific Risk Premium 3.00% Cost of Debt 9.0%
Tax Rate 35.0% Cost of Preferred 0.0%
Cost of Equity 21.5%
Concluded Weighted Average Cost of Capital 21.1%
Footnotes:
Source: Company filings, equity analyst research and Bloomberg.
Weighted Average Cost of Capital (WACC) = (Cost of Debt * (1-Tax Rate) * Debt to Enterprise Value) + (Cost of Equity * Equity to Enterprise Value)
+ (Cost of Preferred * Preferred to Enterprise Value).
Cost of Equity = Risk Free Rate + (Levered Beta * Equity Risk Premium) + Size Risk Premium.
Risk-free rate as of November 20, 2006.
(1) Ibbotson Associates, Stocks Bonds Bills and Inflation 2005 Yearbook, pp. 138, 140, 169, and 179.

More Related Content

More from Flevy.com Best Practices

[Whitepaper] 5 Dimensions of Employee Engagement Scorecard
[Whitepaper] 5 Dimensions of Employee Engagement Scorecard[Whitepaper] 5 Dimensions of Employee Engagement Scorecard
[Whitepaper] 5 Dimensions of Employee Engagement ScorecardFlevy.com Best Practices
 
[Whitepaper] Digital Transformation: Workforce Digitization
[Whitepaper] Digital Transformation: Workforce Digitization[Whitepaper] Digital Transformation: Workforce Digitization
[Whitepaper] Digital Transformation: Workforce DigitizationFlevy.com Best Practices
 
[Whitepaper] Strategic Human Resources: Evolution of Competition
[Whitepaper] Strategic Human Resources: Evolution of Competition[Whitepaper] Strategic Human Resources: Evolution of Competition
[Whitepaper] Strategic Human Resources: Evolution of CompetitionFlevy.com Best Practices
 
[Whitepaper] 8 Key Steps of Data Integration: Restructuring Redeployment Asse...
[Whitepaper] 8 Key Steps of Data Integration: Restructuring Redeployment Asse...[Whitepaper] 8 Key Steps of Data Integration: Restructuring Redeployment Asse...
[Whitepaper] 8 Key Steps of Data Integration: Restructuring Redeployment Asse...Flevy.com Best Practices
 
[Whitepaper] Strategy Classics: Value Disciplines Model
[Whitepaper] Strategy Classics: Value Disciplines Model[Whitepaper] Strategy Classics: Value Disciplines Model
[Whitepaper] Strategy Classics: Value Disciplines ModelFlevy.com Best Practices
 
[Whitepaper] The Definitive Guide to Strategic Planning: Here’s What You Need...
[Whitepaper] The Definitive Guide to Strategic Planning: Here’s What You Need...[Whitepaper] The Definitive Guide to Strategic Planning: Here’s What You Need...
[Whitepaper] The Definitive Guide to Strategic Planning: Here’s What You Need...Flevy.com Best Practices
 
[Whitepaper] The Definitive Introduction to Strategy Development and Strategy...
[Whitepaper] The Definitive Introduction to Strategy Development and Strategy...[Whitepaper] The Definitive Introduction to Strategy Development and Strategy...
[Whitepaper] The Definitive Introduction to Strategy Development and Strategy...Flevy.com Best Practices
 
[Whitepaper] The “Theory of Constraints:” What’s Limiting Your Organization?
[Whitepaper] The “Theory of Constraints:” What’s Limiting Your Organization?[Whitepaper] The “Theory of Constraints:” What’s Limiting Your Organization?
[Whitepaper] The “Theory of Constraints:” What’s Limiting Your Organization?Flevy.com Best Practices
 
[Whitepaper] Transportation Cost Reduction in Supply Chain Management
[Whitepaper] Transportation Cost Reduction in Supply Chain Management[Whitepaper] Transportation Cost Reduction in Supply Chain Management
[Whitepaper] Transportation Cost Reduction in Supply Chain ManagementFlevy.com Best Practices
 
[Whitepaper] A Great Leadership Experience: Dr. Rachid Yazami, Inventor of th...
[Whitepaper] A Great Leadership Experience: Dr. Rachid Yazami, Inventor of th...[Whitepaper] A Great Leadership Experience: Dr. Rachid Yazami, Inventor of th...
[Whitepaper] A Great Leadership Experience: Dr. Rachid Yazami, Inventor of th...Flevy.com Best Practices
 
[Whitepaper] Finding It Hard to Manage Conflict at the Workplace? Use the Tho...
[Whitepaper] Finding It Hard to Manage Conflict at the Workplace? Use the Tho...[Whitepaper] Finding It Hard to Manage Conflict at the Workplace? Use the Tho...
[Whitepaper] Finding It Hard to Manage Conflict at the Workplace? Use the Tho...Flevy.com Best Practices
 
[Whitepaper] Key Account Management: Handling Large Global Accounts the Right...
[Whitepaper] Key Account Management: Handling Large Global Accounts the Right...[Whitepaper] Key Account Management: Handling Large Global Accounts the Right...
[Whitepaper] Key Account Management: Handling Large Global Accounts the Right...Flevy.com Best Practices
 
[Whitepaper] Nudge Theory: An Effective Way to Transform Negative Behaviors
[Whitepaper] Nudge Theory: An Effective Way to Transform Negative Behaviors[Whitepaper] Nudge Theory: An Effective Way to Transform Negative Behaviors
[Whitepaper] Nudge Theory: An Effective Way to Transform Negative BehaviorsFlevy.com Best Practices
 
[Whitepaper] Business Model Innovation: Creation of Scalable Business Models ...
[Whitepaper] Business Model Innovation: Creation of Scalable Business Models ...[Whitepaper] Business Model Innovation: Creation of Scalable Business Models ...
[Whitepaper] Business Model Innovation: Creation of Scalable Business Models ...Flevy.com Best Practices
 
[Whitepaper] Shareholder Value Traps: How to Evade Them and Focus on Value Cr...
[Whitepaper] Shareholder Value Traps: How to Evade Them and Focus on Value Cr...[Whitepaper] Shareholder Value Traps: How to Evade Them and Focus on Value Cr...
[Whitepaper] Shareholder Value Traps: How to Evade Them and Focus on Value Cr...Flevy.com Best Practices
 
Six Sigma - Statistical Process Control (SPC)
Six Sigma - Statistical Process Control (SPC)Six Sigma - Statistical Process Control (SPC)
Six Sigma - Statistical Process Control (SPC)Flevy.com Best Practices
 
Lean Six Sigma - Process Risk Analysis (FMEA)
Lean Six Sigma - Process Risk Analysis (FMEA)Lean Six Sigma - Process Risk Analysis (FMEA)
Lean Six Sigma - Process Risk Analysis (FMEA)Flevy.com Best Practices
 
Effective Staff Suggestion System (Kaizen Teian)
Effective Staff Suggestion System (Kaizen Teian)Effective Staff Suggestion System (Kaizen Teian)
Effective Staff Suggestion System (Kaizen Teian)Flevy.com Best Practices
 

More from Flevy.com Best Practices (20)

[Whitepaper] 5 Dimensions of Employee Engagement Scorecard
[Whitepaper] 5 Dimensions of Employee Engagement Scorecard[Whitepaper] 5 Dimensions of Employee Engagement Scorecard
[Whitepaper] 5 Dimensions of Employee Engagement Scorecard
 
[Whitepaper] Digital Transformation: Workforce Digitization
[Whitepaper] Digital Transformation: Workforce Digitization[Whitepaper] Digital Transformation: Workforce Digitization
[Whitepaper] Digital Transformation: Workforce Digitization
 
[Whitepaper] Strategic Human Resources: Evolution of Competition
[Whitepaper] Strategic Human Resources: Evolution of Competition[Whitepaper] Strategic Human Resources: Evolution of Competition
[Whitepaper] Strategic Human Resources: Evolution of Competition
 
[Whitepaper] 8 Key Steps of Data Integration: Restructuring Redeployment Asse...
[Whitepaper] 8 Key Steps of Data Integration: Restructuring Redeployment Asse...[Whitepaper] 8 Key Steps of Data Integration: Restructuring Redeployment Asse...
[Whitepaper] 8 Key Steps of Data Integration: Restructuring Redeployment Asse...
 
[Whitepaper] Strategy Classics: Value Disciplines Model
[Whitepaper] Strategy Classics: Value Disciplines Model[Whitepaper] Strategy Classics: Value Disciplines Model
[Whitepaper] Strategy Classics: Value Disciplines Model
 
[Whitepaper] The Definitive Guide to Strategic Planning: Here’s What You Need...
[Whitepaper] The Definitive Guide to Strategic Planning: Here’s What You Need...[Whitepaper] The Definitive Guide to Strategic Planning: Here’s What You Need...
[Whitepaper] The Definitive Guide to Strategic Planning: Here’s What You Need...
 
[Whitepaper] The Definitive Introduction to Strategy Development and Strategy...
[Whitepaper] The Definitive Introduction to Strategy Development and Strategy...[Whitepaper] The Definitive Introduction to Strategy Development and Strategy...
[Whitepaper] The Definitive Introduction to Strategy Development and Strategy...
 
[Whitepaper] The “Theory of Constraints:” What’s Limiting Your Organization?
[Whitepaper] The “Theory of Constraints:” What’s Limiting Your Organization?[Whitepaper] The “Theory of Constraints:” What’s Limiting Your Organization?
[Whitepaper] The “Theory of Constraints:” What’s Limiting Your Organization?
 
[Whitepaper] Transportation Cost Reduction in Supply Chain Management
[Whitepaper] Transportation Cost Reduction in Supply Chain Management[Whitepaper] Transportation Cost Reduction in Supply Chain Management
[Whitepaper] Transportation Cost Reduction in Supply Chain Management
 
[Whitepaper] A Great Leadership Experience: Dr. Rachid Yazami, Inventor of th...
[Whitepaper] A Great Leadership Experience: Dr. Rachid Yazami, Inventor of th...[Whitepaper] A Great Leadership Experience: Dr. Rachid Yazami, Inventor of th...
[Whitepaper] A Great Leadership Experience: Dr. Rachid Yazami, Inventor of th...
 
[Whitepaper] Finding It Hard to Manage Conflict at the Workplace? Use the Tho...
[Whitepaper] Finding It Hard to Manage Conflict at the Workplace? Use the Tho...[Whitepaper] Finding It Hard to Manage Conflict at the Workplace? Use the Tho...
[Whitepaper] Finding It Hard to Manage Conflict at the Workplace? Use the Tho...
 
[Whitepaper] Key Account Management: Handling Large Global Accounts the Right...
[Whitepaper] Key Account Management: Handling Large Global Accounts the Right...[Whitepaper] Key Account Management: Handling Large Global Accounts the Right...
[Whitepaper] Key Account Management: Handling Large Global Accounts the Right...
 
[Whitepaper] Nudge Theory: An Effective Way to Transform Negative Behaviors
[Whitepaper] Nudge Theory: An Effective Way to Transform Negative Behaviors[Whitepaper] Nudge Theory: An Effective Way to Transform Negative Behaviors
[Whitepaper] Nudge Theory: An Effective Way to Transform Negative Behaviors
 
[Whitepaper] Business Model Innovation: Creation of Scalable Business Models ...
[Whitepaper] Business Model Innovation: Creation of Scalable Business Models ...[Whitepaper] Business Model Innovation: Creation of Scalable Business Models ...
[Whitepaper] Business Model Innovation: Creation of Scalable Business Models ...
 
[Whitepaper] Shareholder Value Traps: How to Evade Them and Focus on Value Cr...
[Whitepaper] Shareholder Value Traps: How to Evade Them and Focus on Value Cr...[Whitepaper] Shareholder Value Traps: How to Evade Them and Focus on Value Cr...
[Whitepaper] Shareholder Value Traps: How to Evade Them and Focus on Value Cr...
 
The Top 101 Consulting Frameworks of 2020
The Top 101 Consulting Frameworks of 2020The Top 101 Consulting Frameworks of 2020
The Top 101 Consulting Frameworks of 2020
 
Six Sigma - Statistical Process Control (SPC)
Six Sigma - Statistical Process Control (SPC)Six Sigma - Statistical Process Control (SPC)
Six Sigma - Statistical Process Control (SPC)
 
Lean Six Sigma - Process Risk Analysis (FMEA)
Lean Six Sigma - Process Risk Analysis (FMEA)Lean Six Sigma - Process Risk Analysis (FMEA)
Lean Six Sigma - Process Risk Analysis (FMEA)
 
Lean Manufacturing
Lean ManufacturingLean Manufacturing
Lean Manufacturing
 
Effective Staff Suggestion System (Kaizen Teian)
Effective Staff Suggestion System (Kaizen Teian)Effective Staff Suggestion System (Kaizen Teian)
Effective Staff Suggestion System (Kaizen Teian)
 

Recently uploaded

Monthly Social Media Update April 2024 pptx.pptx
Monthly Social Media Update April 2024 pptx.pptxMonthly Social Media Update April 2024 pptx.pptx
Monthly Social Media Update April 2024 pptx.pptxAndy Lambert
 
9599632723 Top Call Girls in Delhi at your Door Step Available 24x7 Delhi
9599632723 Top Call Girls in Delhi at your Door Step Available 24x7 Delhi9599632723 Top Call Girls in Delhi at your Door Step Available 24x7 Delhi
9599632723 Top Call Girls in Delhi at your Door Step Available 24x7 DelhiCall Girls in Delhi
 
B.COM Unit – 4 ( CORPORATE SOCIAL RESPONSIBILITY ( CSR ).pptx
B.COM Unit – 4 ( CORPORATE SOCIAL RESPONSIBILITY ( CSR ).pptxB.COM Unit – 4 ( CORPORATE SOCIAL RESPONSIBILITY ( CSR ).pptx
B.COM Unit – 4 ( CORPORATE SOCIAL RESPONSIBILITY ( CSR ).pptxpriyanshujha201
 
Ensure the security of your HCL environment by applying the Zero Trust princi...
Ensure the security of your HCL environment by applying the Zero Trust princi...Ensure the security of your HCL environment by applying the Zero Trust princi...
Ensure the security of your HCL environment by applying the Zero Trust princi...Roland Driesen
 
Enhancing and Restoring Safety & Quality Cultures - Dave Litwiller - May 2024...
Enhancing and Restoring Safety & Quality Cultures - Dave Litwiller - May 2024...Enhancing and Restoring Safety & Quality Cultures - Dave Litwiller - May 2024...
Enhancing and Restoring Safety & Quality Cultures - Dave Litwiller - May 2024...Dave Litwiller
 
Famous Olympic Siblings from the 21st Century
Famous Olympic Siblings from the 21st CenturyFamous Olympic Siblings from the 21st Century
Famous Olympic Siblings from the 21st Centuryrwgiffor
 
A305_A2_file_Batkhuu progress report.pdf
A305_A2_file_Batkhuu progress report.pdfA305_A2_file_Batkhuu progress report.pdf
A305_A2_file_Batkhuu progress report.pdftbatkhuu1
 
Lucknow 💋 Escorts in Lucknow - 450+ Call Girl Cash Payment 8923113531 Neha Th...
Lucknow 💋 Escorts in Lucknow - 450+ Call Girl Cash Payment 8923113531 Neha Th...Lucknow 💋 Escorts in Lucknow - 450+ Call Girl Cash Payment 8923113531 Neha Th...
Lucknow 💋 Escorts in Lucknow - 450+ Call Girl Cash Payment 8923113531 Neha Th...anilsa9823
 
VIP Call Girls Gandi Maisamma ( Hyderabad ) Phone 8250192130 | ₹5k To 25k Wit...
VIP Call Girls Gandi Maisamma ( Hyderabad ) Phone 8250192130 | ₹5k To 25k Wit...VIP Call Girls Gandi Maisamma ( Hyderabad ) Phone 8250192130 | ₹5k To 25k Wit...
VIP Call Girls Gandi Maisamma ( Hyderabad ) Phone 8250192130 | ₹5k To 25k Wit...Suhani Kapoor
 
Value Proposition canvas- Customer needs and pains
Value Proposition canvas- Customer needs and painsValue Proposition canvas- Customer needs and pains
Value Proposition canvas- Customer needs and painsP&CO
 
KYC-Verified Accounts: Helping Companies Handle Challenging Regulatory Enviro...
KYC-Verified Accounts: Helping Companies Handle Challenging Regulatory Enviro...KYC-Verified Accounts: Helping Companies Handle Challenging Regulatory Enviro...
KYC-Verified Accounts: Helping Companies Handle Challenging Regulatory Enviro...Any kyc Account
 
Call Girls Navi Mumbai Just Call 9907093804 Top Class Call Girl Service Avail...
Call Girls Navi Mumbai Just Call 9907093804 Top Class Call Girl Service Avail...Call Girls Navi Mumbai Just Call 9907093804 Top Class Call Girl Service Avail...
Call Girls Navi Mumbai Just Call 9907093804 Top Class Call Girl Service Avail...Dipal Arora
 
HONOR Veterans Event Keynote by Michael Hawkins
HONOR Veterans Event Keynote by Michael HawkinsHONOR Veterans Event Keynote by Michael Hawkins
HONOR Veterans Event Keynote by Michael HawkinsMichael W. Hawkins
 
Grateful 7 speech thanking everyone that has helped.pdf
Grateful 7 speech thanking everyone that has helped.pdfGrateful 7 speech thanking everyone that has helped.pdf
Grateful 7 speech thanking everyone that has helped.pdfPaul Menig
 
Pharma Works Profile of Karan Communications
Pharma Works Profile of Karan CommunicationsPharma Works Profile of Karan Communications
Pharma Works Profile of Karan Communicationskarancommunications
 
Mysore Call Girls 8617370543 WhatsApp Number 24x7 Best Services
Mysore Call Girls 8617370543 WhatsApp Number 24x7 Best ServicesMysore Call Girls 8617370543 WhatsApp Number 24x7 Best Services
Mysore Call Girls 8617370543 WhatsApp Number 24x7 Best ServicesDipal Arora
 
7.pdf This presentation captures many uses and the significance of the number...
7.pdf This presentation captures many uses and the significance of the number...7.pdf This presentation captures many uses and the significance of the number...
7.pdf This presentation captures many uses and the significance of the number...Paul Menig
 
Regression analysis: Simple Linear Regression Multiple Linear Regression
Regression analysis:  Simple Linear Regression Multiple Linear RegressionRegression analysis:  Simple Linear Regression Multiple Linear Regression
Regression analysis: Simple Linear Regression Multiple Linear RegressionRavindra Nath Shukla
 

Recently uploaded (20)

Monthly Social Media Update April 2024 pptx.pptx
Monthly Social Media Update April 2024 pptx.pptxMonthly Social Media Update April 2024 pptx.pptx
Monthly Social Media Update April 2024 pptx.pptx
 
VVVIP Call Girls In Greater Kailash ➡️ Delhi ➡️ 9999965857 🚀 No Advance 24HRS...
VVVIP Call Girls In Greater Kailash ➡️ Delhi ➡️ 9999965857 🚀 No Advance 24HRS...VVVIP Call Girls In Greater Kailash ➡️ Delhi ➡️ 9999965857 🚀 No Advance 24HRS...
VVVIP Call Girls In Greater Kailash ➡️ Delhi ➡️ 9999965857 🚀 No Advance 24HRS...
 
9599632723 Top Call Girls in Delhi at your Door Step Available 24x7 Delhi
9599632723 Top Call Girls in Delhi at your Door Step Available 24x7 Delhi9599632723 Top Call Girls in Delhi at your Door Step Available 24x7 Delhi
9599632723 Top Call Girls in Delhi at your Door Step Available 24x7 Delhi
 
B.COM Unit – 4 ( CORPORATE SOCIAL RESPONSIBILITY ( CSR ).pptx
B.COM Unit – 4 ( CORPORATE SOCIAL RESPONSIBILITY ( CSR ).pptxB.COM Unit – 4 ( CORPORATE SOCIAL RESPONSIBILITY ( CSR ).pptx
B.COM Unit – 4 ( CORPORATE SOCIAL RESPONSIBILITY ( CSR ).pptx
 
Ensure the security of your HCL environment by applying the Zero Trust princi...
Ensure the security of your HCL environment by applying the Zero Trust princi...Ensure the security of your HCL environment by applying the Zero Trust princi...
Ensure the security of your HCL environment by applying the Zero Trust princi...
 
Enhancing and Restoring Safety & Quality Cultures - Dave Litwiller - May 2024...
Enhancing and Restoring Safety & Quality Cultures - Dave Litwiller - May 2024...Enhancing and Restoring Safety & Quality Cultures - Dave Litwiller - May 2024...
Enhancing and Restoring Safety & Quality Cultures - Dave Litwiller - May 2024...
 
Famous Olympic Siblings from the 21st Century
Famous Olympic Siblings from the 21st CenturyFamous Olympic Siblings from the 21st Century
Famous Olympic Siblings from the 21st Century
 
A305_A2_file_Batkhuu progress report.pdf
A305_A2_file_Batkhuu progress report.pdfA305_A2_file_Batkhuu progress report.pdf
A305_A2_file_Batkhuu progress report.pdf
 
Lucknow 💋 Escorts in Lucknow - 450+ Call Girl Cash Payment 8923113531 Neha Th...
Lucknow 💋 Escorts in Lucknow - 450+ Call Girl Cash Payment 8923113531 Neha Th...Lucknow 💋 Escorts in Lucknow - 450+ Call Girl Cash Payment 8923113531 Neha Th...
Lucknow 💋 Escorts in Lucknow - 450+ Call Girl Cash Payment 8923113531 Neha Th...
 
Forklift Operations: Safety through Cartoons
Forklift Operations: Safety through CartoonsForklift Operations: Safety through Cartoons
Forklift Operations: Safety through Cartoons
 
VIP Call Girls Gandi Maisamma ( Hyderabad ) Phone 8250192130 | ₹5k To 25k Wit...
VIP Call Girls Gandi Maisamma ( Hyderabad ) Phone 8250192130 | ₹5k To 25k Wit...VIP Call Girls Gandi Maisamma ( Hyderabad ) Phone 8250192130 | ₹5k To 25k Wit...
VIP Call Girls Gandi Maisamma ( Hyderabad ) Phone 8250192130 | ₹5k To 25k Wit...
 
Value Proposition canvas- Customer needs and pains
Value Proposition canvas- Customer needs and painsValue Proposition canvas- Customer needs and pains
Value Proposition canvas- Customer needs and pains
 
KYC-Verified Accounts: Helping Companies Handle Challenging Regulatory Enviro...
KYC-Verified Accounts: Helping Companies Handle Challenging Regulatory Enviro...KYC-Verified Accounts: Helping Companies Handle Challenging Regulatory Enviro...
KYC-Verified Accounts: Helping Companies Handle Challenging Regulatory Enviro...
 
Call Girls Navi Mumbai Just Call 9907093804 Top Class Call Girl Service Avail...
Call Girls Navi Mumbai Just Call 9907093804 Top Class Call Girl Service Avail...Call Girls Navi Mumbai Just Call 9907093804 Top Class Call Girl Service Avail...
Call Girls Navi Mumbai Just Call 9907093804 Top Class Call Girl Service Avail...
 
HONOR Veterans Event Keynote by Michael Hawkins
HONOR Veterans Event Keynote by Michael HawkinsHONOR Veterans Event Keynote by Michael Hawkins
HONOR Veterans Event Keynote by Michael Hawkins
 
Grateful 7 speech thanking everyone that has helped.pdf
Grateful 7 speech thanking everyone that has helped.pdfGrateful 7 speech thanking everyone that has helped.pdf
Grateful 7 speech thanking everyone that has helped.pdf
 
Pharma Works Profile of Karan Communications
Pharma Works Profile of Karan CommunicationsPharma Works Profile of Karan Communications
Pharma Works Profile of Karan Communications
 
Mysore Call Girls 8617370543 WhatsApp Number 24x7 Best Services
Mysore Call Girls 8617370543 WhatsApp Number 24x7 Best ServicesMysore Call Girls 8617370543 WhatsApp Number 24x7 Best Services
Mysore Call Girls 8617370543 WhatsApp Number 24x7 Best Services
 
7.pdf This presentation captures many uses and the significance of the number...
7.pdf This presentation captures many uses and the significance of the number...7.pdf This presentation captures many uses and the significance of the number...
7.pdf This presentation captures many uses and the significance of the number...
 
Regression analysis: Simple Linear Regression Multiple Linear Regression
Regression analysis:  Simple Linear Regression Multiple Linear RegressionRegression analysis:  Simple Linear Regression Multiple Linear Regression
Regression analysis: Simple Linear Regression Multiple Linear Regression
 

Valuation Model (DCF)

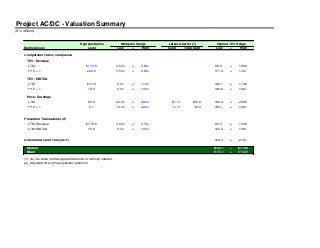
  • 1. Project AC/DC - Valuation Summary ($ in millions) Representative Multiples Range Latest Quarter (1) Implied TEV Range Methodology Level Low -- High Cash Total Debt Low -- High Comparable Public Companies TEV / Revenue LTM $176.6 0.50x -- 0.60x 88.3 -- 106.0 FYE + 1 222.8 0.50x -- 0.60x 111.4 -- 133.7 TEV / EBITDA LTM $15.8 9.0x -- 11.0x 142.1 -- 173.6 FYE + 1 18.6 8.0x -- 10.0x 148.6 -- 185.7 Price / Earnings LTM $6.8 24.0x -- 28.0x $17.0 $36.9 182.4 -- 209.5 FYE + 1 8.1 18.0x -- 22.0x 17.0 36.9 165.7 -- 198.1 Precedent Transactions (2) LTM Revenue $176.6 0.60x -- 0.70x 88.3 -- 103.0 LTM EBITDA 15.8 9.5x -- 10.5x 125.0 -- 138.1 Discounted Cash Flow (DCF) 164.3 -- 218.1 Median $142.1 -- $173.6 Mean $135.1 -- $162.9 (1) AC/DC does not have preferred stock or minority interest. (2) Adjusted for a 20% acquisition premium.
  • 2. Comparable Public Companies Analysis ($ in millions) Comparable Companies - Consumer Electronics | Retail THERE SHOULD BE NO HARDCODES ON THIS TAB Multiples Analysis Share Price % of 52- Market Enterprise TEV / Revenue TEV / EBITDA Price / Earnings Company Name Ticker 11/20/2006 week High Capitalization Value Cash Debt LTM FYE+1 LTM FYE+1 LTM FYE+1 Best Buy Co., Inc. BBY $54.63 8.2% $27,262.9 $24,903.9 $2,668.0 $680.0 0.76x 0.70x 10.8x 9.7x 21.9x 19.0x Circuit City Stores, Inc. CC 23.55 25.3% 4,191.8 3,679.3 599.6 87.0 0.30x 0.28x 7.8x 7.3x 20.7x 18.0x RadioShack Corp. RSH 17.88 25.3% 2,428.5 2,762.1 276.4 610.0 0.55x 0.56x 10.2x 9.0x 32.9x 24.9x Median 25.3% $4,191.8 $3,679.3 $599.6 $610.0 0.55x 0.56x 10.2x 9.0x 21.9x 19.0x Mean 19.6% $11,294.4 $10,448.4 $1,181.3 $459.0 0.54x 0.52x 9.6x 8.7x 25.2x 20.6x Margins Analysis Revenue Growth EBITDA Growth EPS Growth LTM CapEx % EBIT Margin EBITDA Margin Net Margin Company Name FYE '05-06 FYE '06-07 FYE '05-06 FYE '06-07 FYE '05-06 FYE '06-07 of Revenue LTM FYE+1 LTM FYE+1 LTM FYE+1 Best Buy Co., Inc. 12.4% 14.9% 10.6% 22.2% 22.1% 26.1% 2.2% 5.6% 6.0% 7.1% 7.3% 3.8% 4.1% Circuit City Stores, Inc. 10.8% 11.7% 36.9% 19.1% 68.6% 33.3% 1.7% 2.4% 2.6% 3.9% 3.9% 1.7% 2.0% RadioShack Corp. 5.0% -3.2% -28.2% -35.1% -20.0% -63.8% 2.2% 2.8% 3.6% 5.4% 6.2% 1.5% 2.0% Median 10.8% 11.7% 10.6% 19.1% 22.1% 26.1% 2.2% 2.8% 3.6% 5.4% 6.2% 1.7% 2.0% Mean 9.4% 7.8% 6.4% 2.0% 23.6% -1.5% 2.0% 3.6% 4.1% 5.5% 5.8% 2.3% 2.7% Source: Company filings, Yahoo! Finance, equity analyst research and press releases.
  • 3. Effective Tax Rate 35% FYE - 1 2005 FY + 1 2007P Stock Valuation Date 11/20/2006 FYE 2006 FY + 2 2008P Ticker BBY CC RSH Name Best Buy Co., Inc. Circuit City Stores, Inc. RadioShack Corp. Company Name Company Name Company Name Company Name Company Name Company Name Company Name Company Name Company Name Company Descriptions Best Buy Co., Inc. is a specialty retailer of consumer electronics, home- office products, entertainment software, appliances and related services. Circuit City Stores, Inc. is a national retailer of brand- name consumer electronics, personal computers (PCs) and entertainment software. RadioShack Corporation is primarily engaged in the retail sale of consumer electronic goods and services through its RadioShack store Insert Company Information Insert Company Information Insert Company Information Insert Company Information Insert Company Information Insert Company Information Insert Company Information Insert Company Information Insert Company Information Stock Price as of (11/20/06) $54.63 $23.55 $17.88 $0.00 $0.00 $0.00 $0.00 $0.00 $0.00 $0.00 $0.00 $0.00 52 Wk High $59.50 $31.54 $23.95 $0.00 $0.00 $0.00 $0.00 $0.00 $0.00 $0.00 $0.00 $0.00 52 Wk Low $42.75 $20.21 $13.73 $0.00 $0.00 $0.00 $0.00 $0.00 $0.00 $0.00 $0.00 $0.00 % Off High 8.2% 25.3% 25.3% #DIV/0! #DIV/0! #DIV/0! #DIV/0! #DIV/0! #DIV/0! #DIV/0! #DIV/0! #DIV/0! Enterprise Value $24,903.9 $3,679.3 $2,762.1 $0.0 $0.0 $0.0 $0.0 $0.0 $0.0 $0.0 $0.0 $0.0 Equity Value $27,262.9 $4,191.8 $2,428.5 $0.0 $0.0 $0.0 $0.0 $0.0 $0.0 $0.0 $0.0 $0.0 EV / Sales 0.81x 0.32x 0.54x NA NA NA NA NA NA NA NA NA EV / LTM Sales 0.76x 0.30x 0.55x NA NA NA NA NA NA NA NA NA EV / 2007P Sales 0.70x 0.28x 0.56x NA NA NA NA NA NA NA NA NA EV / 2008P Sales 0.59x 0.26x 0.54x NA NA NA NA NA NA NA NA NA EV / EBITDA 11.8x 8.7x 5.8x NA NA NA NA NA NA NA NA NA EV / LTM EBITDA 10.8x 7.8x 10.2x NA NA NA NA NA NA NA NA NA EV / 2007P EBITDA 9.7x 7.3x 9.0x NA NA NA NA NA NA NA NA NA EV / 2008P EBITDA 8.3x 5.8x 6.9x NA NA NA NA NA NA NA NA NA EV / EBIT 15.1x 14.3x 7.9x NA NA NA NA NA NA NA NA NA EV / LTM EBIT 13.8x 12.3x 19.6x NA NA NA NA NA NA NA NA NA EV / 2007P EBIT 11.8x 11.0x 15.5x NA NA NA NA NA NA NA NA NA EV / 2008P EBIT 9.8x 7.9x 10.2x NA NA NA NA NA NA NA NA NA Gross Margin 25.0% 24.4% 46.7% #DIV/0! #DIV/0! #DIV/0! #DIV/0! #DIV/0! #DIV/0! #DIV/0! #DIV/0! #DIV/0! LTM Gross Margin 24.9% 24.3% 45.2% #DIV/0! #DIV/0! #DIV/0! #DIV/0! #DIV/0! #DIV/0! #DIV/0! #DIV/0! #DIV/0! EBITDA Margin 6.8% 3.6% 9.3% NA NA NA NA NA NA NA NA NA LTM EBITDA Margin 7.1% 3.9% 5.4% NA NA NA NA NA NA NA NA NA 2007P EBITDA Margin 7.3% 3.9% 6.2% NA NA NA NA NA NA NA NA NA 2008P EBITDA Margin 7.1% 4.5% 7.8% NA NA NA NA NA NA NA NA NA EBIT Margin 5.3% 2.2% 6.9% NA NA NA NA NA NA NA NA NA LTM EBIT Margin 5.6% 2.4% 2.8% NA NA NA NA NA NA NA NA NA 2007P EBIT Margin 6.0% 2.6% 3.6% NA NA NA NA NA NA NA NA NA 2008P EBIT Margin 6.0% 3.3% 5.3% NA NA NA NA NA NA NA NA NA Other Metric Basic Shares Out. 480.3 175.2 135.8 Cash and Cash Equivalents $2,668.0 $599.6 $276.4 Total Debt on Balance Sheet 680.0 87.0 610.0 Less: Convertible Debt figured in FD Shares (402.0) 0.0 0.0 0.0 0.0 0.0 0.0 0.0 0.0 0.0 0.0 0.0 Preferred Equity 0.0 0.0 0.0 Less: Preferred Equity figured into FD Shares 0.0 0.0 0.0 0.0 0.0 0.0 0.0 0.0 0.0 0.0 0.0 0.0 Minority Interest 31.0 0.0 0.0 Net Debt ($2,359.0) ($512.6) $333.6 $0.0 $0.0 $0.0 $0.0 $0.0 $0.0 $0.0 $0.0 $0.0 Current Debt $496.0 $38.8 $265.3 Total Current Liabilities 6,366.0 1,729.3 923.3 Total Current Assets 7,887.0 2,844.5 1,488.1 Net Working Capital ($651.0) $554.4 $553.7 $0.0 $0.0 $0.0 $0.0 $0.0 $0.0 $0.0 $0.0 $0.0 Shareholders' Equity $5,434.0 $1,915.3 $600.9 Total Assets $12,407.0 $4,129.9 $1,984.5 F.D. Shares Outstanding 499.0 178.0 135.8 0.0 0.0 0.0 0.0 0.0 0.0 0.0 0.0 0.0 Equity Value $27,262.9 $4,191.8 $2,428.5 $0.0 $0.0 $0.0 $0.0 $0.0 $0.0 $0.0 $0.0 $0.0 Net Debt (2,359.0) (512.6) 333.6 0.0 0.0 0.0 0.0 0.0 0.0 0.0 0.0 0.0 Enterprise Value $24,903.9 $3,679.3 $2,762.1 $0.0 $0.0 $0.0 $0.0 $0.0 $0.0 $0.0 $0.0 $0.0
  • 4. 10-Q Current 8/26/2006 8/31/2006 9/30/2006 Net Sales $14,562.0 $5,456.2 $3,319.4 Gross Profit 3,667.0 1,316.2 1,568.0 SG&A 3,000.0 1,292.7 1,509.6 0.0 0.0 0.0 0.0 0.0 0.0 0.0 0.0 0.0 Reported EBIT 667.0 14.1 11.1 Reported NI 464.0 16.4 (11.1) D&A 267.0 91.0 97.5 Non-Recurring Oper. Exp. (Inc.) 0.0 9.5 47.3 Final EBIT 667.0 23.6 58.4 0.0 0.0 0.0 0.0 0.0 0.0 0.0 0.0 0.0 Final EBITDA 934.0 114.6 155.9 0.0 0.0 0.0 0.0 0.0 0.0 0.0 0.0 0.0 Non-Recurring Non-Oper. Exp. (Inc.) 0.0 0.0 0.0 Final Net Income 464.0 22.6 19.6 0.0 0.0 0.0 0.0 0.0 0.0 0.0 0.0 0.0 CapEx 299.0 102.9 62.4 10-Q Previous Year 8/26/2005 8/31/2005 9/30/2005 ############# ############# ############# ############# ############# ############# ############# ############# ############# Net Sales $12,820.0 $4,784.9 $3,409.8 Gross Profit 3,269.0 1,167.5 1,688.5 SG&A 2,769.0 1,186.5 1,421.0 0.0 0.0 0.0 0.0 0.0 0.0 0.0 0.0 0.0 Reported EBIT 500.0 (23.6) 267.5 Reported NI 358.0 (8.0) 215.8 D&A 222.0 80.4 91.6 Non-Recurring Oper. Exp. (Inc.) 0.0 4.6 0.0 Final EBIT 500.0 (19.0) 267.5 0.0 0.0 0.0 0.0 0.0 0.0 0.0 0.0 0.0 Final EBITDA 722.0 61.4 359.1 0.0 0.0 0.0 0.0 0.0 0.0 0.0 0.0 0.0 Non-Recurring Non-Oper. Exp. (Inc.) 0.0 0.0 0.0 Final Net Income 358.0 (5.0) 215.8 0.0 0.0 0.0 0.0 0.0 0.0 0.0 0.0 0.0 CapEx 238.0 99.4 121.7 Current 10-K 2/25/2006 2/28/2006 12/31/2005 Net Sales $30,848.0 $11,597.7 $5,081.7 Gross Profit 7,726.0 2,830.9 2,375.4 SG&A 6,082.0 2,573.9 2,025.5 0.0 0.0 0.0 0.0 0.0 0.0 0.0 0.0 0.0 Reported EBIT 1,644.0 220.4 349.9 Reported NI 1,140.00 151.11 269.90 D&A 460.0 163.8 123.8 Non-Recurring Oper. Exp. (Inc.) 0.0 36.6 Final EBIT 1,644.0 257.0 349.9 0.0 0.0 0.0 0.0 0.0 0.0 0.0 0.0 0.0 Final EBITDA 2,104.0 420.8 473.7 0.0 0.0 0.0 0.0 0.0 0.0 0.0 0.0 0.0 Non-Recurring Non-Oper. Exp. (Inc.) 0.0 0.0 0.0 Final Net Income 1,140.0 174.9 269.9 0.0 0.0 0.0 0.0 0.0 0.0 0.0 0.0 0.0 CapEx 648.0 199.1 167.9 10-K Previous Year 2/25/2005 2/28/2005 12/31/2004 ############# ############# ############# ############# ############# ############# ############# ############# ############# Net Sales $27,433.0 $10,469.5 $4,841.2 Gross Profit 6,495.0 2,568.1 2,434.5 SG&A 5,073.0 2,414.7 1,876.2 0.0 0.0 0.0 0.0 0.0 0.0 0.0 0.0 0.0 Reported EBIT 1,422.0 92.8 558.3 Reported NI 934.0 64.4 337.2 D&A 481.0 153.9 101.4 Non-Recurring Oper. Exp. (Inc.) 0.0 60.6 0.0 Final EBIT 1,422.0 153.4 558.3 0.0 0.0 0.0 0.0 0.0 0.0 0.0 0.0 0.0 Final EBITDA 1,903.0 307.3 659.7 0.0 0.0 0.0 0.0 0.0 0.0 0.0 0.0 0.0 Non-Recurring Non-Oper. Exp. (Inc.) 0.0 0.0 0.0 Final Net Income 934.0 103.7 337.2 0.0 0.0 0.0 0.0 0.0 0.0 0.0 0.0 0.0 CapEx 502.0 162.7 226.9 LTM 8/26/2006 8/31/2006 9/30/2006 1/0/1900 1/0/1900 1/0/1900 1/0/1900 1/0/1900 1/0/1900 1/0/1900 1/0/1900 1/0/1900 Net Sales $32,590.0 $12,268.9 $4,991.3 $0.0 $0.0 $0.0 $0.0 $0.0 $0.0 $0.0 $0.0 $0.0 Gross Profit 8,124.0 2,979.6 2,254.9 0.0 0.0 0.0 0.0 0.0 0.0 0.0 0.0 0.0 SG&A 5,808.0 2,505.6 1,984.4 0.0 0.0 0.0 0.0 0.0 0.0 0.0 0.0 0.0 Reported EBIT 1,811.0 258.0 93.5 0.0 0.0 0.0 0.0 0.0 0.0 0.0 0.0 0.0 Reported NI 1,246.0 175.5 43.0 0.0 0.0 0.0 0.0 0.0 0.0 0.0 0.0 0.0 D&A 505.0 174.5 129.7 0.0 0.0 0.0 0.0 0.0 0.0 0.0 0.0 0.0 Non-Recurring Oper. Exp. (Inc.) 0.0 41.5 47.3 0.0 0.0 0.0 0.0 0.0 0.0 0.0 0.0 0.0 Final EBIT 1,811.0 299.5 140.8 0.0 0.0 0.0 0.0 0.0 0.0 0.0 0.0 0.0 Final EBITDA 2,316.0 474.0 270.5 0.0 0.0 0.0 0.0 0.0 0.0 0.0 0.0 0.0 Non-Recurring Non-Oper. Exp. (Inc.) 0.0 0.0 0.0 0.0 0.0 0.0 0.0 0.0 0.0 0.0 0.0 0.0 Final Net Income 1,246.0 202.5 73.7 0.0 0.0 0.0 0.0 0.0 0.0 0.0 0.0 0.0 CapEx 709.0 202.7 108.6 0.0 0.0 0.0 0.0 0.0 0.0 0.0 0.0 0.0 Kaufman Brothers_10250 Kaufman Brothers_10250 Kaufman Brothers_10250 2007P FYE 2006P Sales $35,430.0 $12,951.0 $4,919.7 EBIT 2,119.0 333.4 177.8 EBITDA 2,571.0 501.2 307.2 EPS $2.88 $1.31 $0.72 CapEx 770.8 213.9 107.0 2008P FYE 2007P Sales $42,426.0 $14,231.3 $5,076.2 EBIT 2,554.0 467.2 269.5 EBITDA 3,006.0 635.0 397.5 EPS $3.30 $1.79 $1.08 CapEx 923.0 235.1 110.4
  • 5. Convertible Debt Amount Outstanding $402.00 $0.00 $0.00 Conversion Price $46.00 $0.00 $0.00 Number of Shares 8.7 0.0 0.0 0.0 0.0 0.0 0.0 0.0 0.0 0.0 0.0 0.0 Amount of Debt to Subtract from Net Debt (402.0) 0.0 0.0 0.0 0.0 0.0 0.0 0.0 0.0 0.0 0.0 0.0 Amount of Shares to add to FD Shares 8.7 0.0 0.0 0.0 0.0 0.0 0.0 0.0 0.0 0.0 0.0 0.0 Preferred Equity - Convertible Amount Outstanding $0.00 $0.00 $0.00 $0.00 $0.00 $0.00 $0.00 $0.00 $0.00 $0.00 $0.00 $0.00 Conversion Price $0.00 $0.00 $0.00 $0.00 $0.00 $0.00 $0.00 $0.00 $0.00 $0.00 $0.00 $0.00 Number of Common Shares 0.0 0.0 0.0 0.0 0.0 0.0 0.0 0.0 0.0 0.0 0.0 0.0 Amount of Debt to Subtract from Net Debt 0.0 0.0 0.0 0.0 0.0 0.0 0.0 0.0 0.0 0.0 0.0 0.0 Amount of Shares to add to FD Shares 0.0 0.0 0.0 0.0 0.0 0.0 0.0 0.0 0.0 0.0 0.0 0.0 Number of Options Exercisable A 19.60 0.37 2.44 B 0.98 4.31 C 1.75 1.84 D 0.25 3.91 E 0.50 4.93 F 0.83 G 0.12 H 4.08 I 1.10 Weighted Average Strike Price A $26.60 $5.69 $19.88 B $7.40 $27.39 C $8.32 $31.29 D $10.06 $38.35 E $12.27 $47.10 F $14.43 $34.79 G $15.66 H $23.46 I $27.20 Calculation A 10.1 0.3 0.0 0.0 0.0 0.0 0.0 0.0 0.0 0.0 0.0 0.0 B 0.0 0.7 0.0 0.0 0.0 0.0 0.0 0.0 0.0 0.0 0.0 0.0 C 0.0 1.1 0.0 0.0 0.0 0.0 0.0 0.0 0.0 0.0 0.0 0.0 D 0.0 0.1 0.0 0.0 0.0 0.0 0.0 0.0 0.0 0.0 0.0 0.0 E 0.0 0.2 0.0 0.0 0.0 0.0 0.0 0.0 0.0 0.0 0.0 0.0 F 0.0 0.3 0.0 0.0 0.0 0.0 0.0 0.0 0.0 0.0 0.0 0.0 G 0.0 0.0 0.0 0.0 0.0 0.0 0.0 0.0 0.0 0.0 0.0 0.0 H 0.0 0.0 0.0 0.0 0.0 0.0 0.0 0.0 0.0 0.0 0.0 0.0 I 0.0 0.0 0.0 0.0 0.0 0.0 0.0 0.0 0.0 0.0 0.0 0.0 Sum 18.8 2.8 0.0 0.0 0.0 0.0 0.0 0.0 0.0 0.0 0.0 0.0 EPS 5 Yr Growth FX Country USD / FX
  • 6. Precedent Transactions - Consumer Electronics | Retail ($ in millions) Announce Target LTM Transaction Implied TEV / Date Acquiror Target Target Description Revenue EBITDA Value Revenue EBITDA 02/22/06 Best Buy Co. (1) Pacific Sales & Kitchen Privately owned retailer of high-end home improvement products that perates 14 showrooms in Southern California $431.6 $58.6 $410.0 0.95x 7.00x 04/17/05 GameStop Corp. (2) Electronics Boutique Leading global specialty retailer of video game hardware, software and related accessories. 1,989.4 116.8 1,210.4 0.61x 10.4x 02/15/05 Highfields Capital Management Circuit City Stores National retailer of brand-name consumer electronics, PCs and entertainment software. 10,154.0 253.0 2,576.7 0.25x 10.2x Median 0.61x 10.2x Mean 0.60x 9.2x Source: (1) Best Buy Co. Press Release (2) GameStop's 8K as of April 18, 2005, including Electronics Boutique's 10K as of January 29, 2005. (3) Circuit City's 10Q as of November 30, 2004 and 10K as of February 29, 2004, including a Boston Business Journal article as of February 15, 2005.
  • 7. Discounted Cash Flow (DCF) Analysis BEST BUY CO. - EXAMPLE ONLY Fiscal Year Ending ($MMs) 02/25/06 02/25/07 02/25/08 02/25/09 02/25/10 02/25/11 Revenue $30,848 $35,430 $42,426 $48,790 $56,108 $64,525 EBITDA $2,571 $3,006 $3,684 $4,236 $4,872 EBIT $2,119 $2,554 $2,927 $3,367 $3,871 Less: Estimated Taxes at 35% 742 894 1,025 1,178 1,355 Tax-effected EBIT $1,377 $1,660 $1,903 $2,188 $2,516 Plus: D&A 452 452 756 870 1,000 Less: CapEx (771) (923) (921) (1,059) (1,218) Less: Changes in Working Capital (458) (700) (636) (732) (842) Free Cash Flow $600 $490 $1,102 $1,267 $1,457 Assumed Tansaction Date of 11/20/06 PV of FCF @ a Discount Rate of 11% $584 $429 $870 $901 $933 Assumed EBITDA Exit Multiple of 9.0x PV of Terminal Value of $28,084 TEV - Sensitivity Analysis Terminal EBITDA Multiple $31,801 7.0x 8.0x 9.0x 10.0x 11.0x 9.0% 27,503 30,875 34,247 37,619 40,992 10.0% 26,508 29,752 32,995 36,238 39,482 11.0% 25,560 28,680 31,801 34,921 38,042 12.0% 24,655 27,658 30,661 33,664 36,667 13.0% 23,790 26,682 29,573 32,464 35,356 Source: Discount Rate Links to 'Comp Spread' Tab
  • 8. Discounted Cash Flow (DCF) Analysis - Project AC/DC THERE SHOULD BE NO HARDCODES ON THIS TAB Fiscal Year Ending ($MMs) 02/25/06 02/25/07 02/25/08 02/25/09 02/25/10 02/25/11 Revenue $185.7 $222.8 $267.4 $320.9 $385.1 $462.1 EBITDA $22.3 $26.7 $32.1 $38.5 $46.2 EBIT $20.1 $24.1 $28.9 $34.7 $41.6 Less: Estimated Taxes at 0% 7.0 8.4 10.1 12.1 14.6 Tax-effected EBIT $13.0 $15.6 $18.8 $22.5 $27.0 Plus: D&A 2.2 2.7 3.2 3.9 4.6 Less: CapEx (11.1) (13.4) (16.0) (19.3) (23.1) Less: Changes in Working Capital 1.1 (0.8) (1.6) (2.2) (2.8) Free Cash Flow $5.2 $4.2 $4.3 $4.9 $5.7 Assumed Tansaction Date of 11/20/06 PV of FCF @ a Discount Rate of 21% $4.9 $3.3 $2.8 $2.6 $2.5 Assumed EBITDA Exit Multiple of 8.5x PV of Terminal Value of $174 TEV - Sensitivity Analysis Terminal EBITDA Multiple $190 6.5x 7.5x 8.5x 9.5x 10.5x 19.0% 159.7 181.7 203.7 225.7 247.7 20.0% 154.4 175.6 196.8 218.1 239.3 21.0% 149.3 169.8 190.3 210.8 231.3 22.0% 144.5 164.3 184.0 203.8 223.6 23.0% 139.8 158.9 178.0 197.1 216.2 Source: Discount Rate
  • 9. Weighted Average Cost of Capital (WACC) Analysis ($ in millions) Comparable Companies Market Debt to Preferred to Equity to Preferred Value of Total Debt to Total Total Total Debt Stock Equity Capitalization Equity Capitalization Capitalization Capitalization Best Buy Co., Inc. $680.0 $0.0 $27,262.9 $27,942.9 2.5% 2.4% 0.0% 97.6% Circuit City Stores, Inc. 87.0 0.0 4,191.8 4,278.9 2.1% 2.0% 0.0% 98.0% RadioShack Corp. 610.0 0.0 2,428.5 3,038.5 25.1% 20.1% 0.0% 79.9% Median $610.0 $0.0 $4,191.8 $4,278.9 2.5% 2.4% 0.0% 97.6% Mean $459.0 $0.0 $11,294.4 $11,753.4 #DIV/0! 8.2% 0.0% 91.8% Decile Adjusted Equity Size Levered Unlevered Based Unlevered Risk Risk Cost of Cost of Cost of Beta Beta Beta Beta Premium (1) Premium (1) Equity Debt Preferred WACC Best Buy Co., Inc. 1.05 1.03 0.91 1.60 6.3% -0.37% 10.8% 4.7% 0.0% 10.7% Circuit City Stores, Inc. 0.12 0.12 1.10 0.15 6.3% 0.75% 6.1% 5.4% 0.0% 6.1% RadioShack Corp. 1.09 0.94 1.13 1.17 6.3% 1.07% 12.5% 6.8% 0.0% 10.9% Median 1.05 0.94 1.10 1.17 10.8% 5.4% 0.0% 10.7% Mean 0.75 0.70 1.05 0.97 9.8% 5.6% 0.0% 9.2% Footnotes: Source: Company filings, equity analyst research and Bloomberg. Weighted Average Cost of Capital (WACC) = (Cost of Debt * (1-Tax Rate) * Debt to Enterprise Value) + (Cost of Equity * Equity to Enterprise Value) + (Cost of Preferred * Preferred to Enterprise Value). Cost of Equity = Risk Free Rate + (Levered Beta * Equity Risk Premium) + Size Risk Premium. Risk-free rate as of November 20, 2006. (1) Ibbotson Associates, Stocks Bonds Bills and Inflation 2005 Yearbook, pp. 138, 140, 169, and 179.
  • 10. Weighted Average Cost of Capital (WACC) Analysis (cont.) Project AC/DC Market Assumptions Beta Assumptions Capital Structure Assumptions 20-Year Treasury Bond Yield 4.6% Company Specific Decile Beta 1.41 Preferred to Enterprise Value 0.0% Equity Risk Premium (1) 6.30% Selected Adjusted Unlevered Beta 1.17 Debt to Enterprise Value 2.4% Size Risk Premium (1) 6.41% Levered Beta 1.19 Equity to Enterprise Value 97.6% Company Specific Risk Premium 3.00% Cost of Debt 9.0% Tax Rate 35.0% Cost of Preferred 0.0% Cost of Equity 21.5% Concluded Weighted Average Cost of Capital 21.1% Footnotes: Source: Company filings, equity analyst research and Bloomberg. Weighted Average Cost of Capital (WACC) = (Cost of Debt * (1-Tax Rate) * Debt to Enterprise Value) + (Cost of Equity * Equity to Enterprise Value) + (Cost of Preferred * Preferred to Enterprise Value). Cost of Equity = Risk Free Rate + (Levered Beta * Equity Risk Premium) + Size Risk Premium. Risk-free rate as of November 20, 2006. (1) Ibbotson Associates, Stocks Bonds Bills and Inflation 2005 Yearbook, pp. 138, 140, 169, and 179.