Hovid bhd (7213) 2015
•
0 likes•5,452 views

Stock Analysis: on historical financial result & stock valuation. Bursa Malaysia: Hovid

Recommended
More Related Content
What's hot
What's hot (20)
Similar to Hovid bhd (7213) 2015
Similar to Hovid bhd (7213) 2015 (20)
Recently uploaded
Recently uploaded (20)
Hovid bhd (7213) 2015
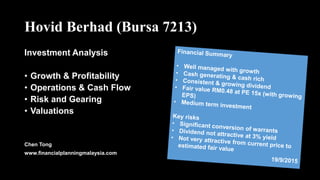
- 1. Hovid Berhad (Bursa 7213) Investment Analysis • Growth & Profitability • Operations & Cash Flow • Risk and Gearing • Valuations Chen Tong www.financialplanningmalaysia.com
- 2. • 5% YOY revenue growth since 2013 • 10% YOY net profit YOY growth • Moderate growth before GST era • Key risk: contraction in Q2 of calendar year 2015 post GST • Financial year end is 30 June 2015 • Par value at RM0.10 • RM21 million net profit FYE June 2015 • * YOY stands for year over year 249 365 153 164 173 184 188 (7) (6) 16 20 18 21 37 14 29 13 22 23 (10) 10 30 50 70 90 0 50 100 150 200 250 300 350 400 FYE 2009 FYE 2010 FYE 2011 FYE 2012 FYE 2013 FYE 2014 FYE 2015 Millions Revenue Millions Growth Trend Revenue PAT Net cash fr op. -58% 7% 5% 6% 3% -93% -358% 26% -8% 16% -61% 101% -56% 69% 8% -400% -300% -200% -100% 0% 100% 200% FYE 2011 FYE 2012 FYE 2013 FYE 2014 FYE 2015 Growth Rates Revenue Growth PAT Growth Cash fr Op Growth
- 3. • Profit margin within healthy range of 10% - 12% • Good profit margin for a listed company 5.2% 29.2% 22.9% 26.2% 22.9% 36.0% 37.4% 66.7% 64.8% 66.2% 64.2% 64.2% 9.6% 11.5% 10.0% 11.2% 0.0% 10.0% 20.0% 30.0% 40.0% 50.0% 60.0% 70.0% 80.0% FYE 2009 FYE 2010 FYE 2011 FYE 2012 FYE 2013 FYE 2014 FYE 2015 Profitability Eff. tax rate Gross Profit Margin Net profit margin
- 4. 3. Operations • Management of working is okay. • Inventory is high though consistent (5 – 6 months turnover). • Debtors is well managed. Payment to creditors seems long though. • A low & consistent IDLC usually represent well-managed operations • Consistent IDLC indicates a real & authentic net profit number (real cash generated) 70 48 38 45 38 40 51 164 83 24 30 26 26 27 (66) (67) (25) (34) (27) (25) (30) 168 64 36 40 37 42 47 (100) (50) 0 50 100 150 200 250 FYE 2009 FYE 2010 FYE 2011 FYE 2012 FYE 2013 FYE 2014 FYE 2015 Millions Inventory, debtors & creditors (MYR 'million) Trade debtors Inventory Trade creditors IDLC 377 133 169 187 165 147 146 102 48 90 100 80 81 98 151 106 180 215 171 137 165 246 64 86 90 77 84 91 0 50 100 150 200 250 300 350 400 FYE 2009 FYE 2010 FYE 2011 FYE 2012 FYE 2013 FYE 2014 FYE 2015 TurnoverinDays Inventory, debtors & creditor turnover (days) Inventory Turnover Debtor Turnover Creditor Turnover IDLC Turnover
- 5. • Operations generated cash flow • In 2015, cash generated from operations is RM23 million • Net proceed from buy & sell of investments is RM8 million • RM32 million used on capital expenditure • RM8 million paid as dividend 29 13 22 23 (5) (6) (9) (32) 0 0 (11) (8) 0 0 0 8 7 (35) (8) 10 (50) (40) (30) (20) (10) 0 10 20 30 40 50 FYE 2012 FYE 2013 FYE 2014 FYE 2015 Millions Source & Application of Cash Net cash fr op. Capex Dividend Paid Investment Net Cash/ Debt Movement
- 6. • Net cash is RM6 million • EDR with 100% equity 0% net debt. (Gearing is 0) • No borrowing risk. Can ride through bad time. 156 102 100 107 153 161 184 29% 23% 84% 80% 100% 100% 100% 71% 77% 16% 20% 0% 0% 0% 0% 10% 20% 30% 40% 50% 60% 70% 80% 90% 100% (500) (400) (300) (200) (100) 0 100 200 300 FYE 2009FYE 2010FYE 2011FYE 2012FYE 2013FYE 2014FYE 2015 MillionsEquity Debt Ratio S/hs’ equity Net Debt Equity % Debt % 23 27 23 23 (37) (8) (4) (8) (12) (10) (2) (9) (26) 9 17 6 (60) (50) (40) (30) (20) (10) 0 10 20 30 40 FYE 2012 FYE 2013 FYE 2014 FYE 2015 Millions Cash, Equivalent & Borrowings ST Investment Deposit & Cash ST Borrowings LT Borrowings Net Cash Equivalent
- 7. • 2015 price ranged between RM0.57 & RM0.32 where PERs are between 20x & 11x • This graph gives a good gauge on price range 0.31 0.28 0.29 0.28 0.39 0.57 0.21 0.12 0.18 0.20 0.23 0.32 0.26 0.20 0.24 0.24 0.31 0.44 0.18 0.23 0.22 0.23 0.37 0.49 0.13 0.13 0.14 0.20 0.21 0.24 - 0.10 0.20 0.30 0.40 0.50 0.60 FYE 2010 FYE 2011 FYE 2012 FYE 2013 FYE 2014 FYE 2015 Share Price Highest price Lowest price Average price Closing price NA/share
- 8. • With growth, 13x – 14x is a fair PER in this market conditions • A better EPS is expected in the future • At RM0.44, the dividend yield is 3.2% which is mediocre. DPS’s YOY growth is 2% since 2013 - - 14.1 10.6 16.2 20.4 - - 8.7 7.5 9.5 11.4 - - 11.4 9.1 12.9 15.9 - - 10.4 8.9 15.6 17.7 0.1000 0.1200 0.1400 0.1600 0.1800 0.2000 0.2200 0.2400 - 5.0 10.0 15.0 20.0 25.0 FYE 2010 FYE 2011 FYE 2012 FYE 2013 FYE 2014 FYE 2015 EPS PE Ratio High PE Low PE Avg PE PER EPS 4.7% 2.6% 2.4% 0.0% 0.0% 0.0% 6.7% 4.4% 4.3% 0.0% 0.0% 0.0% 5.5% 3.3% 3.1% 0.00% 0.00% 0.00% 5.65% 2.70% 2.76% 0.0130 0.0100 0.0135 0.0000 0.0500 0.1000 0.1500 0.2000 0.2500 0.3000 0.0% 1.0% 2.0% 3.0% 4.0% 5.0% 6.0% 7.0% FYE 2010 FYE 2011 FYE 2012 FYE 2013 FYE 2014 FYE 2015 DPS Dividend Yield Low DY High DY Avg DY Div Yield DPS
- 9. • Fair price range between 0.37 – 0.46. Lower is bargain. • Dividend yield 3.0% & above which is not really attractive in current market conditions • Current price is at fair value • Wait for a while Notes: • Report dated 19 Sep 2015 (Share Price RM0.44) • Financial year end is 30 June 2015 • Par value at RM0.10 • Valuation is subjective. It changes with new information, i.e. announcements, quarterly report, conversion of warrants http://stockinvesting.financialplanningmalaysia.com/ * Dividend Growth model with dividend growth at 2% ** Based on fair price in normal market conditions when PE is 15 F'cast EPS F'cast DPS Est Growth Fair price @ PE 15 0.0321 0.0138 2.0% 0.48 Date: 19/9/2015 Price Price (MYR) PE Ratio Dividend Yield Dividend return * Capital gain ** 0.55 17.1 2.5% 4.5% -12.4% High 0.52 16.2 2.6% 4.6% -7.3% 0.49 15.2 2.8% 4.8% -1.6% 0.46 14.3 3.0% 5.0% 4.8% Fair 0.43 13.4 3.2% 5.2% 12.1% 0.40 12.4 3.4% 5.4% 20.5% 0.37 11.5 3.7% 5.7% 30.3% Bargain 0.34 10.6 4.1% 6.1% 41.8% 0.31 9.6 4.4% 6.4% 55.5% 0.28 8.7 4.9% 6.9% 72.1% 0.25 7.8 5.5% 7.5% 92.8% 0.22 6.8 6.3% 8.3% 119.1%