Investment Idea - Central Bank of India - "BUY"
•
1 like•30,826 views

Catch the latest Equity research reports from Fullerton Securities at http://www.fullertonsecurities.co.in/equity/markets/research_reports.aspx

Recommended
More Related Content
More from Fullerton Securities
More from Fullerton Securities (20)
Recently uploaded
Recently uploaded (20)
Investment Idea - Central Bank of India - "BUY"
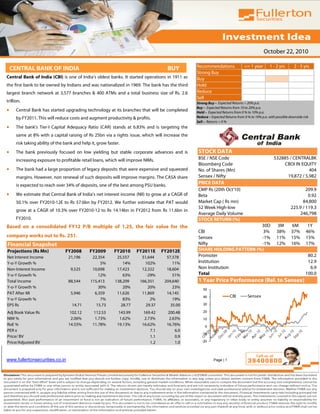
- 1. October 22, 2010 Recommendations <= 1 year 1 - 2 yrs 2 - 5 yrs CENTRAL BANK OF INDIA BUY Strong Buy Central Bank of India (CBI) is one of India’s oldest banks. It started operations in 1911 as Buy the first bank to be owned by Indians and was nationalized in 1969. The bank has the third Hold largest branch network at 3,577 branches & 400 ATMs and a total business size of Rs. 2.6 Reduce Sell trillion. Strong Buy – Expected Returns > 20% p.a. Buy – Expected Returns from 10 to 20% p.a. • Central Bank has started upgrading technology at its branches that will be completed Hold – Expected Returns from 0 % to 10% p.a. by FY2011. This will reduce costs and augment productivity & profits. Reduce – Expected Returns from 0 % to 10% p.a. with possible downside risk Sell – Returns < 0 % • The bank’s Tier-I Capital Adequacy Ratio (CAR) stands at 6.83% and is targeting the same at 8% with a capital raising of Rs 25bn via a rights issue, which will increase the risk taking ability of the bank and help it, grow faster. • The bank previously focused on low yielding but stable corporate advances and is STOCK DATA increasing exposure to profitable retail loans, which will improve NIMs. BSE / NSE Code 532885 / CENTRALBK Bloomberg Code CBOI IN EQUITY • The bank had a large proportion of legacy deposits that were expensive and squeezed No. of Shares (Mn) 404 margins. However, non renewal of such deposits will improve margins. The CASA share Sensex / Nifty 19,872 / 5,982 PRICE DATA is expected to reach over 34% of deposits, one of the best among PSU banks. CMP Rs (20th Oct’10) 209.9 • We estimate that Central Bank of India’s net interest income (NII) to grow at a CAGR of Beta 0.92 50.1% over FY2010-12E to Rs 57.6bn by FY2012. We further estimate that PAT would Market Cap ( Rs mn) 84,800 52 Week High-low 225.9 / 119.3 grow at a CAGR of 10.3% over FY2010-12 to Rs 14.14bn in FY2012 from Rs 11.6bn in Average Daily Volume 246,798 FY2010. STOCK RETURN (%) Based on a consolidated FY12 P/B multiple of 1.25, the fair value for the 30D 3M 6M 1Y CBI 3% 38% 37% 46% company works out to Rs. 251. Sensex -1% 11% 15% 15% Financial Snapshot Nifty -1% 12% 16% 17% Projections (Rs Mn) FY2008 FY2009 FY2010 FY2011E FY2012E SHARE HOLDING PATTERN (%) Net Interest Income 21,196 22,354 25,557 51,644 57,578 Promoter 80.2 Y-o-Y Growth % 5% 14% 102% 11% Institution 12.9 Non-Interest Income 9,525 10,698 17,423 12,322 18,604 Non Institution 6.9 Y-o-Y Growth % 12% 63% -29% 51% Total 100.0 Total Income 88,544 115,413 138,209 166,351 204,640 1 Year Price Performance (Rel. to Sensex) Y-o-Y Growth % 30% 20% 20% 23% 50 PAT After MI 5,946 6,359 11,626 11,869 14,145 40 CBI Sensex Y-o-Y Growth % 7% 83% 2% 19% EPS Rs 14.71 15.73 28.77 29.37 35.00 30 Adj Book Value Rs 102.12 112.53 143.99 169.42 200.48 20 NIM % 2.06% 1.73% 1.62% 2.73% 2.63% 10 RoE % 14.55% 11.78% 19.13% 16.62% 16.76% 0 PER x 7.1 6.0 -10 Price/ BV 1.1 0.9 Price/Adjusted BV 1.2 1.0 -20 www.fullertonsecurities.co.in Page | 1
- 2. October 22, 2010 BUSINESS PROFILE Central Bank of India is a Mumbai based company and one of India’s oldest banks. It is among the top 10 Indian banks in terms of asset size, which stands at Rs. 1,830 billion. The Government of India holds over 80% stake in the bank. Central Bank is among the less aggressive players in the Indian banking space. This is reflected in its low share of non-core Income, older technology and lower employee productivity compared to its PSU peers. The bank has set out to transform its business and improve performance. Corporate & Agricultural advances Among its advances, 63% are to Corporates, 17% to agriculture, 10% to retail loans and 9% to the MSMEs. Interest Income are respectively 63% contributes to 89% of revenues and fee based Income contributes to 11% of Income. The bank plans to leverage its reach with and 17% of total advances. Corporate clients & increase its fee based Income. CBI has one of the highest Provision Coverage ratios at 70.4%, higher than stipulated by RBI & better than that of its peers. Of the bank’s 3,577 branches, 39% are in rural areas, 25% in Semi urban areas and 36% in Urban and Metropolitan areas. The bank plans to open around 90 branches this year and is looking at upgradation of technology to grow its business per branch. The bank currently has 400 ATMs and is installing 495 more this year. The bank has set an ambitious target of installing 3000 ATMs by 2011, including 150 biometric ATMs in Rural Areas. Central Bank has an average age of workforce higher than its peers at 52 years and the bank has seen a negative growth in its workforce. In FY10, the workforce reduced to 34,826 employees from 35,500 employees in FY09 and over 41,000 in FY05. With technology implementation & reduction in workforce, Profits for the bank will improve The company has JV in Zambia with two other PSU banks & has two subsidiaries, one to sell Financial Products & a Housing Finance company. Going ahead, the bank plans to venture into the Life Insurance and Asset Management business. Advances by sector (FY 2010) Breakup of Branches (FY2010) 17% Corporate Agriculture Metro 63% 17% Urban 39% Retail Semi-urban 19% MSME 11% 9% Rural 25% Capital Infusion, Retail lending, Repricing deposits to boost growth & margins The company has been a laggard compared to both PSU & Private banks. The bank’s NIM was at 1.6% in FY2010 compared to 1.73% in FY2009, compared to its peers who have margins over 2.5%. This was due to lower income from Investments and high cost deposits. Over 40% of high cost deposits matured in 2009-11 and the bank did not renew them and the bank is targeting CBI’s workforce has NIMs in the range of 2.5% -2.8% for FY 2011. With a focus Retail & SME lending, the bank plans to improve its margins. declined in the past few years Also, with previous tranches of Capital Infusion and another infusion Rs. 2500 crores further planned this year; CBI will improve its ability to grow. The bank’s focus on improving the non-core income will also improve Returns on Assets which at 0.7% are among the lowest of its peers. www.fullertonsecurities.co.in Page | 2
- 3. October 22, 2010 BUSINESS PERFORMANCE Strong growth ahead, but rate hikes may again negate the reducing cost of deposits During Q1FY2010, the total business of the company was up 17%to Rs. 262,120crores. On a Y-o-Y basis, the cost of deposits was down to 5.45 % from 6.46%, NIMs improved to 2.86% from 1.84% & Cost to Income improved to 51% from NII to grow at a CAGR of 63%. Total deposits increased by 13% & CASA deposits consisted of 34.16% of total deposits, while Gross Advances 50% over FY2010-12E increased by 23%, with higher growth in the retail segment. Gross NPAs were at 2.43%, while Net NPAs were 0.77%. Lower Coverage at 68.75% this quarter will be compensated with a higher coverage the next quarter. The management has targeted to achieve Gross NPAs of 2% and Net NPAs of 0.7% by March 2011. Strong Income Growth & Improving Margins Advances & Deposits (Rs Bn) 80,000 3.0% 2,500 70,000 2.5% 2,000 60,000 2.0% 50,000 1,500 Rs mn 40,000 1.5% 30,000 1,000 1.0% 20,000 0.5% 500 10,000 0 0.0% 0 FY2008 FY2009 FY2010 FY2011E FY2012E FY2008 FY2009 FY2010 FY2011E FY2012E Operating Income Net Interest Income NIM Advances Deposits Peer Group Comparsion NIM Net NPA P/Adj BV Companies Total Income RoE % ROA % CMP FV Margins % Ratio % (x) CBI 138,209 1.6% 0.7% 19% 1.6% 1.46 209.85 10 Union Bank 153,954 2.4% 0.8% 26% 1.3% 2.54 394.40 10 IDBI 178,695 1.1% 1.0% 13% 0.5% 1.65 166.20 10 * FY10 figures Peer Comparison Compared to its peers, Central Bank has a higher NIM & Returns than IDBI, but poorer than that of Union bank. This is due to IDBI’s heavy reliance on Corporate Accounts. Union bank has a better diversified business model than both the Attractively valued at banks. This is also reflected in the Returns between the trio, where the ranking is similar. The NPAs of CBI are high nearly 1 time its FY12 because of the high agricultural exposure. Book Value Going ahead, with a change in tactics by both IDBI & CBI, we expect CBI’s performance to improve on a faster rate than IDBI’s, because of CBIs larger bank reach and high CASA deposits. www.fullertonsecurities.co.in Page | 3
- 4. October 22, 2010 VALUATION We estimate that Central Bank of India’s net interest income (NII) to grow at a CAGR of 50.1% over FY2010-12E Based on a consolidated to Rs 57.6bn by FY2012. We further estimate that PAT would grow at a CAGR of 10.3% over FY2010-12 to Rs FY12 P/B multiple of 1.25, 14.14bn in FY2012 from Rs 11.6bn in FY2010. the fair value for the company works out to Rs 251. Based on a consolidated FY12 P/B multiple of 1.25, the fair value for the company works out to Rs 251. We recommend a ‘BUY’ rating on the stock. Financial Analysis and Projections Particulars (Rs Mn) FY2008 FY2009 FY2010 FY2011E FY2012E Interest Earned 79,019 104,716 120,787 154,029 186,036 Interest Expenditure 57,823 82,362 95,230 102,385 128,458 Net Interest Income 21,196 22,354 25,557 51,644 57,578 Other Income 9,525 10,698 17,423 12,322 18,604 Total income 88,544 115,413 138,209 166,351 204,640 Non-Interest Expense 15,772 17,005 20,085 32,346 39,068 Provisions & Contingencies 5,998 6,792 7,281 13,619 15,662 Less: Tax 3,032 3,551 4,954 6,120 7,294 PAT after MI 5,946 6,359 11,626 11,869 14,145 EPS (Rs) 14.71 15.73 28.77 29.37 35.00 Adjusted Book Value (Rs) 102.12 112.53 143.99 169.42 200.48 Net Interest Margin (%) 2.06% 1.73% 1.62% 2.73% 2.63% RoA (%) 0.55% 0.47% 0.70% 0.61% 0.65% RoE (%) 14.55% 11.78% 19.13% 16.62% 16.76% Valuation Ratios (x) FY2011E FY2012E P/E 7.1 6.0 Price/ BV 1.10 0.93 Price/Adjusted BV 1.24 1.05 www.fullertonsecurities.co.in Page | 4
- 5. October 22, 2010 Board of Directors Director Name Current Position Description Shri. S. Sridhar is Chairman of the Board, Managing Director of Central Bank Of India. He is a Banker with about 36 years professional experience in commercial and development banking. His aim is to transform Central Bank of India into a techno-savy Bank, a market-responsive, customer oriented, problemsolving institution. He has educated at Indian Institute of Technology, Delhi and at Jamanalal Bajaj Institute of Management Studies, Mumbai. He is also a Certified Associate of Indian Institute of Bankers. He was the Lord Aldington Banking Research Fellow for the year 1984, S. Sridhar Chairman & MD working in UK and France. He has been an invited speaker/ panelist at national and international Conferences including UNCTAS, UN Habitat, UNESCAP, OECD. Shri S. Sridhar has been the Chairman & Managing Director of National Housing Bank (NHB), India, since April 2006, a position, which he continues to hold. Prior to joining NHB, he was Executive Director and Chief Operating Officer of Exim Bank of India for about 5 years and worked in other capacities for about 16 years. He had earlier worked in State Bank of India for about 12 years. Shri S. Sridhar is a director on National Housing Bank, Centbank Financial & Custodial Services Ltd and Indo Zambia Bank Ltd., Zambia. Major (Retd.) Ved Prakash is Part-Time Non-Official Director of Central Bank Of India since October 20, 2009. He was a Part-Time Non-Official Independent Director of the Bank from October 6, 2005 to May 10, 2008. He holds a master’s Ved Prakash Part Time Non Official Director degree in arts from the Osmania University and Diploma in Business and Advance Intelligent course. He was formerly an officer in the Indian Army. Shri. Romesh Sabharwal is Part-Time Non-Official Director of Central Bank of India since October 6 2009. He was a Part- Time Non-Official Independent Director of the Bank from March 3, 2006 to March 2009. He holds a bachelor’s degree Romesh Sabharwal Part Time Non Official Director in arts from the Sikkim Municipal University and a diploma in engineering from the Bombay University. He is a businessman. Dr. Shashank Saksena is Director - Representative of Government of India for Central Bank Of India. He is a Post Graduate in Economics, Science and a degree in Law having wide experience in the Department of Financial Services, Ministry of Finance. He has completed Doctorate in Philosophy. He is in Indian Economic Service cadre, presently Sashank Saxena Director, Representative of GOI working as Director, Ministry of Finance, in the rank of Joint Secretary. He is also a Director representing Government of India in Industrial Investment Bank of India Ltd. and the department of Insurance and Credit Guarantee Corporation. He was Director (B.O.ll & Pension) in Ministry of Finance and Department of Financial Services. He is presently Director of Industrial Investment Bank of India and DICGC. Shri. Brijlal Kshatriya is Shareholder Director of Central Bank Of India. He is a specialist in Management of Steel Plant and has training experience in works and HR functions in India and abroad. He has served in top administration of Brijlal Kshatriya Shareholder Director different plants of SAIL, ultimately taking charge as MD of Bokaro Steel Plant. He has won Rajiv Gandhi Excellence Award in 1993, Mother India International Award from NRI World in Dec. 1993 and Glory of India International Award of India in Dec.1993. Professor N. Balakrishnan is a Shareholder Director of Central Bank Of India. He is a scientist of highest international repute. He is a BE (in Electronic curriculum) from University of Madras with Ph.D from Indian Institute of Sciences in 1979. He is currently Associate Director of Indian Institute of Sciences and a Professor at the Department of Aerospace N. Balakrishnan Shareholder Director Engineering. He played a crucial role in building India’s first Super Computer Centre. He has over 200 publications to his credit in the International journals and Conferences. He is the recipient of “Padmashree’ award from President of India in 2002, Homi J Bhabha Award for Applied Science in 2004. J C Bose National Fellowship in 2007. Shri. M. S. Johar is Part-Time Non-Official Director under Chartered Accountant category of Central Bank Of India. He M. Johar Part Time Non Official Director has a bachelors degree in Arts and he is a qualified Chartered Accountant. Salim Gangadharan RBI Nominee Director Salim Gangadharan represents RBI on the Board of CBI B. Rambabu Workmen Employee Director B. Rambabu represents the Workmen on the Board of CBI since 2010 V. Iyer Executive Director V. Iyer is an Executive Director on the Board of CBI since 2010 R. Dubey Executive Director R. Dubey is an Executive Director on the Board of CBI since 2010 www.fullertonsecurities.co.in Page | 5