Industrial production down by 0.8% in euro area
•
0 recomendaciones•168 vistas

2016-11-14 Eurostat

Recomendados
Recomendados
Más contenido relacionado
La actualidad más candente
La actualidad más candente (6)
Destacado
Destacado (20)
Similar a Industrial production down by 0.8% in euro area
Similar a Industrial production down by 0.8% in euro area (20)
Más de Giuseppe Fumagalli
Más de Giuseppe Fumagalli (20)
Último
Último (20)
Industrial production down by 0.8% in euro area
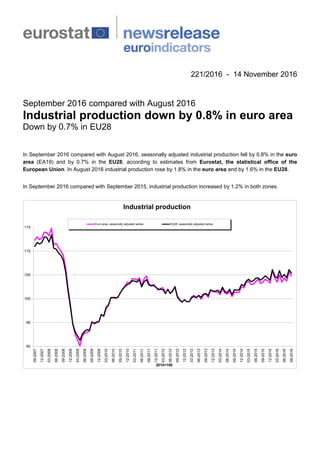
- 1. 221/2016 - 14 November 2016 September 2016 compared with August 2016 Industrial production down by 0.8% in euro area Down by 0.7% in EU28 In September 2016 compared with August 2016, seasonally adjusted industrial production fell by 0.8% in the euro area (EA19) and by 0.7% in the EU28, according to estimates from Eurostat, the statistical office of the European Union. In August 2016 industrial production rose by 1.8% in the euro area and by 1.6% in the EU28. In September 2016 compared with September 2015, industrial production increased by 1.2% in both zones. 90 95 100 105 110 115 09-2007 12-2007 03-2008 06-2008 09-2008 12-2008 03-2009 06-2009 09-2009 12-2009 03-2010 06-2010 09-2010 12-2010 03-2011 06-2011 09-2011 12-2011 03-2012 06-2012 09-2012 12-2012 03-2013 06-2013 09-2013 12-2013 03-2014 06-2014 09-2014 12-2014 03-2015 06-2015 09-2015 12-2015 03-2016 06-2016 09-2016 2010=100 Industrial production Euro area, seasonally adjusted series EU28, seasonally adjusted series
- 2. Monthly comparison by main industrial grouping and by Member State The decrease of 0.8% in industrial production in the euro area in September 2016, compared with August 2016, is due to production of durable consumer goods falling by 5.6%, capital goods by 2.2%, intermediate goods by 0.7% and energy by 0.2%, while production of non-durable consumer goods rose by 0.3%. In the EU28, the decrease of 0.7% is due to production of durable consumer goods falling by 3.7%, capital goods by 1.6%, energy by 0.6%, non-durable consumer goods by 0.4% and intermediate goods by 0.1%. Among Member States for which data are available, the largest decreases in industrial production were registered in Denmark (-8.1%), Germany (-1.9%) and Greece (-1.8%), and the highest increases in Sweden (+7.6%), Ireland (+6.4%) and Estonia (+5.2%). Annual comparison by main industrial grouping and by Member State The increase of 1.2% in industrial production in the euro area in September 2016, compared with September 2015, is due to production of non-durable consumer goods rising by 1.9%, intermediate goods by 1.3%, capital goods by 1.2% and energy by 0.7%, while production of durable consumer goods fell by 0.2%. In the EU28, the increase of 1.2% is due to production of intermediate goods rising by 1.6%, capital goods by 1.5%, durable consumer goods by 0.9% and non-durable consumer goods by 0.8%, while production of energy fell by 0.1%. Among Member States for which data are available, the highest increases in industrial production were registered in Lithuania (+7.9%), Slovenia (+7.4%) and Estonia (+6.5%). Decreases were registered in Denmark (-3.2%), France (-1.0%) and Ireland (-0.9%). Geographical information The euro area (EA19) includes Belgium, Germany, Estonia, Ireland, Greece, Spain, France, Italy, Cyprus, Latvia, Lithuania, Luxembourg, Malta, the Netherlands, Austria, Portugal, Slovenia, Slovakia and Finland. The European Union (EU28) includes Belgium, Bulgaria, the Czech Republic, Denmark, Germany, Estonia, Ireland, Greece, Spain, France, Croatia, Italy, Cyprus, Latvia, Lithuania, Luxembourg, Hungary, Malta, the Netherlands, Austria, Poland, Portugal, Romania, Slovenia, Slovakia, Finland, Sweden and the United Kingdom. Methods and definitions The index of industrial production measures the evolution of the volume of production for industry excluding construction, based on data adjusted for calendar and seasonal effects. Seasonally adjusted euro area and EU series are calculated by aggregating the seasonally adjusted national data. Eurostat carries out the seasonal adjustment of the data for those countries that do not adjust their data for seasonal effects. Total industry covers NACE rev.2 sections B to D. Missing observations from Member States for recent months are estimated for the calculation of the euro area and the EU aggregates. Revisions and timetable Compared with data issued in the News Release 194/2016 of 12 October 2016, the monthly percentage changes for August 2016 have been revised from +1.6% to +1.8% in the euro area and from +1.4% to +1.6% in the EU28. The annual percentage changes have been revised from +1.8% to +2.2% in the euro area and from +1.8% to +2.1% in the EU28. For more information Eurostat's database section on short-term business statistics Eurostat's Statistics Explained article on the industrial production index The weights of the Member States in the EU and euro area aggregates (See file EU-28_EA-19_NEWS_RELEASE_WEIGHTINGS_2010) Eurostat's €-indicators release calendar Issued by: Eurostat Press Office Tim ALLEN Tel: +352-4301-33 444 eurostat-pressoffice@ec.europa.eu ec.europa.eu/eurostat/ For further information on data: Marko CIP Tel: +352-4301-34 858 marko.cip@ec.europa.eu @EU_Eurostat Media requests: Eurostat media support / Tel: +352-4301-33 408 / eurostat-media-support@ec.europa.eu
- 3. Industrial production % change compared with previous month* Apr-16 May-16 Jun-16 Jul-16 Aug-16 Sep-16 EA19 Total industry 1.4 -1.4 0.9 -0.7 1.8 -0.8 Intermediate goods 0.6 -0.3 -0.3 -0.3 1.8 -0.7 Energy 0.4 -2.8 -0.3 0.9 2.5 -0.2 Capital goods 2.0 -2.4 1.7 -1.9 4.2 -2.2 Durable consumer goods 2.2 -1.8 1.1 -1.1 4.8 -5.6 Non-durable consumer goods 2.5 -0.2 0.9 0.6 -0.6 0.3 EU28 Total industry 1.5 -1.3 0.6 -0.7 1.6 -0.7 Intermediate goods 0.6 -0.4 -0.2 -0.3 1.2 -0.1 Energy 0.9 -2.2 -0.5 1.4 1.2 -0.6 Capital goods 1.9 -2.1 1.5 -2.3 4.3 -1.6 Durable consumer goods 1.7 -1.1 0.9 -0.9 3.1 -3.7 Non-durable consumer goods 3.0 -0.8 0.2 0.8 -0.5 -0.4 The source dataset is available here. Total industry Apr-16 May-16 Jun-16 Jul-16 Aug-16 Sep-16 EA19 1.4 -1.4 0.9 -0.7 1.8 -0.8 EU28 1.5 -1.3 0.6 -0.7 1.6 -0.7 Belgium 0.2 -1.5 1.5 1.5 -3.5 : Bulgaria -0.4 -1.7 3.9 -1.6 0.6 -0.3 Czech Republic -1.3 -0.2 2.3 -9.8 11.9 -1.6 Denmark 1.1 0.2 -0.3 2.1 -0.7 -8.1 Germany 0.8 -1.2 1.2 -1.8 3.4 -1.9 Estonia 5.3 -3.2 -2.0 4.6 -0.5 5.2 Ireland 21.6 -8.2 7.6 7.9 -12.9 6.4 Greece 4.0 -4.2 4.0 -0.6 0.6 -1.8 Spain -0.2 -0.6 -0.1 -0.2 2.0 -1.2 France 1.1 -0.6 -0.8 -0.5 2.2 -1.1 Croatia -3.1 -0.9 0.3 -0.5 -1.1 3.6 Italy 0.5 -0.6 -0.2 0.5 1.8 -0.8 Cyprus 1.6 -2.6 2.7 -0.1 -0.1 : Latvia -1.8 2.1 0.5 -2.1 -2.0 1.5 Lithuania -3.0 4.0 -0.5 -0.3 -0.4 3.1 Luxembourg -3.4 -0.1 3.1 -0.1 -3.0 : Hungary 5.8 -0.6 -2.3 -0.3 1.6 : Malta 1.3 0.2 -0.9 0.0 0.2 3.2 Netherlands 1.7 -5.3 1.7 -1.6 3.2 1.7 Austria 0.1 -0.6 -0.2 -0.7 1.9 : Poland 2.3 -1.1 0.4 -1.5 2.1 -0.2 Portugal 5.9 -3.8 1.9 -0.6 1.3 -1.6 Romania 2.1 -4.2 2.2 0.8 0.9 1.0 Slovenia 0.5 0.6 0.5 1.1 -0.4 1.3 Slovakia 3.9 0.1 -0.8 -17.0 28.2 : Finland 2.2 0.1 0.9 0.7 -2.9 2.7 Sweden -0.1 -2.7 -1.0 1.3 -3.8 7.6 United Kingdom 2.2 -0.7 0.0 0.1 -0.4 -0.3 Norway 0.8 -0.3 -4.0 4.1 -4.8 -5.6 * Calendar and seasonally adjusted : Data not available The source dataset is available here.
- 4. Industrial production % change compared with same month of the previous year* Apr-16 May-16 Jun-16 Jul-16 Aug-16 Sep-16 EA19 Total industry 2.0 0.4 0.8 -0.5 2.2 1.2 Intermediate goods 1.7 1.1 0.6 0.6 2.5 1.3 Energy 2.1 -1.4 -3.5 -4.7 1.1 0.7 Capital goods 3.0 -0.4 1.5 -1.4 3.4 1.2 Durable consumer goods 2.0 -1.0 0.5 1.4 4.8 -0.2 Non-durable consumer goods 1.2 0.7 1.5 1.8 0.2 1.9 EU28 Total industry 2.5 1.0 0.7 0.0 2.1 1.2 Intermediate goods 1.4 1.0 0.5 0.5 2.3 1.6 Energy 1.9 -1.8 -3.2 -3.0 0.1 -0.1 Capital goods 3.0 0.4 1.7 -0.9 4.0 1.5 Durable consumer goods 2.7 0.7 1.0 2.0 4.8 0.9 Non-durable consumer goods 2.4 1.0 1.1 1.8 0.4 0.8 The source dataset is available here. Total industry Apr-16 May-16 Jun-16 Jul-16 Aug-16 Sep-16 EA19 2.0 0.4 0.8 -0.5 2.2 1.2 EU28 2.5 1.0 0.7 0.0 2.1 1.2 Belgium 3.7 1.5 5.4 5.6 1.1 : Bulgaria 2.6 -3.4 3.9 2.3 2.5 3.4 Czech Republic 1.4 1.4 4.0 -7.6 7.7 2.7 Denmark 1.6 4.0 -1.4 7.0 1.1 -3.2 Germany 1.0 -0.2 1.1 -1.7 2.5 1.2 Estonia 0.5 -2.1 -3.6 2.2 0.9 6.5 Ireland 0.8 -0.7 1.7 5.1 -7.5 -0.9 Greece 3.4 3.4 8.0 4.7 0.1 0.1 Spain 2.8 1.1 0.3 -0.9 4.4 0.3 France 2.1 0.6 -1.3 -0.3 0.3 -1.0 Croatia 5.0 1.7 4.1 1.2 2.5 1.9 Italy 1.8 -0.6 -0.9 -0.3 4.4 1.8 Cyprus 10.2 4.5 10.7 8.1 6.0 : Latvia 0.0 5.5 7.9 2.5 -0.6 2.4 Lithuania -1.6 0.2 -1.4 -0.6 0.3 7.9 Luxembourg -1.3 -2.7 2.2 2.2 -5.2 : Hungary 5.0 4.4 -0.3 -0.1 3.5 : Malta -2.7 -3.9 -6.8 -5.3 -3.9 0.4 Netherlands 5.2 1.5 1.4 -0.4 4.3 5.2 Austria 3.7 2.4 1.5 -1.0 2.8 : Poland 5.9 3.2 3.8 0.9 5.2 3.2 Portugal 3.4 -2.0 1.3 -1.2 2.8 1.6 Romania 4.3 -1.3 -1.3 1.1 2.9 3.5 Slovenia 5.6 5.2 6.2 7.0 6.3 7.4 Slovakia 7.4 9.1 2.4 -14.0 17.5 : Finland 1.9 2.1 3.2 5.0 -1.8 3.3 Sweden 3.0 -1.9 -2.9 1.9 -6.4 1.5 United Kingdom 4.3 3.6 1.1 2.3 2.3 0.3 Norway 6.0 1.5 -5.8 0.5 -6.5 -12.5 * Calendar adjusted : Data not available The source dataset is available here.
- 5. Production indices for total industry, calendar and seasonally adjusted (base year 2010) 09/15 10/15 11/15 12/15 01/16 02/16 03/16 04/16 05/16 06/16 07/16 08/16 09/16 EA19 103.5 104.1 103.8 103.3 105.9 104.3 103.5 105.0 103.5 104.4 103.7 105.6 104.8 EU28 104.3 104.8 104.4 103.9 106.1 104.8 104.3 105.9 104.5 105.1 104.4 106.1 105.4 Belgium 103.6 104.6 107.0 102.8 108.9 107.3 106.8 107.0 105.4 107.0 108.6 104.8 : Bulgaria 109.2 110.4 110.9 112.5 113.0 113.2 112.4 111.9 110.0 114.3 112.5 113.2 112.9 Czech Republic 116.2 117.6 116.1 114.2 118.3 117.4 119.2 117.7 117.5 120.2 108.4 121.3 119.3 Denmark 104.6 101.7 100.5 104.1 107.2 106.2 106.1 107.3 107.5 107.2 109.4 108.6 99.8 Germany 108.5 108.7 108.3 108.3 111.3 110.1 109.2 110.1 108.8 110.1 108.1 111.8 109.7 Estonia 128.1 128.7 125.3 123.4 129.1 128.7 124.7 131.3 127.1 124.6 130.3 129.7 136.4 Ireland 160.7 162.3 159.3 160.2 189.3 157.8 132.1 160.6 147.5 158.7 171.3 149.2 158.7 Greece 88.7 87.4 90.7 93.0 91.6 87.5 87.2 90.7 86.9 90.4 89.9 90.4 88.8 Spain 95.3 95.5 95.4 95.4 95.2 94.8 96.1 95.9 95.3 95.2 95.0 96.9 95.7 France 101.7 102.1 101.4 100.7 101.9 100.6 100.3 101.4 100.8 100.0 99.5 101.7 100.6 Croatia 98.0 99.6 98.0 95.9 98.2 97.8 101.7 98.5 97.6 97.9 97.4 96.3 99.8 Italy 92.1 92.7 92.3 91.7 93.3 92.7 92.7 93.2 92.6 92.4 92.9 94.6 93.8 Cyprus 75.2 74.7 76.4 76.8 78.1 78.7 79.1 80.4 78.3 80.4 80.3 80.2 : Latvia 118.3 118.5 119.4 118.5 118.8 118.7 123.8 121.6 124.1 124.7 122.1 119.7 121.5 Lithuania 115.9 128.3 125.7 121.6 122.7 124.2 119.7 116.1 120.8 120.2 119.8 119.3 123.0 Luxembourg 97.5 99.8 101.5 99.1 99.3 100.3 100.2 96.8 96.7 99.7 99.6 96.6 : Hungary 122.4 123.9 122.1 121.5 121.8 120.5 118.4 125.3 124.6 121.7 121.3 123.2 : Malta 98.9 101.3 98.6 97.5 93.2 96.1 95.2 96.4 96.6 95.7 95.7 95.9 99.0 Netherlands 91.2 93.7 93.5 92.3 94.0 93.2 95.0 96.6 91.5 93.1 91.6 94.5 96.1 Austria 109.9 112.2 111.3 109.8 112.5 110.4 113.2 113.3 112.6 112.4 111.6 113.7 : Poland 119.8 120.8 121.6 122.5 122.2 122.2 121.4 124.2 122.8 123.3 121.4 123.9 123.7 Portugal 96.1 99.9 96.2 94.7 95.5 96.3 95.1 100.7 96.9 98.7 98.1 99.4 97.8 Romania 133.1 132.7 132.6 132.2 129.5 130.5 131.5 134.3 128.6 131.4 132.5 133.7 135.0 Slovenia 107.8 107.3 107.8 106.7 111.1 111.4 111.0 111.6 112.3 112.9 114.1 113.7 115.2 Slovakia 137.7 136.2 140.5 140.8 138.8 143.3 139.6 145.0 145.2 144.0 119.5 153.2 : Finland 93.8 93.4 93.7 94.8 92.9 94.9 92.8 94.8 94.9 95.8 96.5 93.7 96.2 Sweden 99.2 99.4 99.8 97.1 99.1 99.1 99.6 99.5 96.8 95.8 97.0 93.3 100.4 United Kingdom 99.4 99.5 98.7 97.6 98.4 98.3 98.8 101.0 100.3 100.3 100.4 100.0 99.7 Norway 101.2 97.0 96.7 95.9 97.1 97.4 97.2 98.0 97.7 93.8 97.6 92.9 87.7 : Data not available The source dataset is available here.
- 6. Production indices for total industry, calendar adjusted (base year 2010) 09/13 09/14 09/15 10/15 11/15 12/15 01/16 02/16 03/16 04/16 05/16 06/16 07/16 08/16 09/16 EA19 104.9 105.3 107.5 109.5 108.4 98.6 101.3 102.4 111.5 104.0 103.4 107.4 105.6 89.0 108.8 EU28 104.7 105.5 107.9 110.2 109.2 99.6 101.8 102.4 112.2 105.2 104.6 107.8 104.7 91.9 109.2 Belgium 107.7 110.5 109.2 110.5 108.2 101.4 106.6 105.4 116.6 107.3 104.3 112.7 100.5 94.7 : Bulgaria 107.7 108.3 109.2 114.6 118.0 116.1 108.2 106.5 112.4 109.9 103.7 115.9 116.3 109.2 112.9 Czech Republic 108.7 115.5 119.4 125.7 123.9 107.8 112.7 113.1 127.4 118.0 117.8 125.2 102.1 111.8 122.6 Denmark 104.7 108.9 111.0 111.6 108.3 99.4 107.2 101.6 109.3 103.9 106.3 110.0 96.3 107.2 107.4 Germany 111.8 112.4 113.1 113.3 115.1 102.9 103.9 106.6 117.5 108.7 106.4 112.1 109.3 103.6 114.5 Estonia 131.6 138.4 133.5 138.9 131.2 116.7 123.5 120.9 131.2 130.5 132.0 124.6 119.1 128.5 142.2 Ireland* 99.1 119.4 163.3 163.6 162.0 152.5 186.8 152.7 144.9 160.1 147.0 163.8 168.3 139.8 161.9 Greece 93.7 89.7 92.4 85.2 88.0 89.7 83.4 85.3 87.5 90.6 88.6 97.1 99.8 87.3 92.5 Spain 93.3 94.5 98.5 99.9 98.2 88.0 92.1 93.9 102.8 95.0 99.5 99.7 101.2 76.5 98.8 France 103.5 103.2 105.0 107.8 103.1 100.5 102.4 100.7 109.5 103.2 96.1 105.9 98.0 77.8 104.0 Croatia 91.1 94.2 99.4 103.0 102.7 95.1 88.5 91.9 106.5 99.5 101.7 96.8 102.3 87.7 101.3 Italy 98.5 96.2 97.7 101.1 95.8 79.9 88.5 93.9 101.2 92.1 100.2 96.0 106.1 61.8 99.5 Cyprus 76.8 76.3 80.3 75.3 73.2 75.5 68.8 71.3 77.0 78.8 82.1 87.8 96.5 72.4 : Latvia 118.8 119.7 122.1 131.5 125.8 117.2 103.1 100.0 121.5 122.4 127.0 127.9 124.2 123.6 125.0 Lithuania 116.4 116.5 116.4 131.7 130.0 122.3 118.7 119.3 121.2 112.5 120.8 120.4 120.7 117.8 125.6 Luxembourg 96.8 99.8 99.3 107.8 103.9 91.8 96.7 98.8 106.6 99.5 97.3 101.6 101.3 82.4 : Hungary 114.7 120.9 130.5 132.7 134.5 114.6 117.4 113.8 123.6 124.5 126.6 125.1 118.5 110.7 : Malta 104.9 98.7 103.6 106.7 97.3 84.9 88.4 90.8 102.6 97.2 97.7 101.8 102.6 88.8 104.0 Netherlands 92.7 91.4 86.9 96.1 101.4 99.3 101.9 98.0 104.9 93.3 88.0 89.4 81.2 78.4 91.4 Austria 115.7 115.5 117.1 118.5 117.9 108.8 100.2 102.5 120.9 112.9 110.6 115.4 112.4 101.8 : Poland 118.7 120.9 125.9 130.5 126.6 118.3 116.4 116.3 128.0 123.1 120.3 124.3 118.0 117.4 129.9 Portugal 97.7 95.6 99.1 101.5 98.6 87.2 96.3 96.8 99.3 98.4 100.6 101.9 102.6 83.9 100.7 Romania 127.1 132.0 137.1 141.2 139.9 122.6 124.4 126.2 137.1 134.3 133.7 131.8 135.2 117.2 141.9 Slovenia 104.8 105.7 113.0 113.4 112.0 96.5 107.0 108.1 120.3 110.2 115.4 119.1 115.6 96.9 121.4 Slovakia 125.7 131.7 141.5 149.4 152.4 128.3 131.1 142.8 145.0 145.5 147.5 148.4 113.9 137.6 : Finland 101.6 100.7 101.7 107.2 104.8 106.5 73.4 80.4 93.7 87.8 99.5 95.8 90.0 92.7 105.1 Sweden 100.0 96.1 103.3 106.7 106.0 98.8 94.7 96.5 108.3 102.9 97.0 99.6 79.1 83.6 104.8 United Kingdom 97.3 98.7 99.8 102.5 102.3 95.8 97.0 95.5 107.7 101.4 102.3 100.9 98.8 94.5 100.1 Norway 87.5 94.3 96.2 102.7 101.0 98.5 103.0 95.6 102.2 96.1 96.8 89.2 88.0 90.5 84.2 * Data for Ireland have been revised as of January 2015. The changes arise due to increased globalisation. Eurostat will review the underlying methodology in due course. : Data not available The source dataset is available here.