Analytics 101 - Getting Started

This document discusses analytics and data mining techniques. It begins by outlining common measures used in analytics like time, proportions, size, and financials. It then discusses the universal language of cause and effect in analytics and how analytics finds relationships between causes and effects. The document outlines various sources of data, fundamental concepts in analytics like increased computing power and data volume, and common tools. It provides examples of universal applications of analytics across marketing, customer service, and other functions. The document charts the evolution of analytics from basic surveys to more advanced techniques leveraging social media, text, and sensors. It outlines the CRISP-DM process for analytics projects and career paths in analytics. Finally, it discusses various data mining techniques categorized as

Recommended
Recommended
More Related Content
What's hot
What's hot (20)
Viewers also liked
Viewers also liked (17)
Similar to Analytics 101 - Getting Started
Similar to Analytics 101 - Getting Started (20)
Recently uploaded
Recently uploaded (20)
Analytics 101 - Getting Started
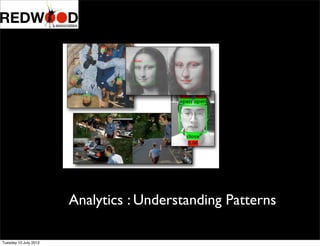
- 1. Analytics : Understanding Patterns Tuesday 10 July 2012
- 2. The Universal Language of Measures • Time • Proportions • Size • Financials • Productivity • Loyalty Tuesday 10 July 2012
- 3. The Universal Language of Cause & Effect • Process & Scale • Habits & Health • Technology & Efficiency • Consumer Understanding & Pricing • Risk & Return • Action & Outcome Tuesday 10 July 2012
- 4. Possibilities of no pattern unlikely ........ Cause Effect Analytics is finding the relationship/ path of Cause to Effect Effect = fn ( Data , Math , Common Sense) Tuesday 10 July 2012
- 5. Sources of Data • Survey’s • Transaction Systems • Free Text • Digital Images • Sensors • Voice • GPS • ..... Upto the Imagination Tuesday 10 July 2012
- 6. Fundamental Concepts • Exponential Increase in Computing Power • Explosion of Digitized Data • Open Source Data Mining & Statistical Software • Democratization of Multivariate Analytics ( N- Dimensional Plane ) Tuesday 10 July 2012
- 7. Tools For Data Mining & Predictive Modeling Tuesday 10 July 2012
- 8. Universal Applications • Direct Marketing • Scoring Applications • Forecasting • Identifying critical influencing drivers • Marketing • Customer Service • HR • Across all functions.... Regression - Deriving Drivers Cluster - Classifying & Grouping Tuesday 10 July 2012
- 9. Evolution of Analytics - The Answers Survey Analytics - Can I ask you? Transaction Data Analytics -You buy so you are Social Media Analytics - You are the company you keep Sentiment Analytics - You are what you feel Thought Analytics - You are how you think Pre 80’s 2005 2008 2010 Tuesday 10 July 2012
- 10. Evolution of Analytics - The Data & Techniques Questionnaire / Cross Tabs /Univariate /Bivariate Transaction Databases /Multivariate Web Logs / Text Mining/Multivariate Text /Voice/Imaging / Artificial Intelligence Sensors / Artificial Intelligence Pre 80’s 2005 2008 2010 Tuesday 10 July 2012
- 11. Executing Analytics Projects CRoss Industry Standard Process for Data Mining (CRISP-DM) for developing and deploying analytics solutions Problem Objectives Data Study Data Preparation Analysis & Modeling Evaluation Reporting & Deployment Determine Problem objectives Assess situation Determine data mining goals Produce project plan Collect initial data Describe data Explore data Verify data quality Select data Clean data Construct data Integrate data Format data Select analysis / modeling technique Generate test design Build model Assess model Evaluate results Review process Determine next steps Plan deployment Plan monitoring and maintenance Produce final report Review project Domain expert finalizes objectives with client Analysts use data mining software to integrate and understand relevant data Complex data cleansing algorithms used to collate all relevant data into an analytical data mart. Statisticians select techniques) based on hypothesis. Business consultants and analysts collaborate to unearth key drivers and forecast key business indicators. The solutions are evaluated and validated by the business users and practice head. The solutions are integrated with the relevant business processes. Tuesday 10 July 2012
- 12. Career Options Captives Core 3rd Party ITES Boutique Offshoring Geo Independent Internal Client External Client Products Analytics Division of Leading Companies Small Companies Focused on Niche Vertical & Function BI / AnalyticsVerticals of most ITES firms BFSI/ Retail Captives Product Companies Like SAS/IBM- SPSS/ STATISTICA etc Tuesday 10 July 2012
- 13. Techniques of Data Mining - 1 Technique Category Description Summarizing data Data Understanding Frequency counts of categorical variables . Central Tendency Measures for Numeric Standardizing data Data cleansing / Normalization Format standardization , missing value treatments Merging / Appending Data Preparation Integrating multiple databases to create single database (datamart buildup ) Variable Creation / Integration Data Preparation CreatingVariables which the users understand and derive meaning Cross Tabulation Reporting High level reporting of 2*2 or more variables Cubes Reporting Multi level and real time drill downs of all relevant variables Macro’s Automation Automatic generations of all standard reports / cubes. Tuesday 10 July 2012
- 14. Techniques of Data Mining - 2 Technique Category Description Measures of Central Tendency Data Understanding Enables identifying the outliers and the central values Hypothesis Testing / Correlations Analysis Identification of whether basic assumptions related to the data are valid or not . Used for simple analysis Regressions/ Factor Analysis / ARIMA Predictive Modeling Identifying the factors on which the key situation at hand is dependent on. Forecasting Key Indicators Clustering Models Grouping / Segmentation Bucketing records into mutually homogenous & collectively heterogenous groups Text Algorithms Grouping Preparing unstructured data to be in a form for advanced statistical modeling Artificial Intelligence/Neural Networks Inference and Judgement Analytics Building automated engines which analyze information in a ‘human’ simulated manner Decision Trees/Chaid /SEM Grouping / Segmentation Root Cause Analysis , Path / Dependency Analysis Tuesday 10 July 2012
- 15. Thank You Tuesday 10 July 2012